
These Orderflow Snapshots for ETH/USDT (dated March 27, 2026) show Ethereum, like Bitcoin, at a critical technical junction, but with a unique and powerful divergence between long-term and short-term market players.
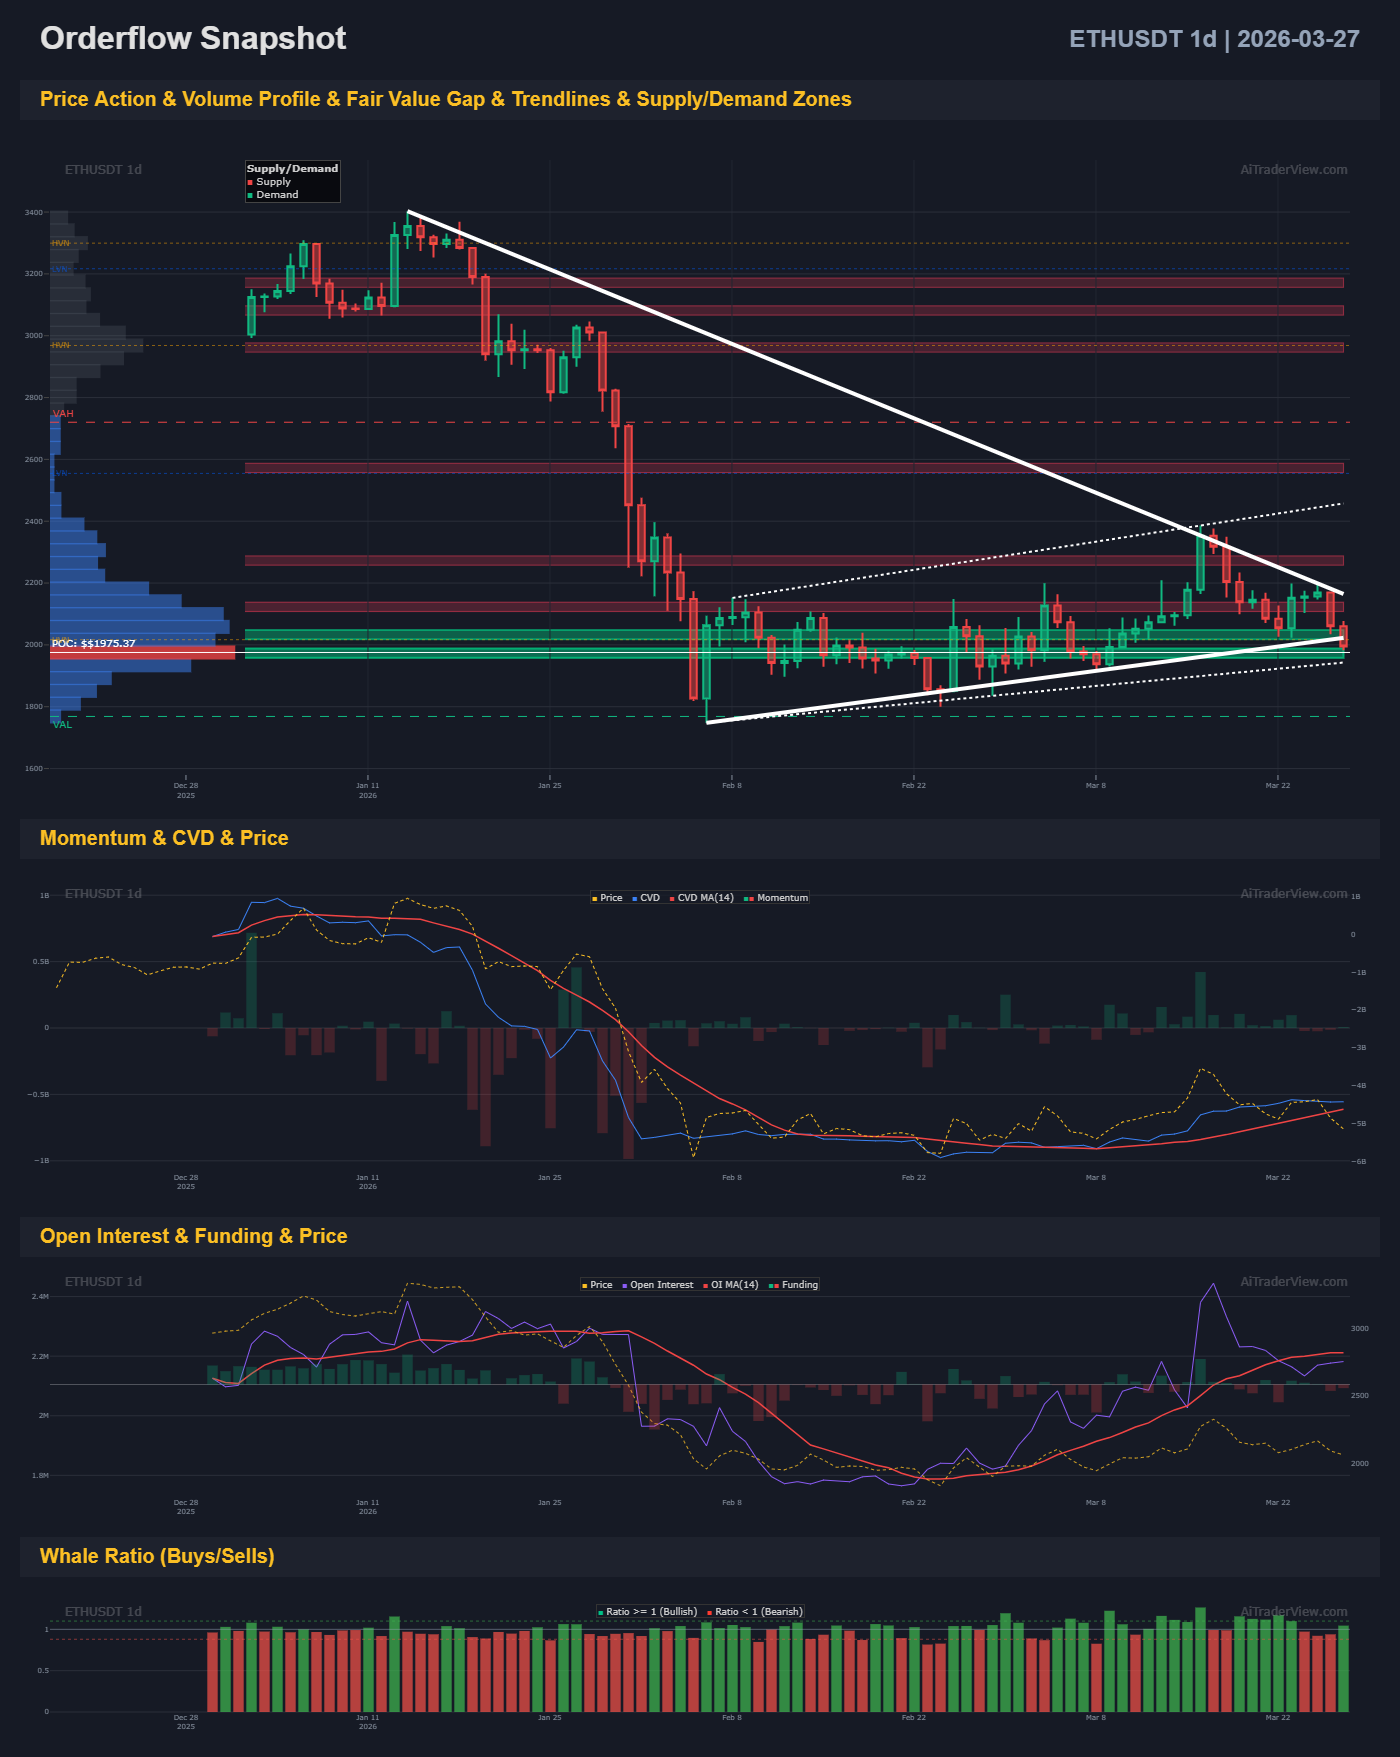
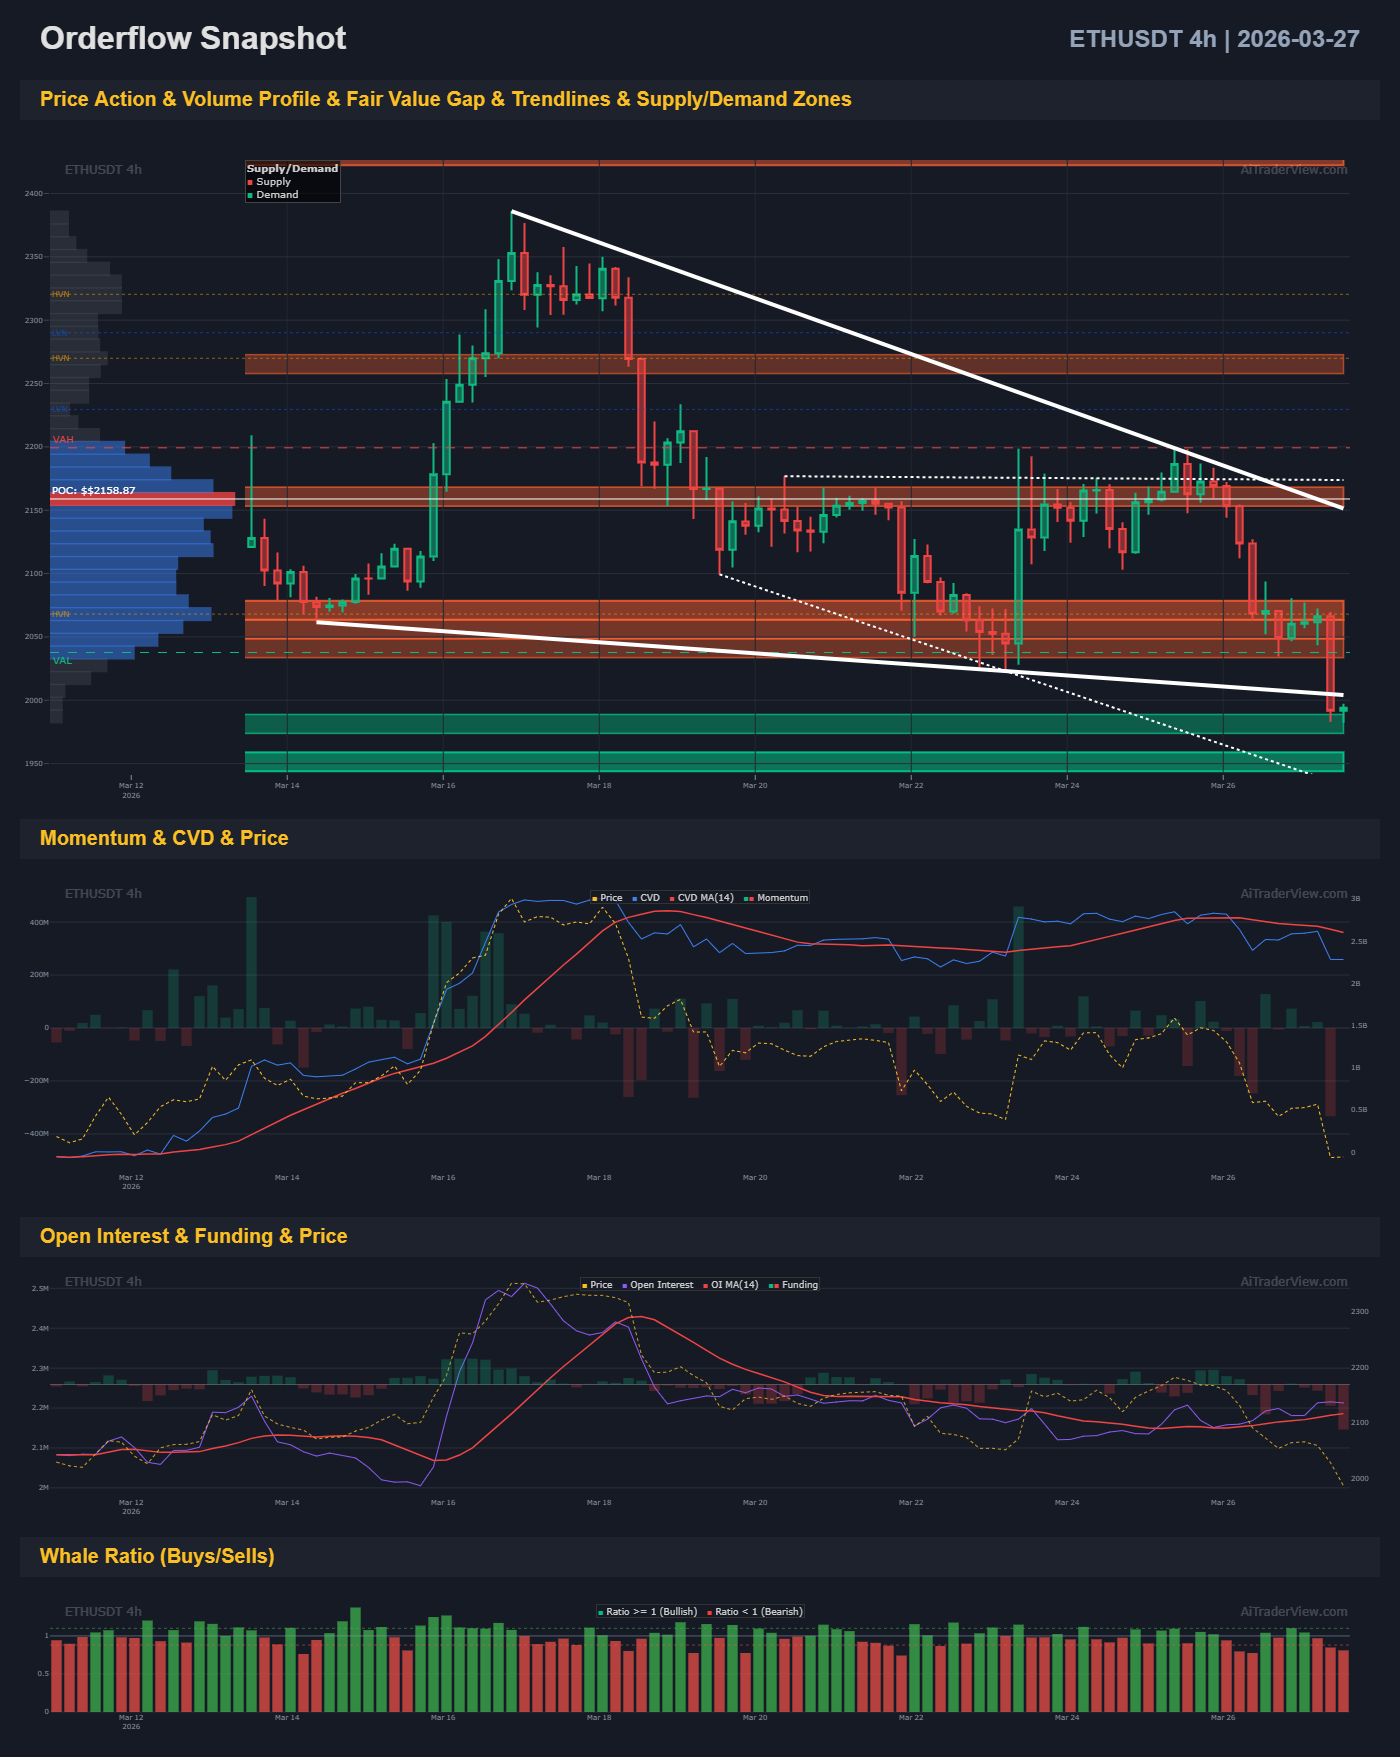
1. Price Action & Volume Profile
Ethereum has experienced a significant correction from its highs, and is now consolidating within a large, multi-month descending triangle.
- Daily Chart (1d): The macro view shows a massive volume concentration with the Point of Control (POC) at $1,975.37. This level has become an incredible anchor for the price and is now the most critical support zone. As long as ETH holds above this “line in the sand,” a larger bottom formation is possible. We see Supply Zones (resistance) stacked around $2,200, $2,600, and $3,000.
- 4-Hour Chart (4h): The short-term view reveals a localized descending triangle with a 4h POC at $2,158.87. The price is currently testing the bottom of this smaller triangle and the immediate Demand Zone around $2,000–$2,050. This is the ultimate “prove it” zone for the bulls.
2. Momentum & CVD (Cumulative Volume Delta)
The CVD tracks aggressive ‘market-order’ pressure, showing which way the smart money is hitting the button.
- CVD Line: Across both timeframes, the CVD is trending lower. This indicates that net market-order pressure remains strongly bearish; aggressive sellers are still dominant on the tape.
- Momentum: On the 4h chart, momentum is well below the zero line, signaling immediate weakness. On the daily chart, however, the momentum indicator is flattening out, a classical signal of potential seller exhaustion on a macro scale.
3. Open Interest (OI) & Funding Rates
This measures trader leverage and positioning.
- Open Interest: We see a striking divergence. On the daily chart, Open Interest is rising. However, on the 4h chart, OI is falling significantly. This strongly suggests Long Liquidations on the short-term frames—over-leveraged bulls are being flushed out by the sellers.
- Funding: Funding rates are neutral to low across both timeframes. There is no extreme greed, indicating the market has reset its leverage.
4. Whale Ratio (Buys/Sells)
This indicator is the key differentiator in the current ETH market.
- Daily Snapshot: The whale ratio is predominantly green, indicating that long-term whales are aggressively accumulating ETH as it hits the multi-month POC around $1,975. They see value here.
- 4h Snapshot: Conversely, the short-term whale ratio is mostly red, meaning that whales with shorter time horizons are currently selling or hedging their positions. They are de-risking in anticipation of a potential breakdown.
Summary: The Divide at the Apex
Ethereum is caught between two powerful, opposing forces at the apex of its macro triangle.
| Factor | Signal | Interpretation |
| Daily Whale Ratio | ✅ Strongly Green (Accumulation) | The Smart Money sees long-term value at $1,975 POC. |
| 4h Whale Ratio | ❌ Strongly Red (De-risking) | Short-term whales are fearful and selling the current resistance. |
| CVD & Momentum (Macro) | ⚠️ Flattening / High Exhaustion | Sellers are still aggressive, but the downward force is weakening. |
| Open Interest (4h) | ⚠️ Falling (Liquidations) | Immediate market panic and long liquidation cascades. |
Final Verdict: The $1,950 – $2,000 zone is the absolute battlefield. If the macro POC can hold the selling pressure, the long-term whale accumulation will prevail, likely triggering a sharp rally. If it fails, the panic of the short-term sellers could lead to a swift move down to test lower liquidity zones (e.g., $1,800).
⚠️ RISK WARNING & AI DISCLOSURE
- This information is generated by Artificial Intelligence (AI) and complex algorithms. While advanced, these systems can contain errors or inaccuracies and are for educational purposes only.
- Technical analysis provides no guarantees; this information is purely informative.
- All discussed scenarios are hypothetical and do not constitute predictions or expectations.
- Past performance is not an indicator of future results.
- This is not financial advice and is not intended as a call-to-action for the reader.
- No implicit direction is claimed, and no specific behavior of market participants is suggested.