
These Orderflow Snapshots for BTC/USDT (dated March 27, 2026) reveal a market standing at a major crossroads. Following a period of correction, we are witnessing a high-stakes “tug-of-war” between aggressive sellers and opportunistic buyers within a tightening range.
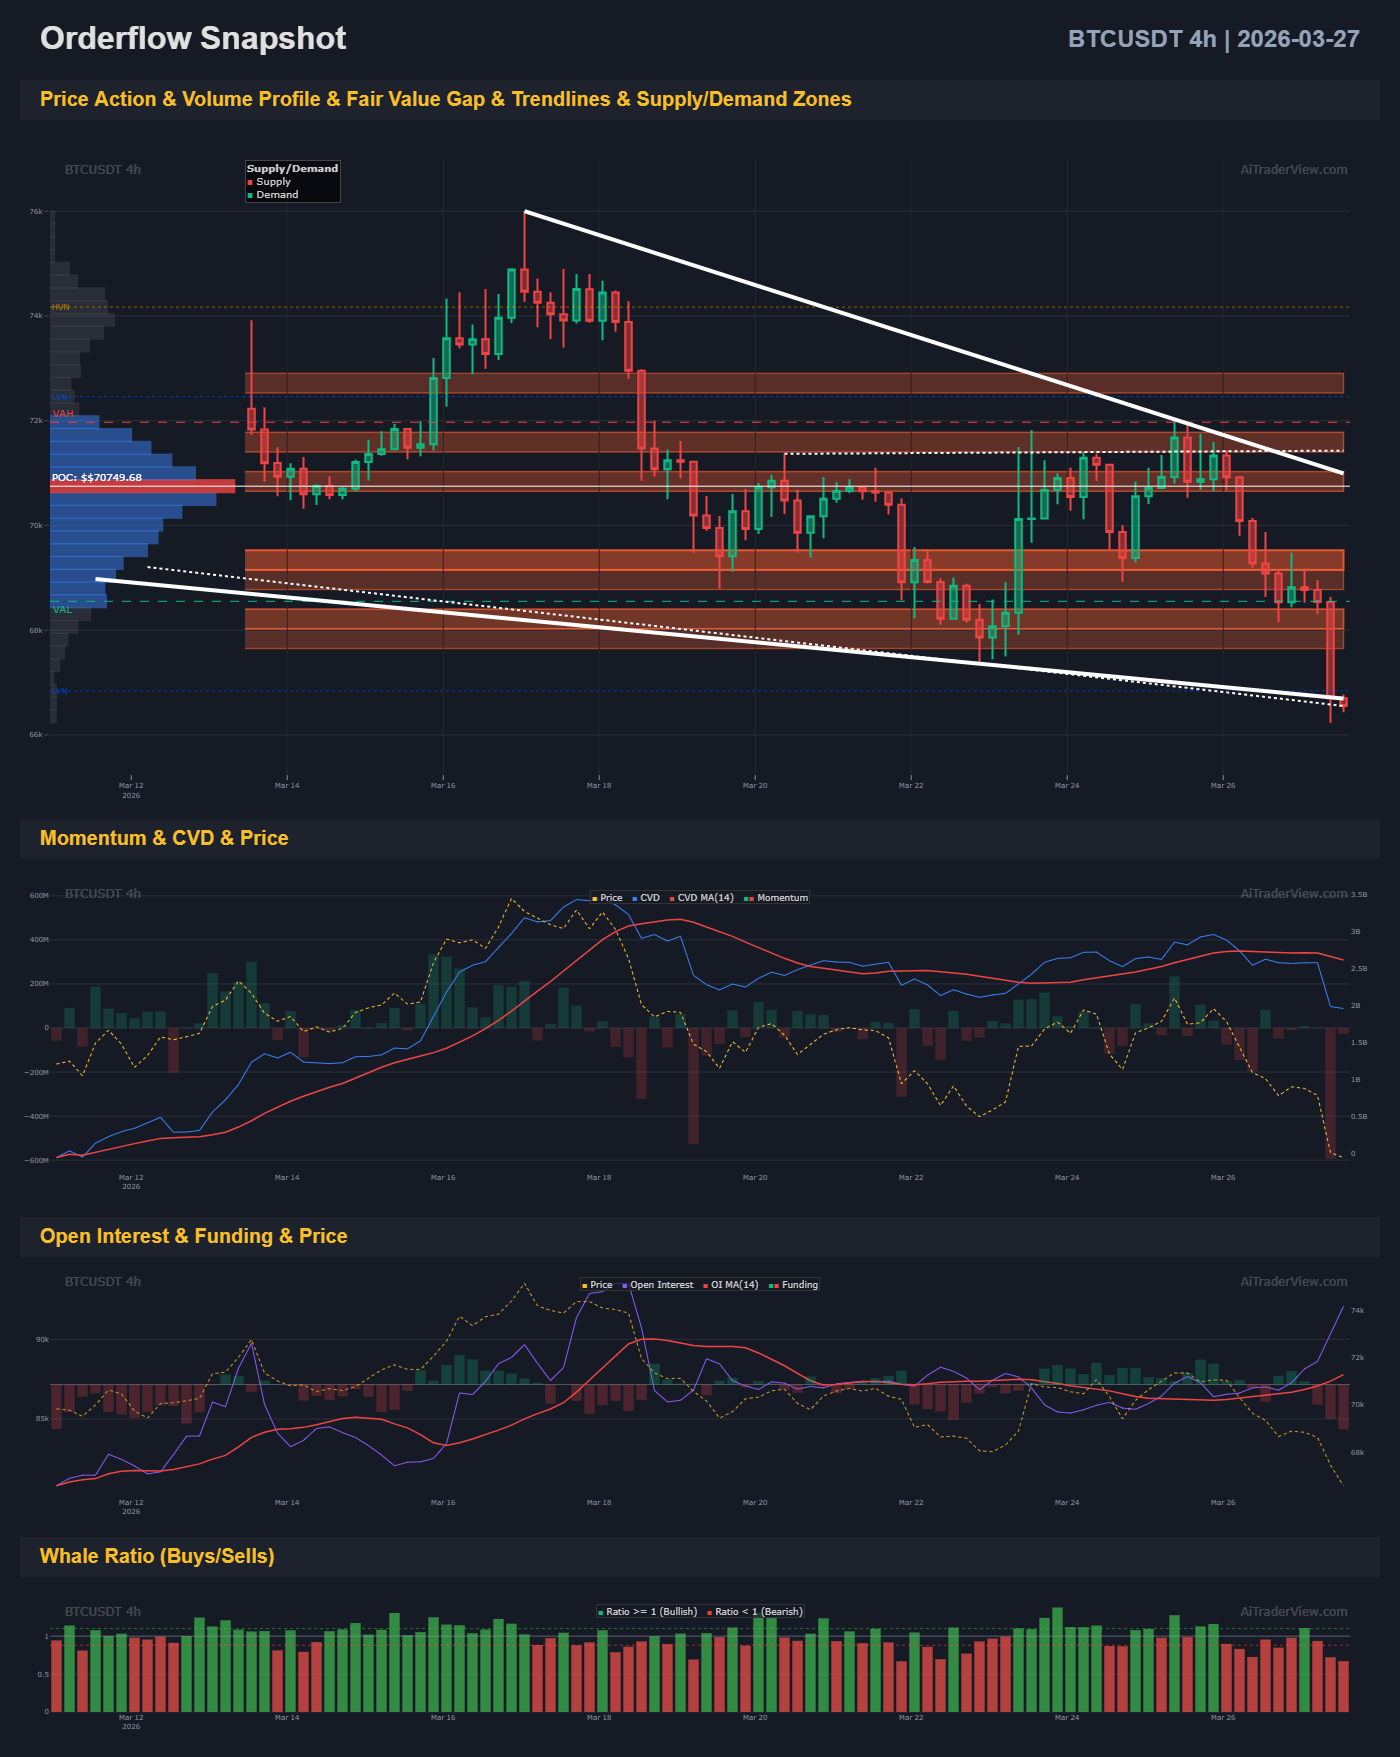
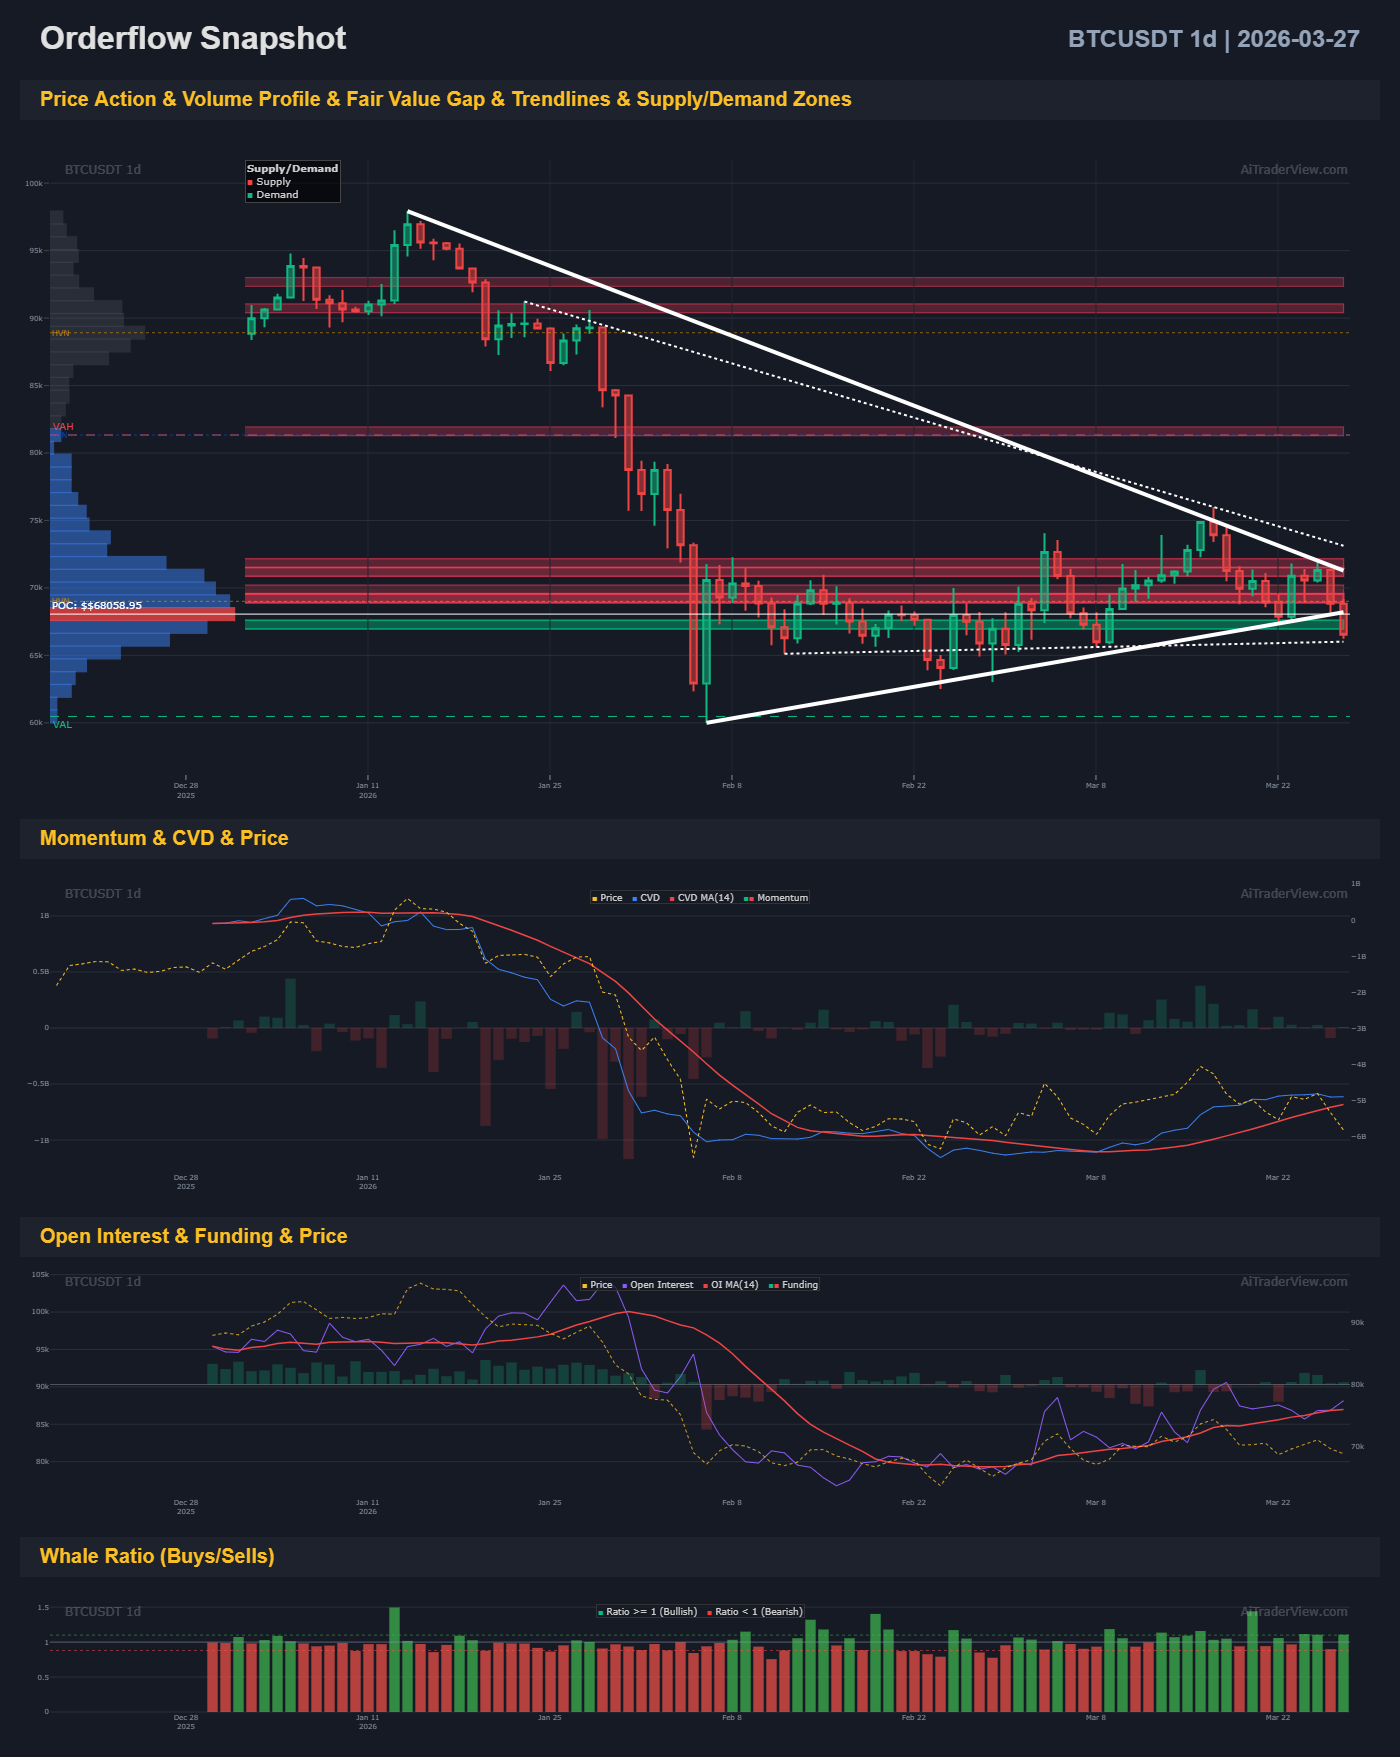
1. Price Action & Volume Profile
Bitcoin is currently compressed within a descending triangle or a broad consolidation phase.
- 4-Hour Chart (4h): Price is oscillating around the Point of Control (POC) at $68,749. This is the level where the highest volume has been transacted, acting like a magnet. We see a clear Supply Zone (resistance) between $72k – $73k and a Demand Zone (support) between $66k – $68k.
- Daily Chart (1d): The macro view shows a significant correction from the $95k – $100k peak. The daily POC sits at $66,958. As long as BTC holds above this “anchor,” a bottom formation remains on the table.
2. Momentum & CVD (Cumulative Volume Delta)
The CVD tracks whether market participants are aggressively hitting the ‘buy’ or ‘sell’ button.
- CVD Line: Across both timeframes, the CVD is trending lower or drifting sideways. This indicates that net market-order pressure remains slightly bearish; sellers are still more aggressive than buyers for now.
- Momentum: On the 4h chart, momentum has dipped below the zero line, signaling short-term weakness. However, the daily chart shows momentum flattening out, which often hints at seller exhaustion.
3. Open Interest (OI) & Funding Rates
This reflects the “leverage” and sentiment of futures traders.
- Open Interest: The 4h chart shows OI dropping alongside the price. This is a classic sign of Long Liquidations—over-leveraged bulls are being forced out of their positions.
- Funding: Funding rates are neutral to slightly positive. The market isn’t in a state of extreme euphoria, which is actually a healthy sign for a potential trend reversal. The “excess fat” (high leverage) has been flushed out.
4. Whale Ratio (Buys/Sells)
This tells us what the “Smart Money” is doing.
- 4h Snapshot: Recent bars are predominantly red, suggesting that large accounts are currently de-risking or hedging their positions in the short term.
- 1d Snapshot: The long-term view is more optimistic. Green bars (whale buying dominance) appear frequently around the $65k – $68k zone, suggesting that whales view these levels as a prime accumulation area.
Summary: The Road Ahead
Bitcoin is in a “Make or Break” zone. The data suggests the “flush” is nearly complete, but the bulls haven’t reclaimed full control yet.
| Scenario | Key Levels | Indicator to Watch |
| Bullish Case | Break above $72,500 | CVD turns positive + Whale Ratio flips green |
| Bearish Case | Drop below $66,900 | Increasing OI on price drops (short-selling) |
Final Verdict: We are hovering on a massive volume support (POC). If the $67k area holds, the descending triangle could resolve in a powerful upward break. If it fails, we likely test the $60k psychological floor.
⚠️ RISK WARNING & AI DISCLOSURE
- This information is generated by Artificial Intelligence (AI) and complex algorithms. While advanced, these systems can contain errors or inaccuracies and are for educational purposes only.
- Technical analysis provides no guarantees; this information is purely informative.
- All discussed scenarios are hypothetical and do not constitute predictions or expectations.
- Past performance is not an indicator of future results.
- This is not financial advice and is not intended as a call-to-action for the reader.
- No implicit direction is claimed, and no specific behavior of market participants is suggested.