

This analysis maps out the market structure in detail, visualizing the transition from a bearish trend, through a consolidation phase, into a convincing bullish breakout.
1. Market Structure & Price Action (The Basics)
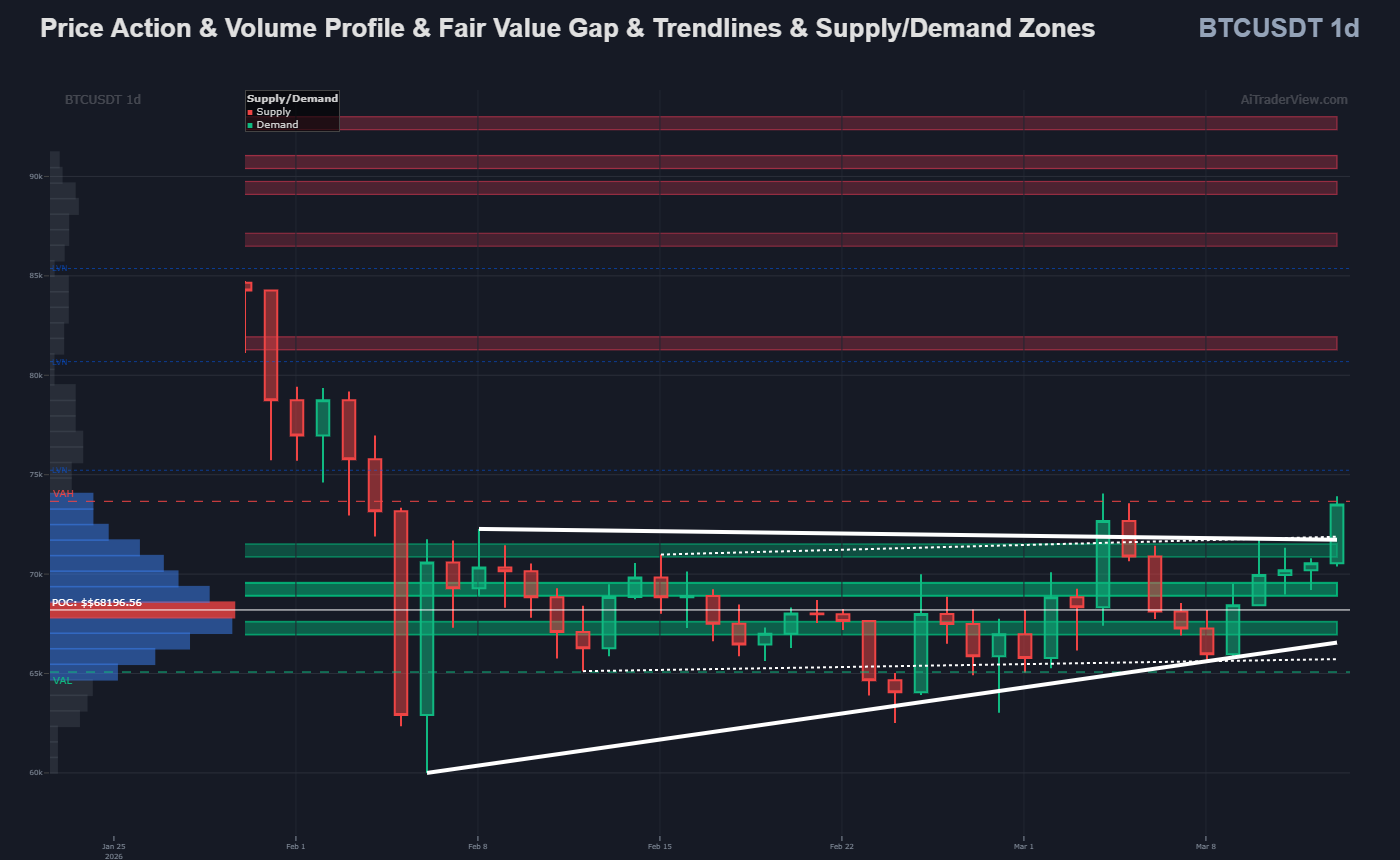
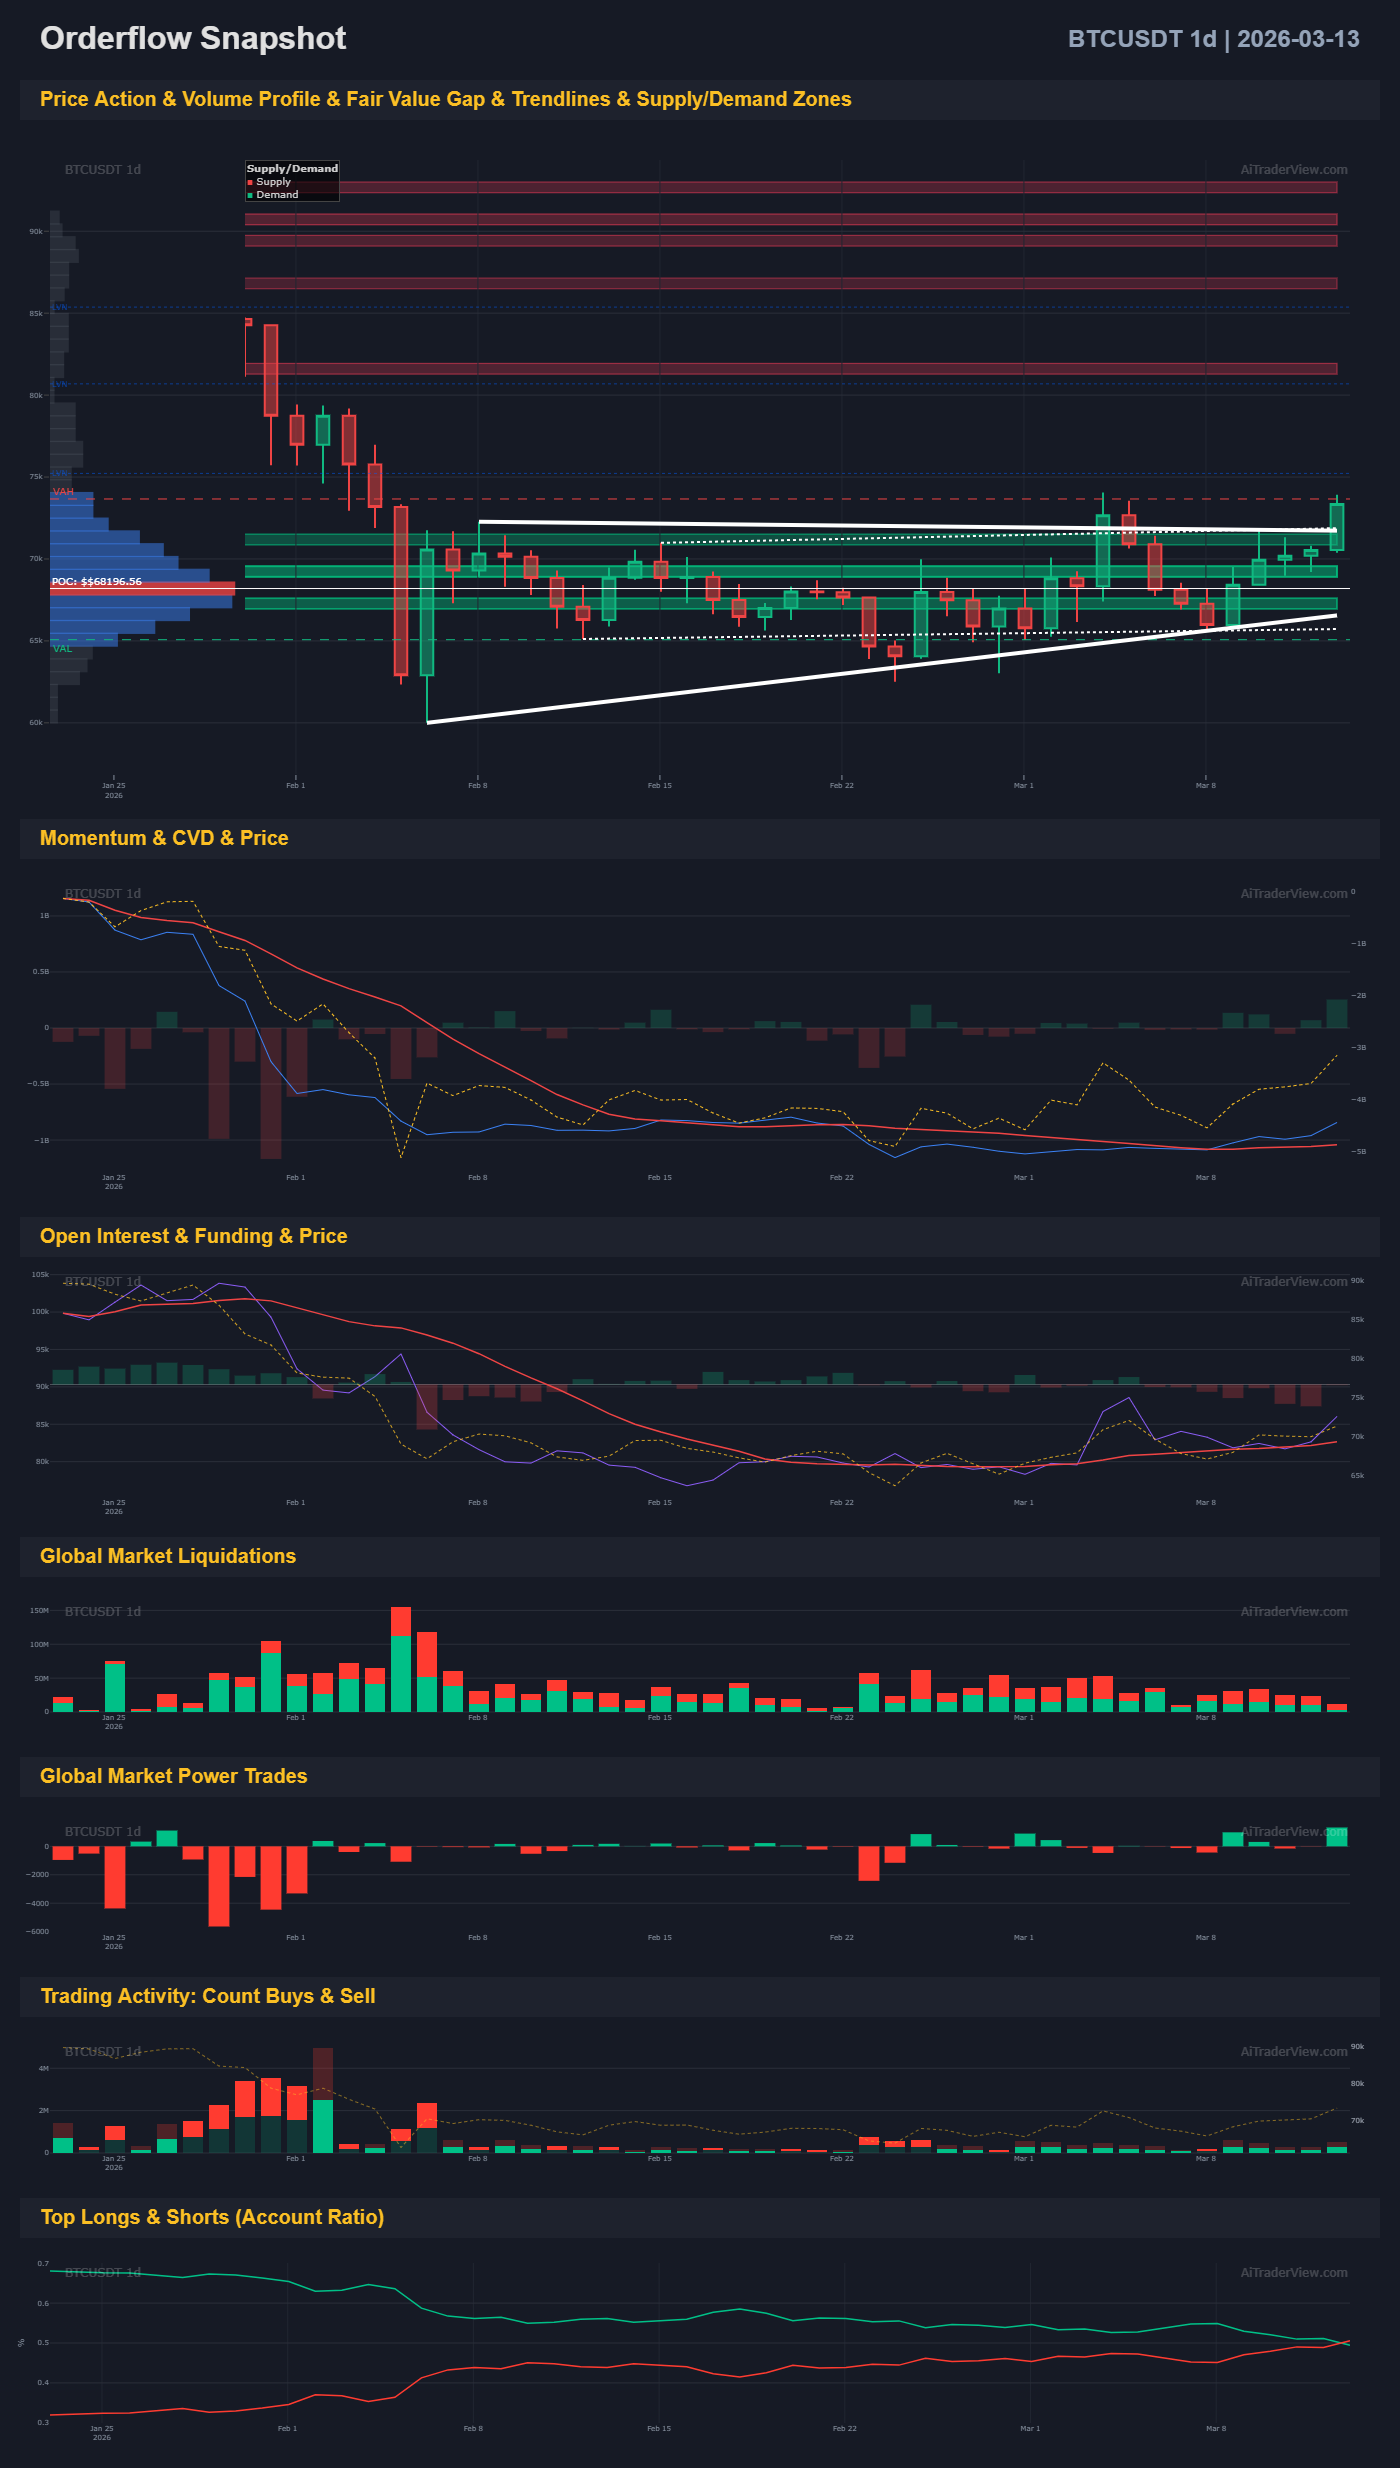
The price action displays a perfect technical transition where the market sought out new value areas.
- Bottom & Consolidation: The initial price drop was perfectly absorbed in the green Demand Zones (buyer territory). Following this, the price moved sideways within a converging wedge pattern between trendlines.
- Volume Profile (Value Acceptance): During consolidation, the majority of the volume was traded around the Point of Control (POC) at $68,196.56. This created a large High Volume Node (HVN) that the market accepted as the ‘fair’ price. The lower boundary of this value zone, the Value Area Low (VAL) around $64,000, held firm as strong support.
- The Breakout: The trend reversal is now a technical reality. The price has convincingly broken out of the converging wedge pattern and surged above the Value Area High (VAH) around $73,000. The market no longer accepts the old price range and is aggressively seeking higher values, currently testing the red Supply Zones (resistance bands).
2. Momentum & Smart Money (The Confirmation)
A technical breakout only holds weight if the underlying volume supports it. The orderflow provides irrefutable evidence for this: sellers are exhausted, and buyers have taken control.
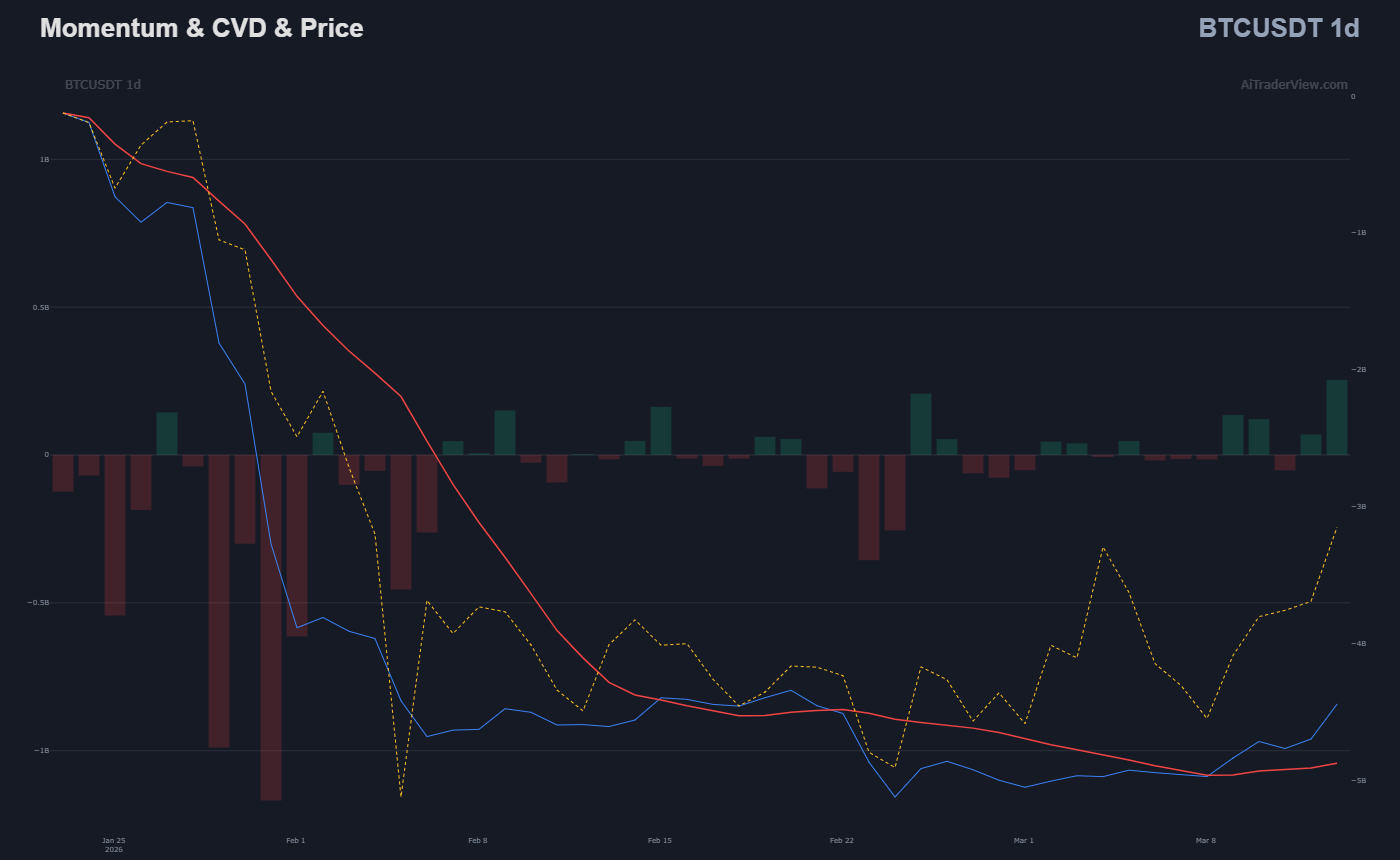
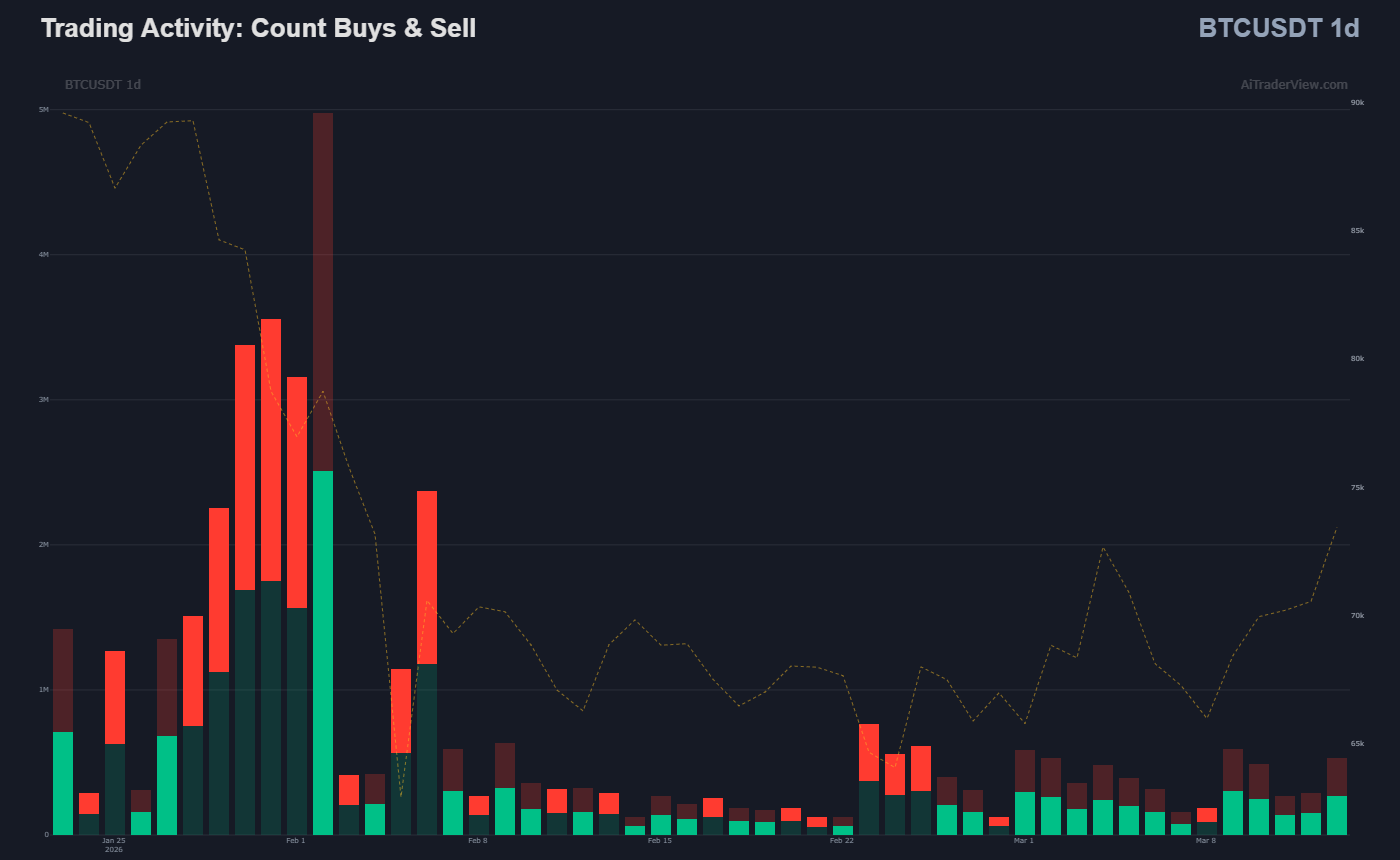
- Buyers Take Control: The blue CVD (Cumulative Volume Delta) line has stopped falling, formed a bottom, and is now aggressively crossing above its red 14-day average. This is supported by rising trading volume following a period of depletion, along with a green momentum histogram. There is a strong net buying volume.
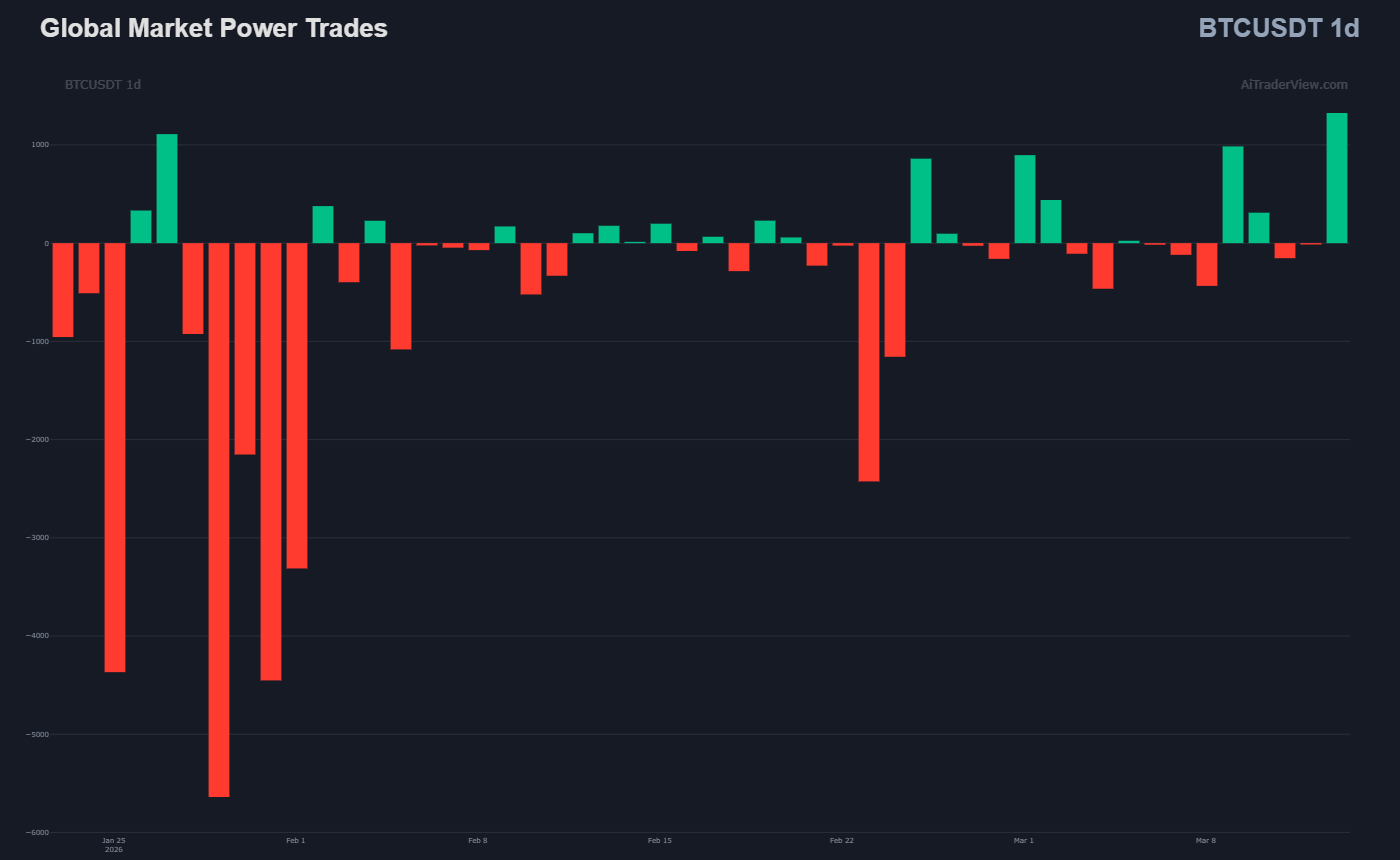
- Whales Are Stepping In: Where Power Trades during the downtrend were dominated by massive red selling blocks (dumping institutions), these have now been replaced by enormous green blocks. ‘Smart money’ is currently buying aggressively using market orders.
3. Sentiment & The Short Squeeze (The Fuel)
The current rally is not just organic; it is being explosively accelerated by traders who were caught on the wrong side of the market. This dynamic is the “Sweet Spot” of the dataset.
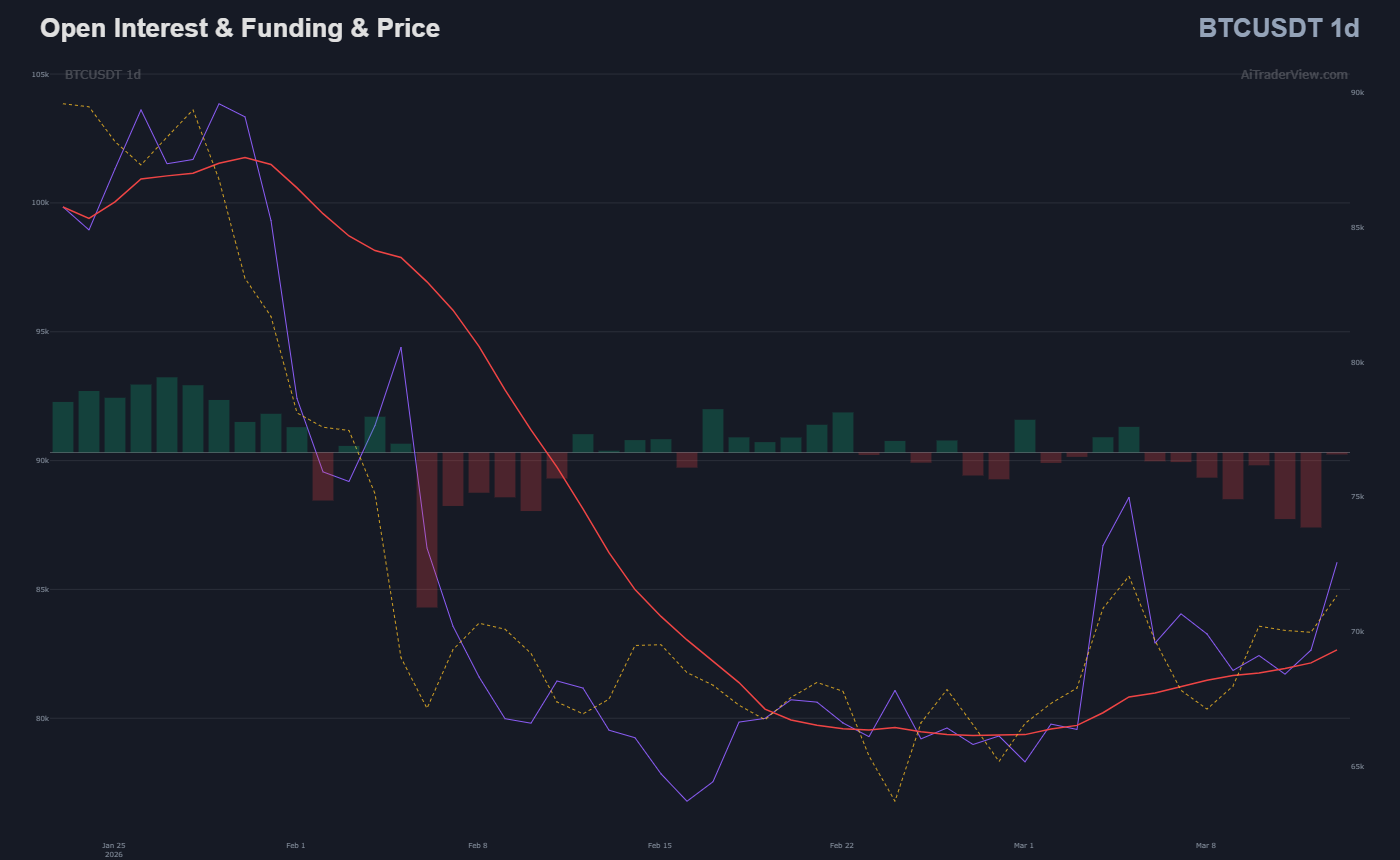
- Influx of New Capital: Following a sharp decline and a quiet consolidation period, the Open Interest (blue line) is now shooting almost vertically upwards, far above its red 14-day average. This validates the breakout: fresh capital is aggressively flowing into the market.
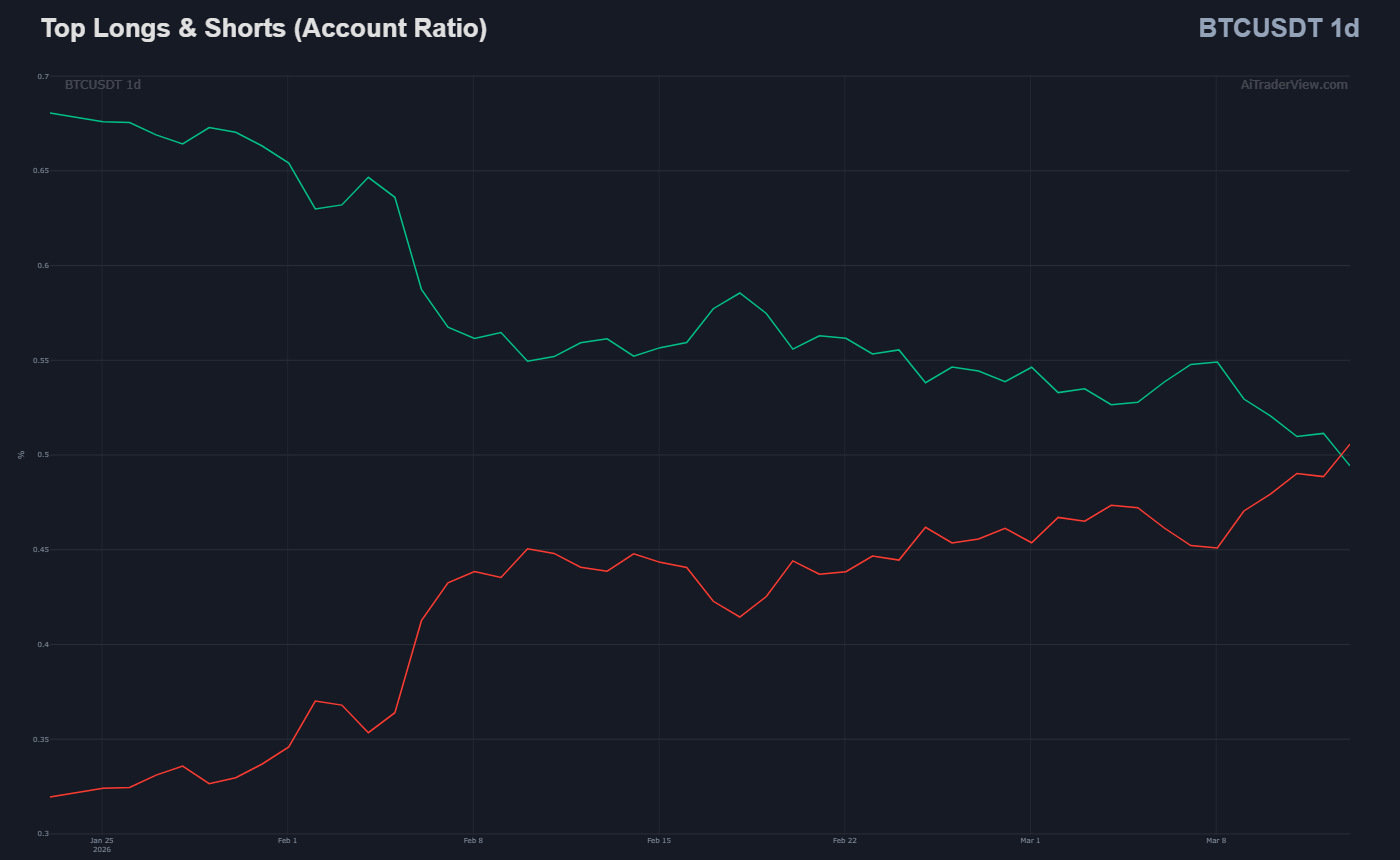
- Disbelief Among Top Traders: While the market was gearing up for the breakout, top accounts did not believe in a reversal. They reduced their long positions (falling green line) and opened massive shorts (rising red line), causing the two lines to cross.
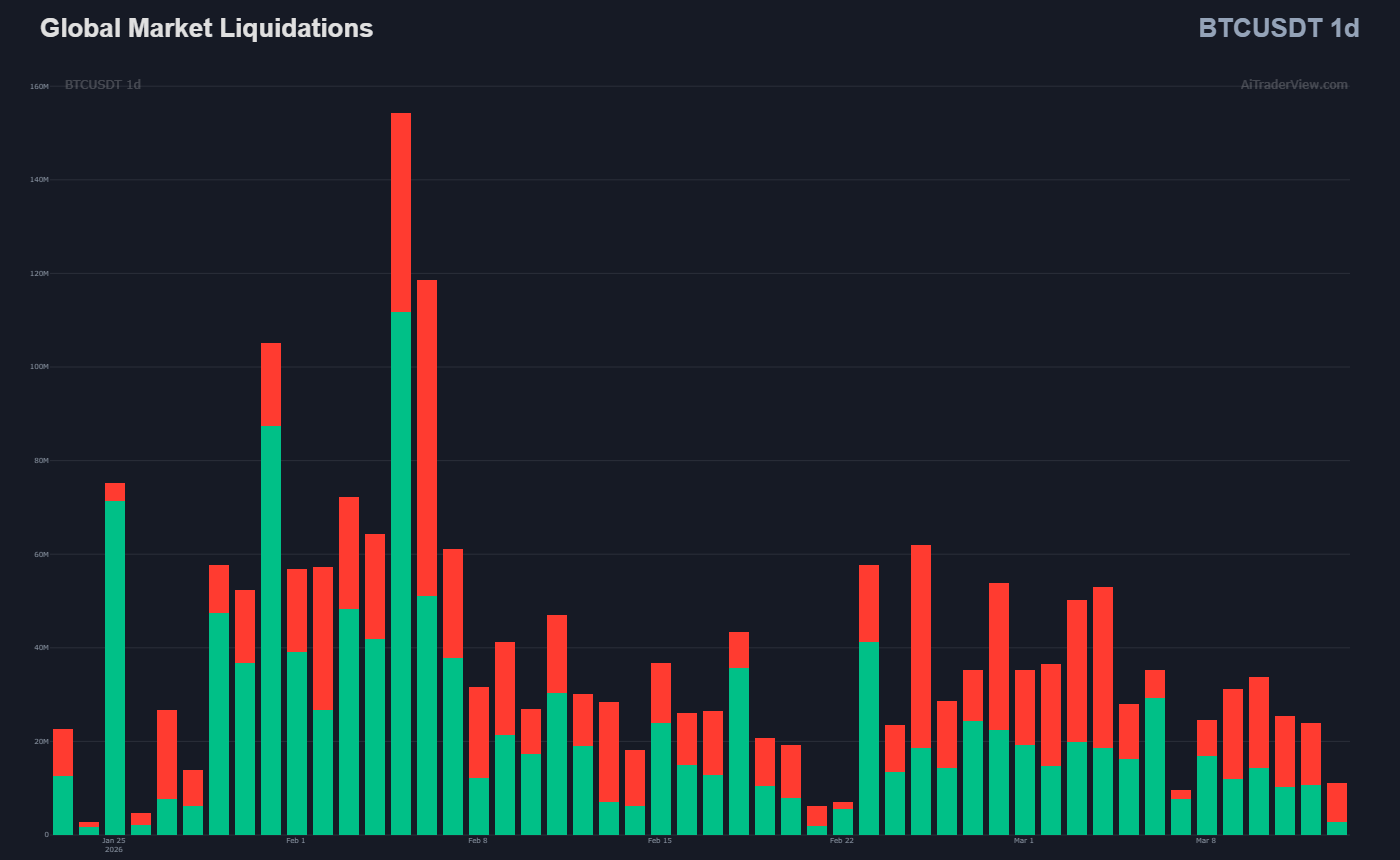
- Liquidations as Rocket Fuel: Because top traders were aggressively shorting while smart money pushed the price above the VAH, shorters got trapped. This triggered a chain reaction of red liquidation blocks. A liquidated short results in a mandatory buy order, acting as rocket fuel for a short squeeze and pushing the price even higher.
4. Crucial Levels for the Future
Based on the Volume Profile and liquidity zones, these are the key levels to monitor going forward:
- Confirmation & Further Upside: The trend remains intact as long as the price stays above ~$73,000 (VAH and previous resistance). The first obstacle lies around $75,000 (the first Low Volume Node, or LVN). If the price breaks through this level with volume, it could quickly surge towards the heavy red Supply Zones around $80,000 – $82,000, as historically little resistance has been built up in that area.
- Sign of Weakness: A drop back below ~$73,000 suggests a potential fake-out.
- Trend Invalidation (Bearish): A decline below the POC ($68,196.56) means sellers have reclaimed the consolidation zone. If the price falls below the VAL (~$64,000) and the green Demand Zones, the bottom structure is definitively broken, and the bear market resumes.
Final Conclusion
The AiTraderView software has captured the market dynamics highly accurately. There is an undeniable trend reversal from bearish to bullish. This shift is technically rock-solid (breaking above the VAH and trendlines) and is fundamentally backed by aggressive incoming buying volume from whales and an explosion in Open Interest. The structural disbelief of top traders provided the breakout with extra momentum through a short squeeze. The market is now firmly in the hands of the bulls, with ~$73,000 acting as the crucial line in the sand to maintain upward pressure.
Do you also want to learn our software? You can use it for free. We have over 50+ Knowledge Base articles explaining how our software works. Register a FREE account and start using the AiTraderView.com webapp today for FREE!!!!
The information provided in this article is for educational and informational purposes only and does not constitute financial, investment, or trading advice. Cryptocurrency markets are highly volatile and carry significant risk. Always conduct your own research (DYOR) and consult a regulated financial advisor before making any investment decisions. Past performance is not indicative of future results.
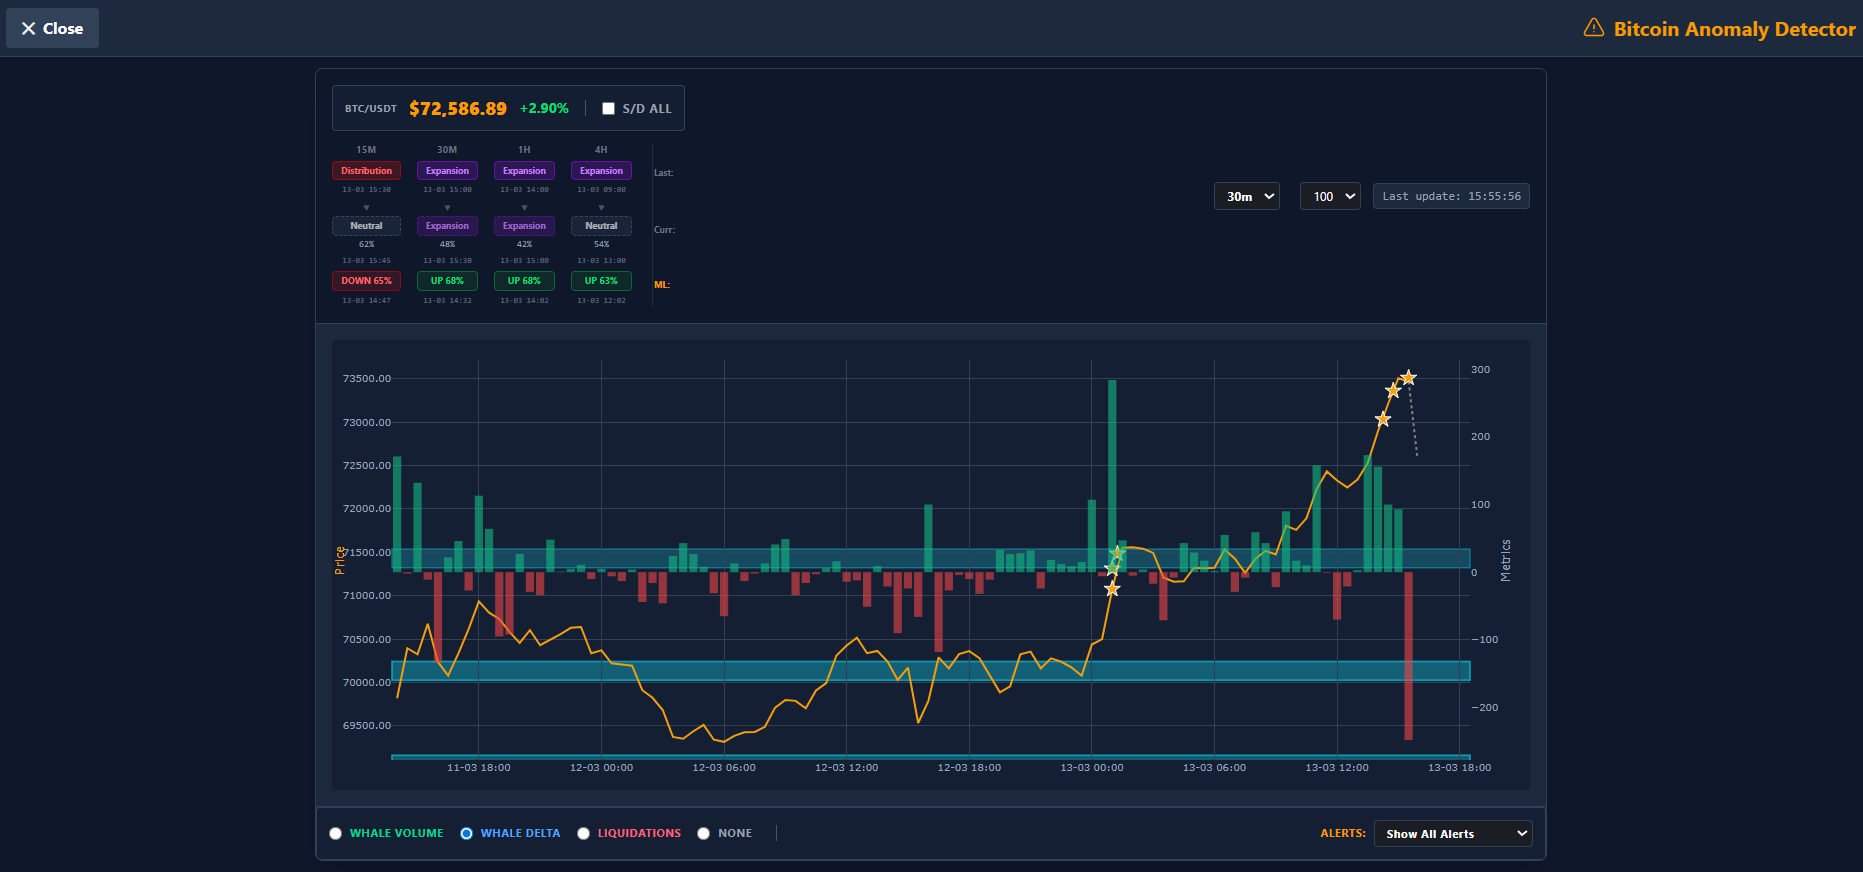
🚨 Live Update: The $73k Breakout and The Immediate Resistance Wall
Addendum based on real-time orderflow data (March 13, 14:00 – 15:30)
Exactly as outlined in the analysis above, the market reached its critical “make or break” moment this afternoon, culminating in a violent test of the $73,000 threshold. The latest incoming data provides a textbook example of how whales use liquidity.
The Predicted Squeeze Plays Out (14:00 – 15:00) The anticipated short squeeze materialized with explosive force.
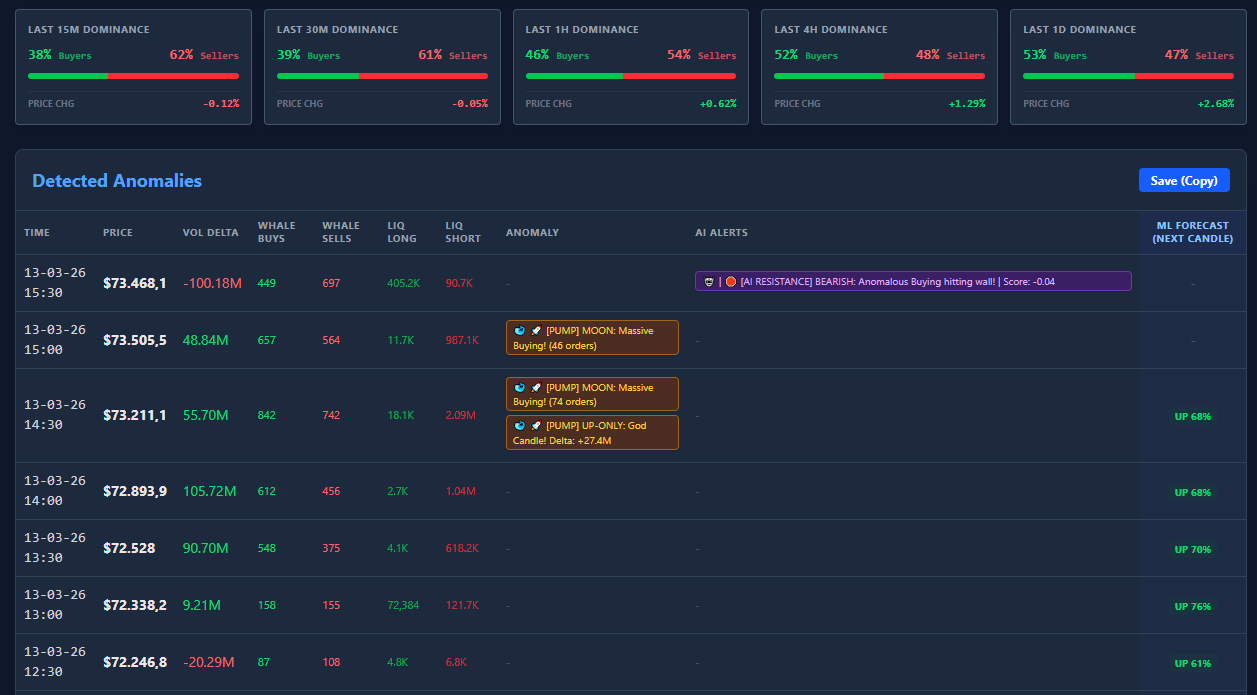
- The Breakout: At 14:30, the price violently breached the $73,000 mark. This move was fueled by extreme buying pressure, recording a positive Volume Delta of +55.7M and a staggering 2.08 million in short liquidations in just 30 minutes.
- Peak Momentum: By 15:00, the price peaked at $73,505.50. The system’s algorithms registered multiple severe alerts, including: 🐋 🚀 Massive Buying! and God Candle!
The Brick Wall: Whales Sell into the Squeeze (15:30) However, the 15:30 data print reveals a crucial shift in market dynamics. While the price remains above the Value Area High (VAH), it has collided with a massive wall of resistance.
- Delta Implosion: The Volume Delta aggressively flipped from heavily positive to -100.18 million. This indicates a massive and sudden influx of selling pressure.
- Whales Switch Sides: Large market players used the liquidity generated by the trapped shorts to offload their own bags or open massive new short positions. In this 30-minute window, Whale Sells (697) heavily outweighed Whale Buys (449).
- Late Longs Punished: As the momentum abruptly halted, FOMO (Fear Of Missing Out) buyers were instantly trapped, resulting in a sudden spike of 405,200 in long liquidations.
- Critical AI Trigger: The AiTraderView system immediately flagged this anomaly, issuing a stark warning: 🤖 | 🛑 [AI RESISTANCE] BEARISH: Anomalous Buying hitting wall!
What This Means for the Trend This real-time data perfectly illustrates the “Crucial Levels” section of our main report. The bulls have successfully pushed the price into the $73,000+ zone, but the ‘Smart Money’ is fiercely defending this territory. If the market cannot absorb this new wave of whale selling and fails to hold $73,000 as new structural support, this aggressive pump risks becoming a devastating fake-out (liquidity grab).
The coming hours are critical: watch the Volume Delta closely to see if buyers step back in, or if the bears drag the price back into the consolidation zone.
⚠️ RISK WARNING & AI DISCLOSURE
- This information is generated by Artificial Intelligence (AI) and complex algorithms. While advanced, these systems can contain errors or inaccuracies and are for educational purposes only.
- Technical analysis provides no guarantees; this information is purely informative.
- All discussed scenarios are hypothetical and do not constitute predictions or expectations.
- Past performance is not an indicator of future results.
- This is not financial advice and is not intended as a call-to-action for the reader.
- No implicit direction is claimed, and no specific behavior of market participants is suggested.