
Technical Analysis per Indicator
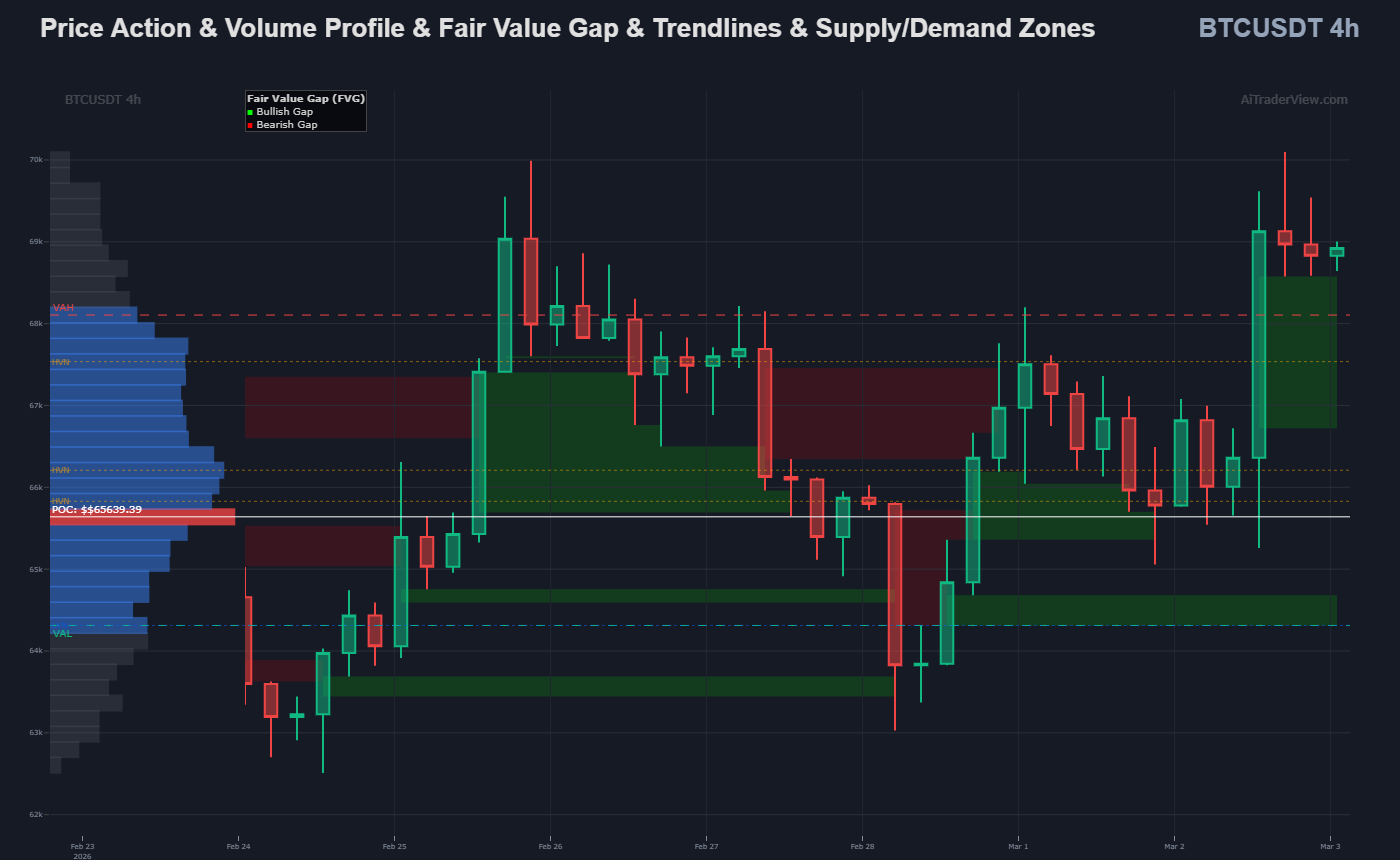
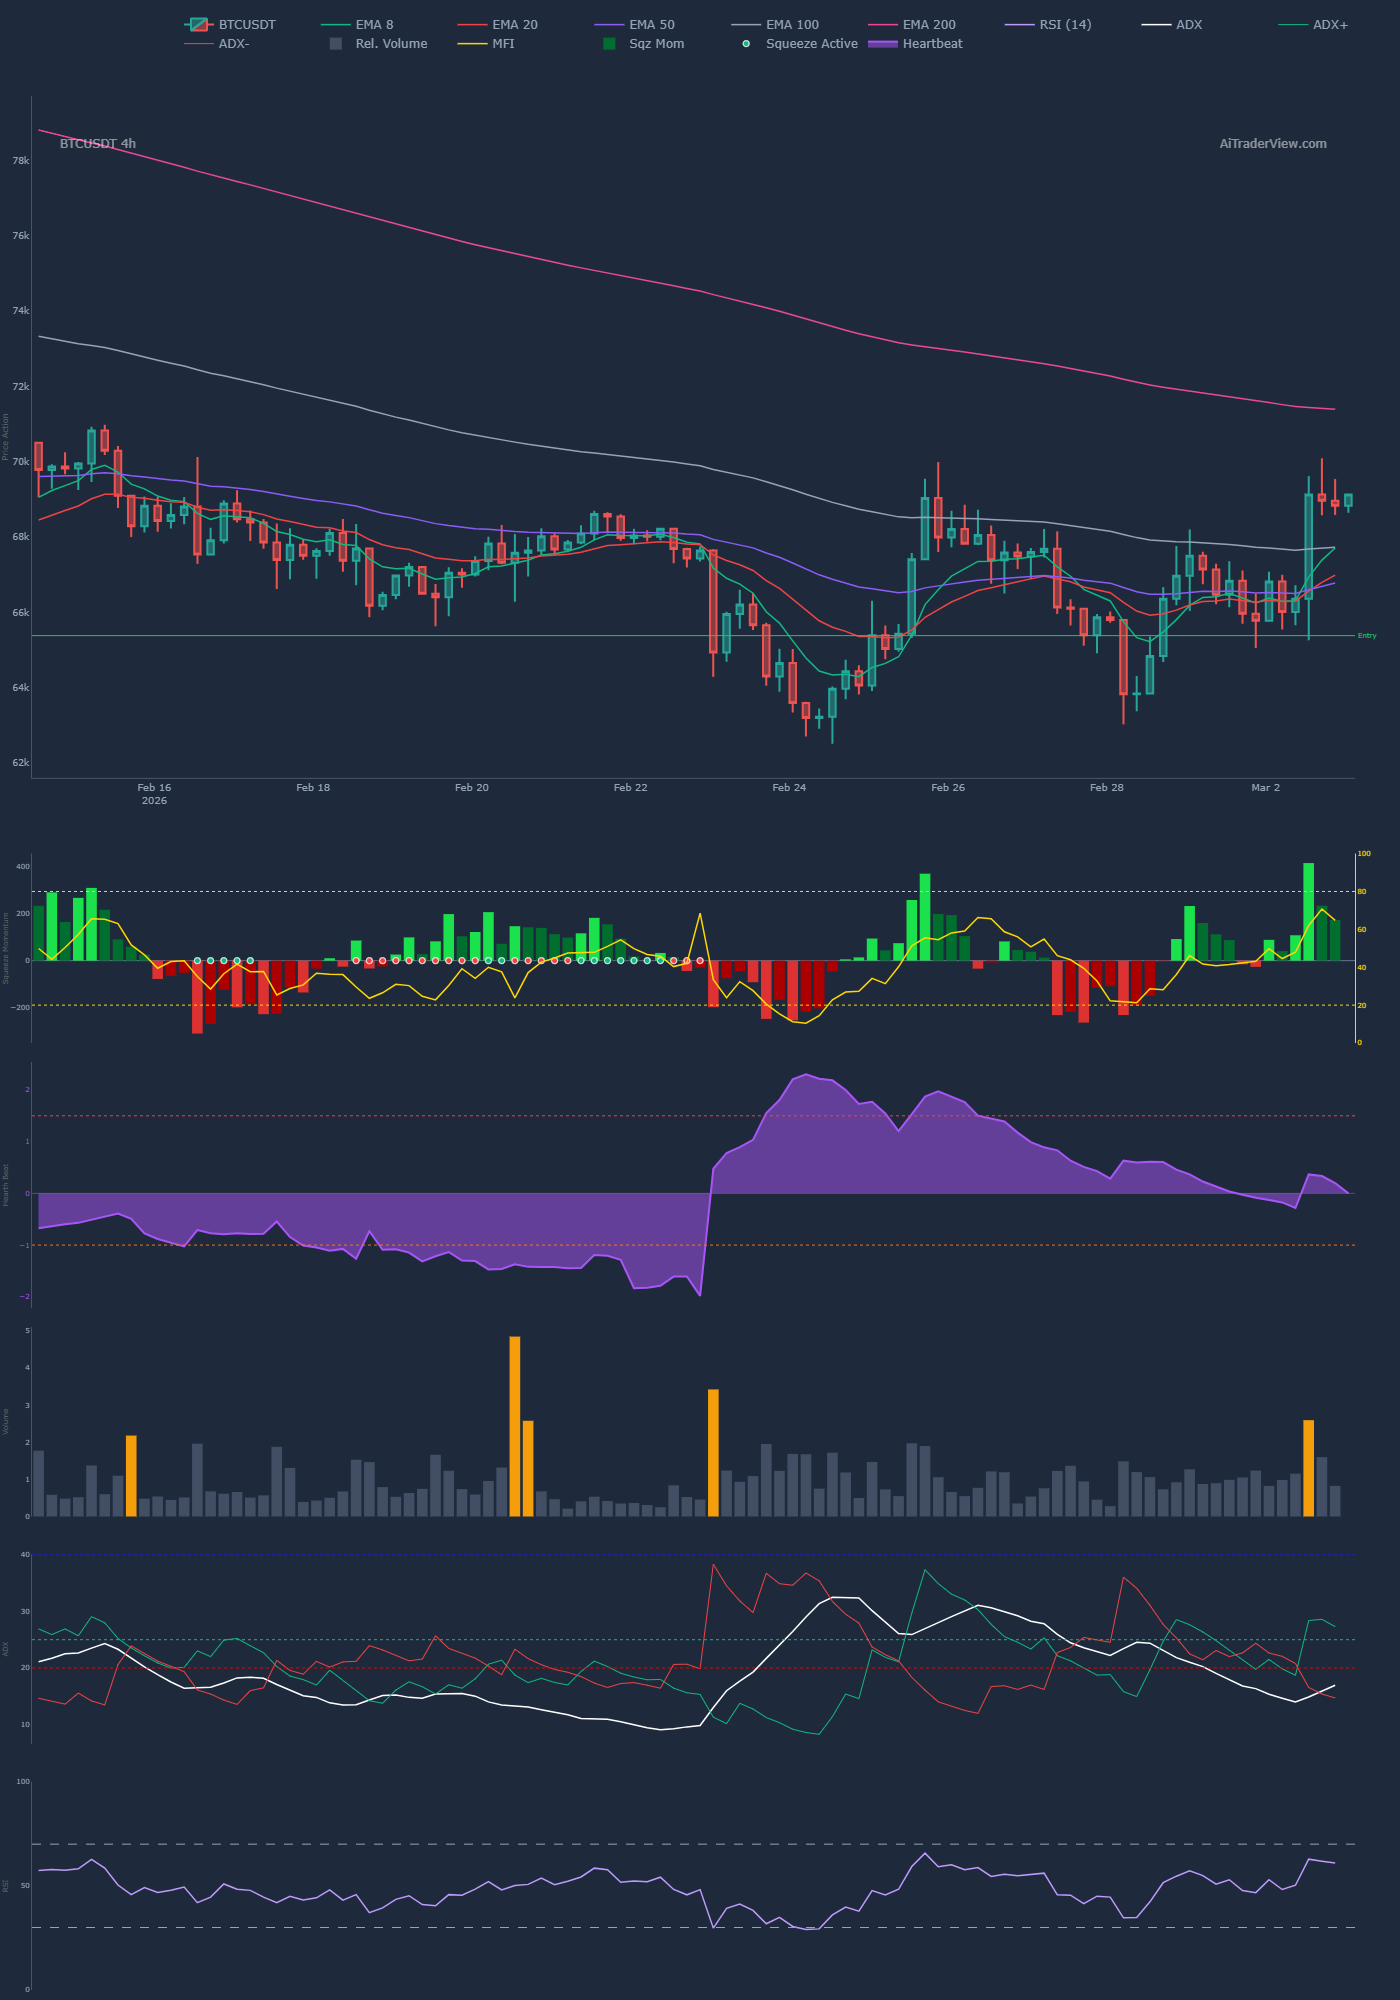
1. Price & volume profile & FVG
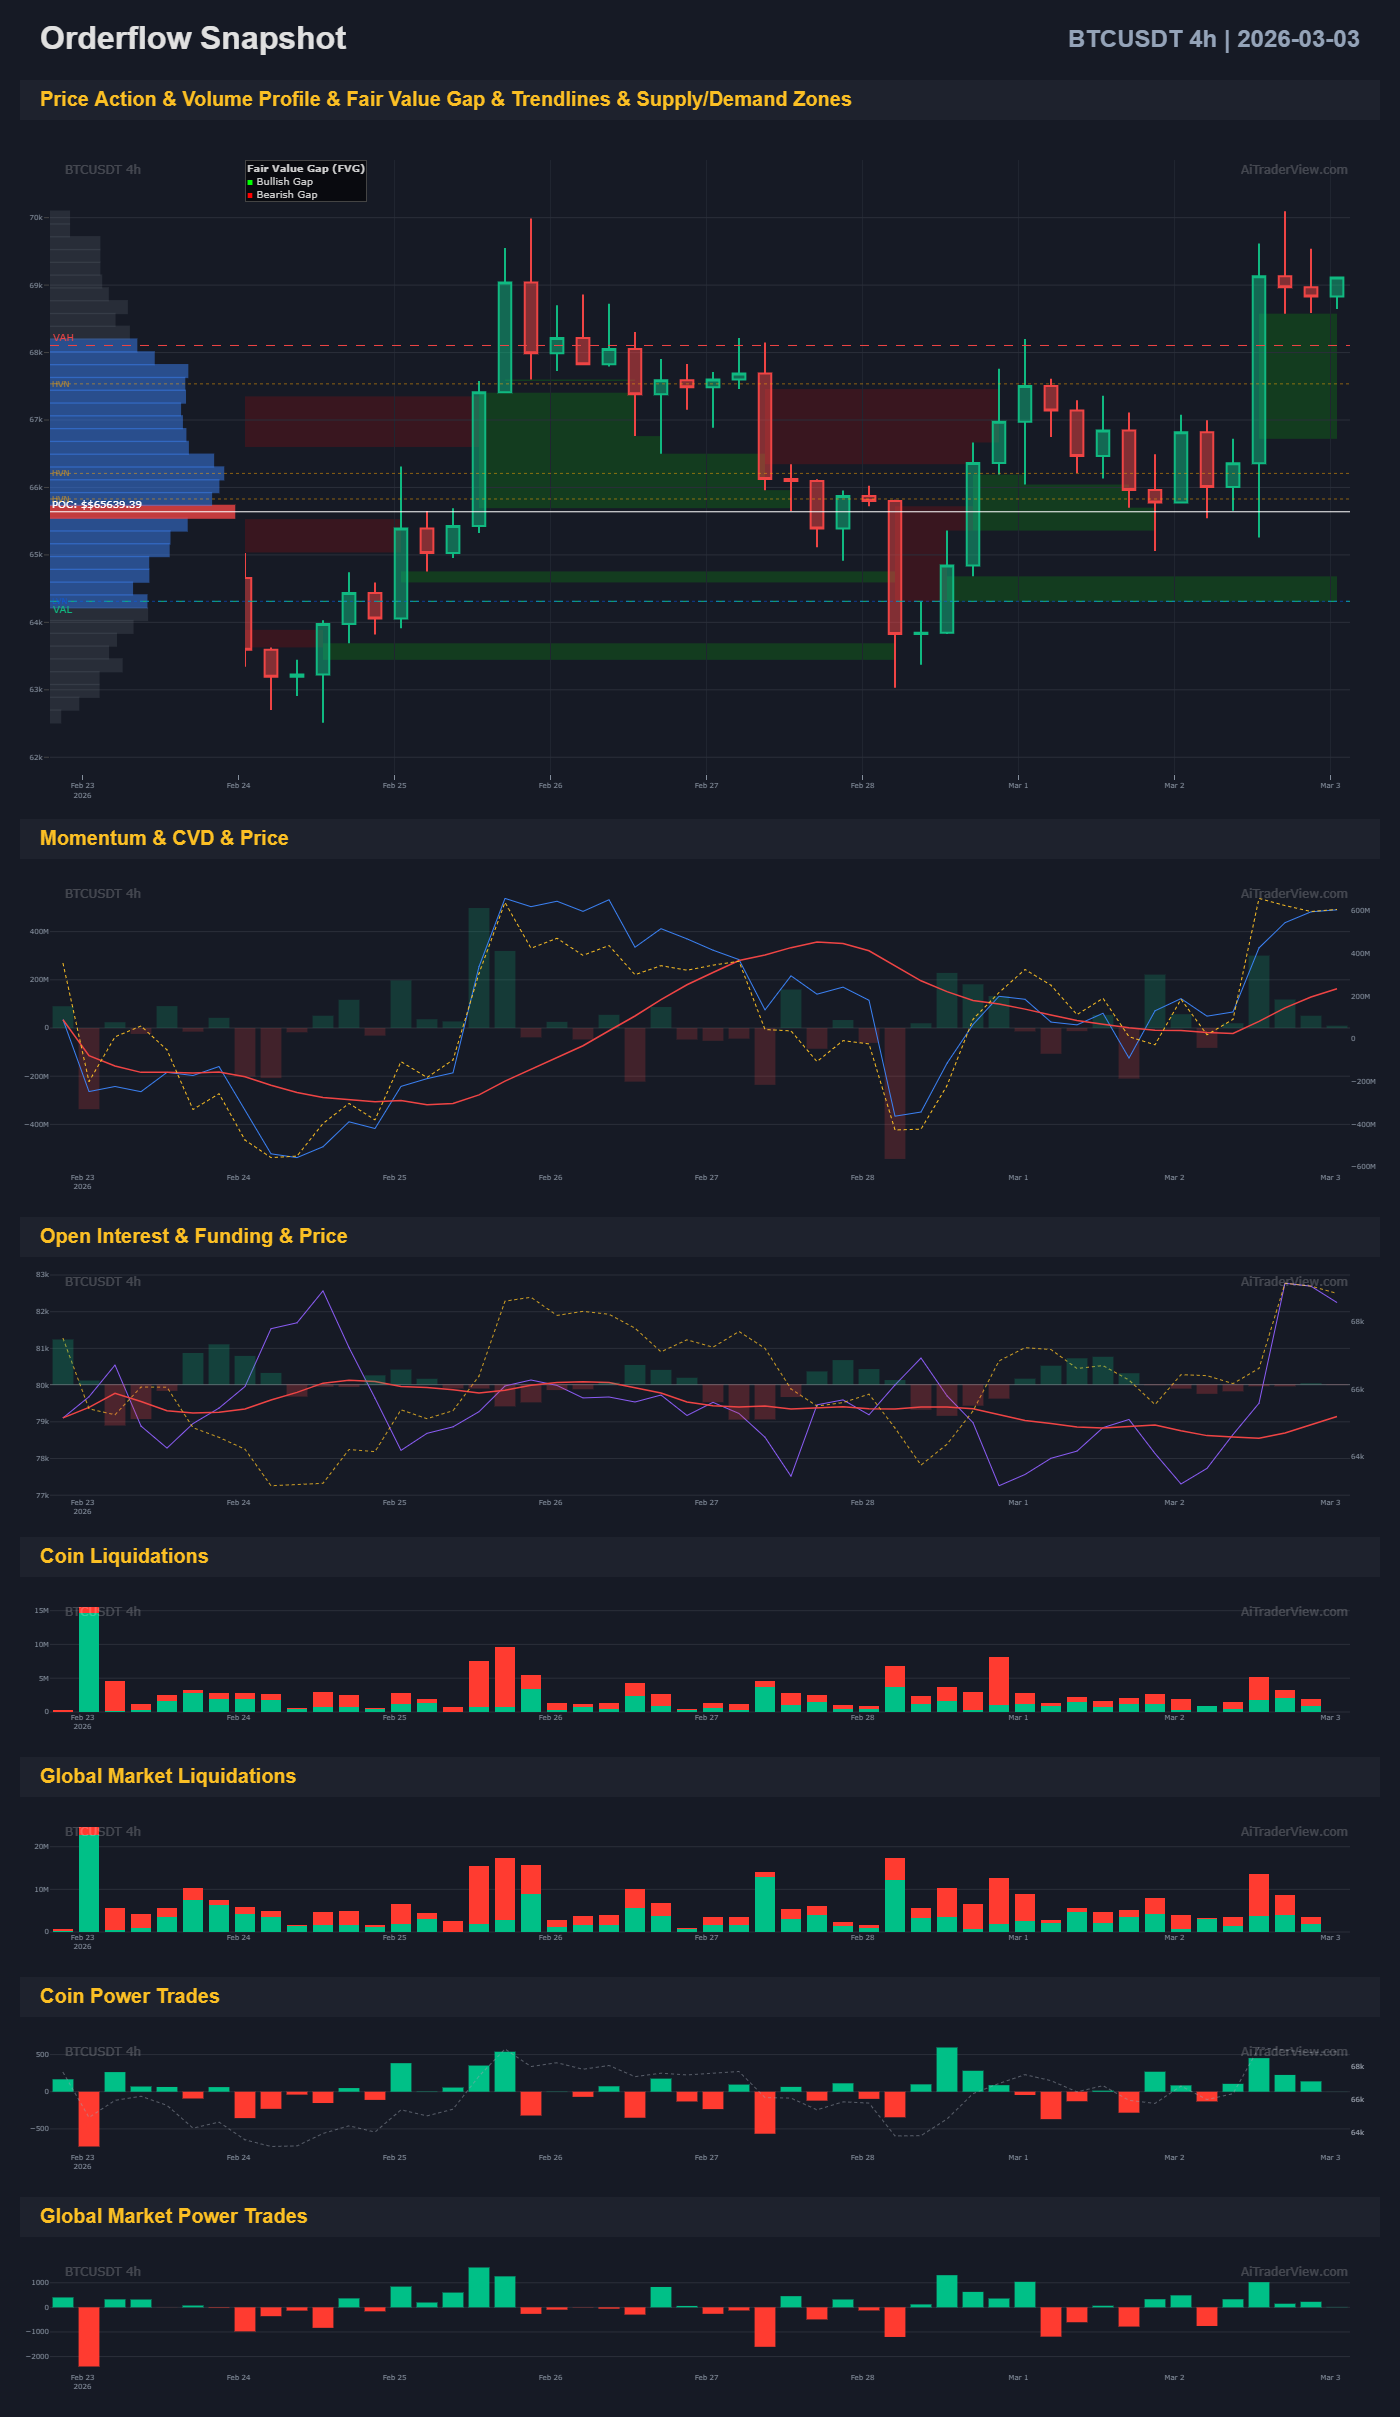
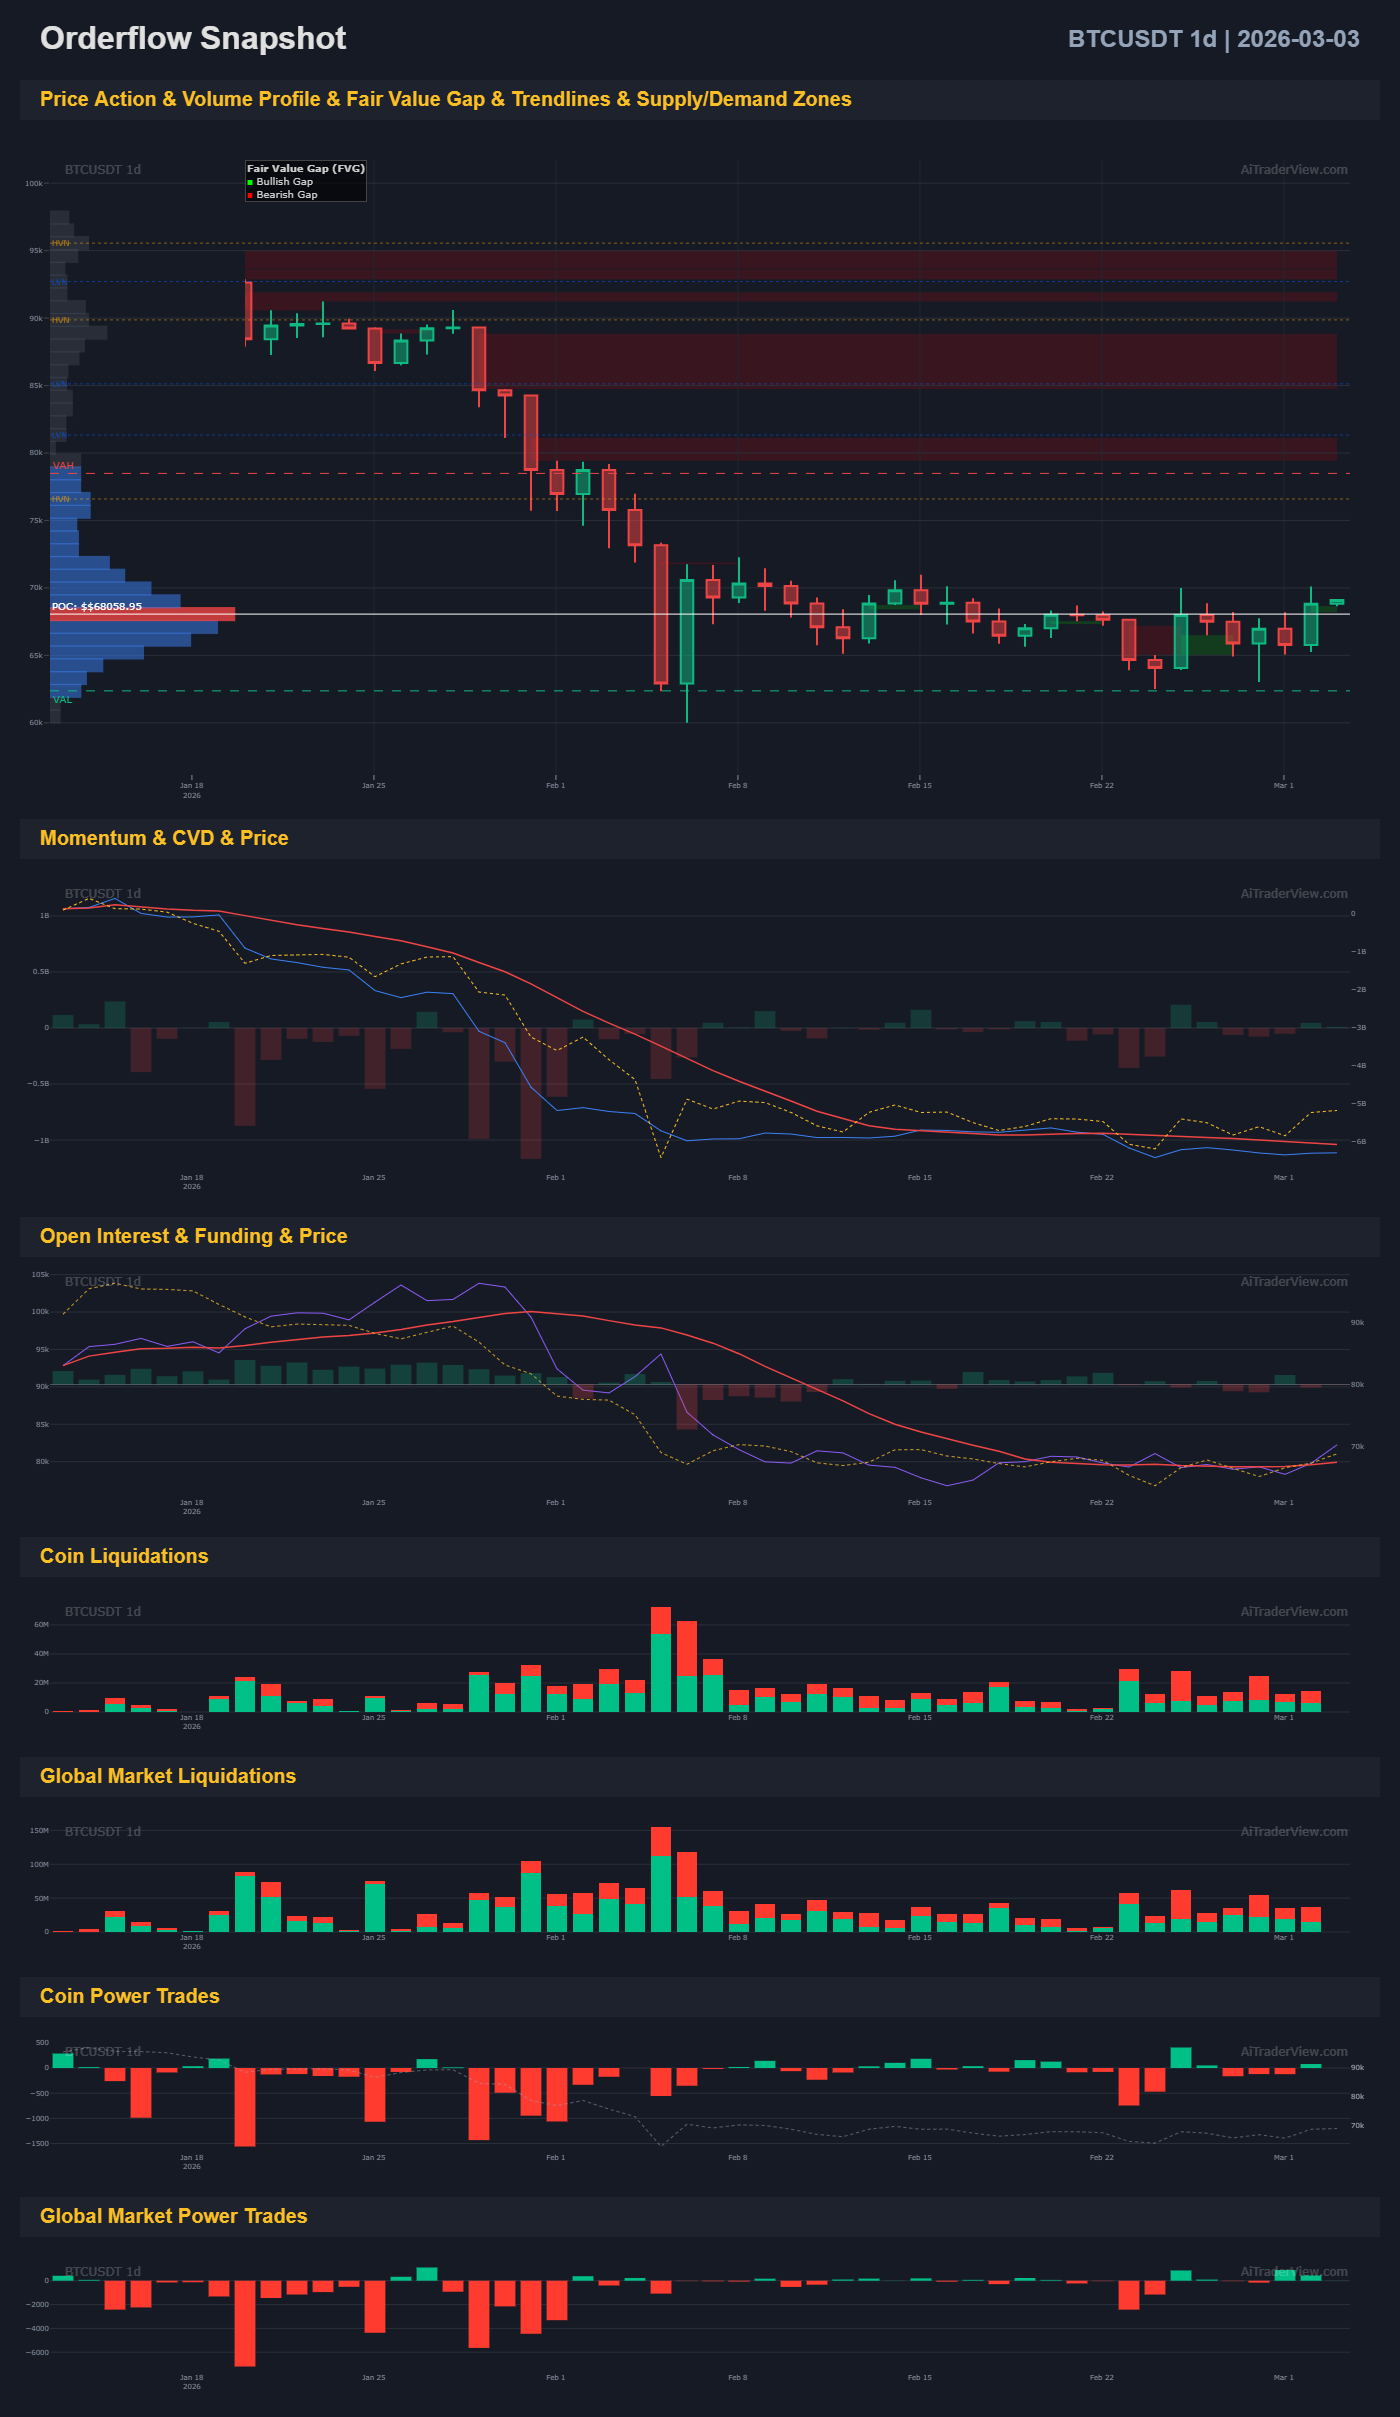
The 4H chart shows that the price has been successfully caught in a wide bullish Fair Value Gap (green). Additionally, the price is currently consolidating just above and around the Point of Control (POC) area of approximately $65.6k – $67.8k, which indicates accumulation at this level.
Score: Bullish (1)
2. Liquidations (Coin & Global)
Looking at the orderflow snapshots, we see significant long liquidations in the past (large green spikes during the dump), but currently, the liquidation intensity has decreased. There is no extreme short-squeeze occurring; the market is currently in equilibrium in this specific area.
Score: Neutral (0)
3. Power trades (Coin & Global)
In both the 4H and 1D snapshots, red bars dominate the Power Trades. This indicates sustained aggressive selling pressure (market sells) being dumped into passive limit orders (bids). This remains a sign of distribution or sustained pressure from sellers.
Score: Bearish (1)
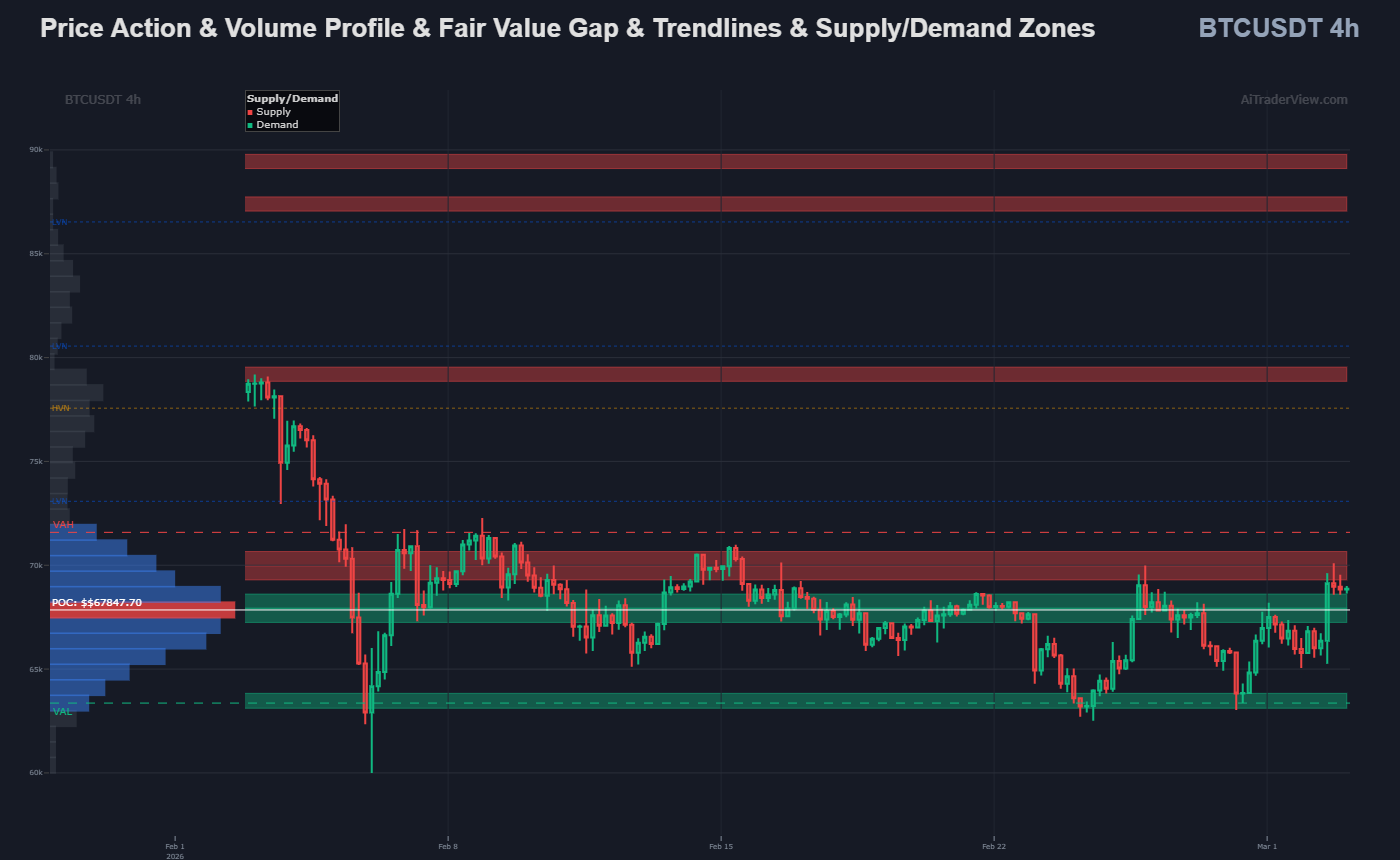
4. Supply & demand zones
The price has shown a very clean and strong rejection (bounce) from the daily demand zone around $63k (green band at the bottom). The structure is now moving away from demand and towards liquidity on the upside.
Score: Bullish (1)
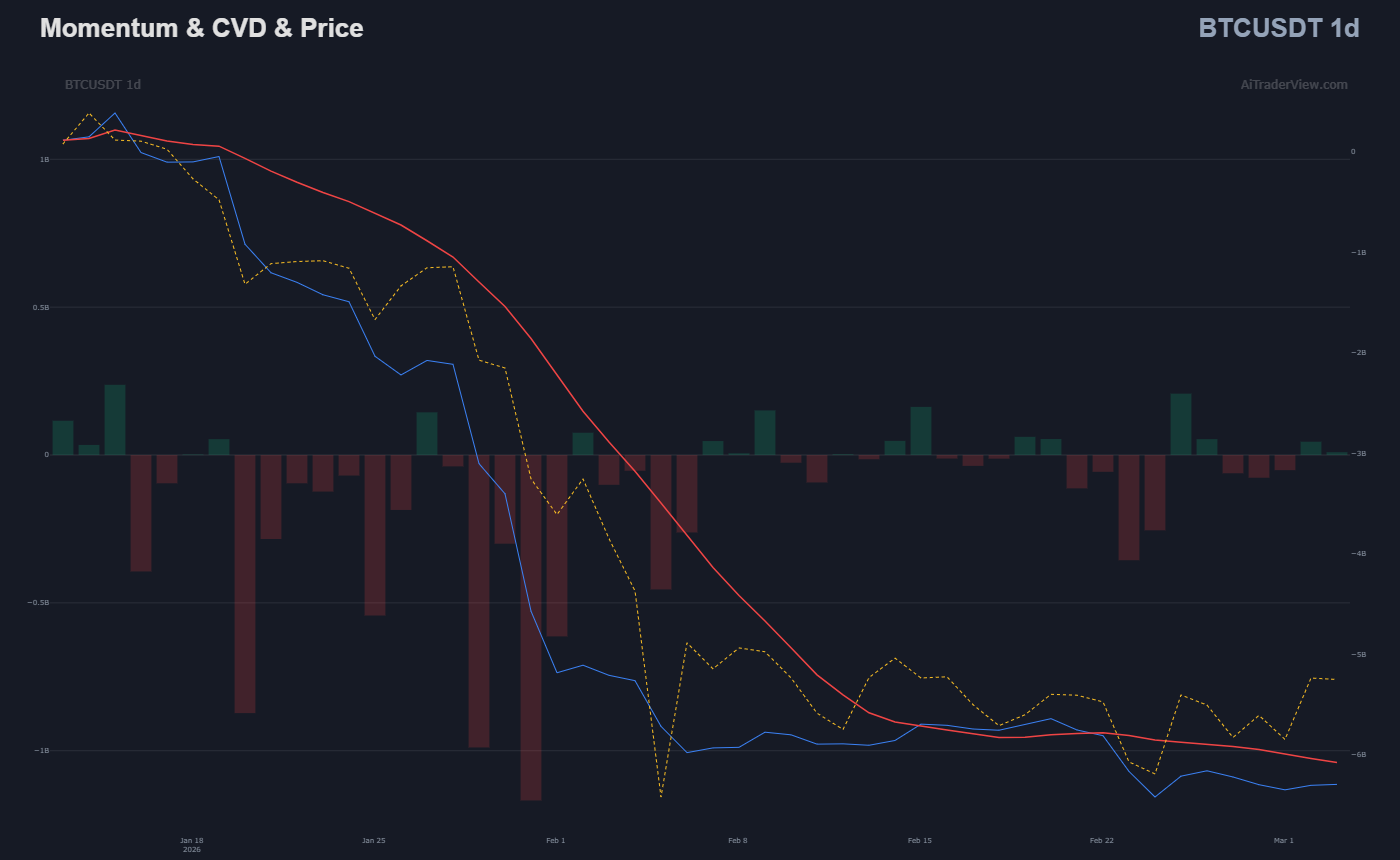
5. CVD & momentum
The Cumulative Volume Delta (CVD) on the 1D chart is dropping sharply. While the price seems to be stabilizing, the CVD is diving aggressively. This is a severe bearish divergence and points to heavy limit absorption or sustained distribution where selling volume remains dominant.
Score: Bearish (1)
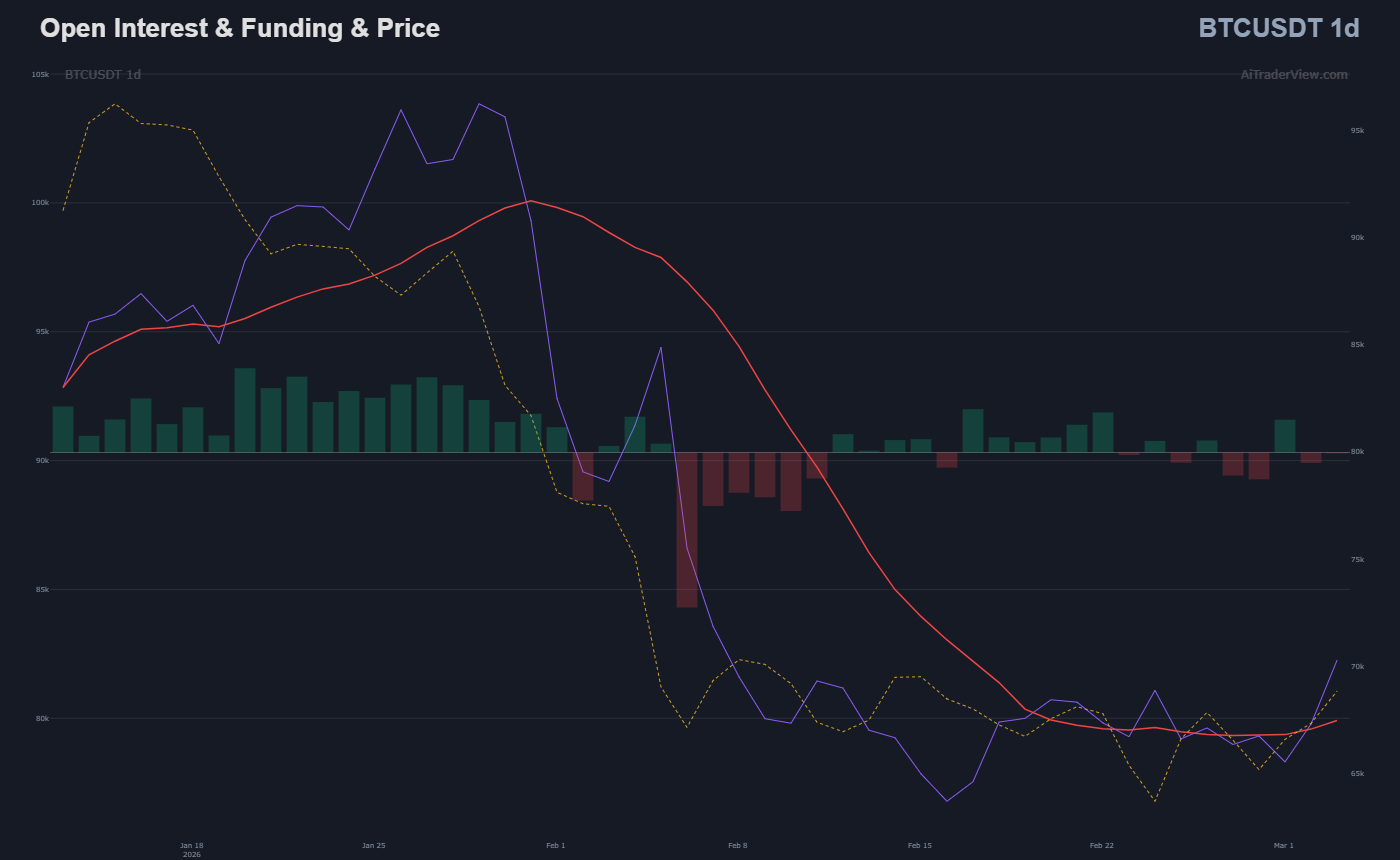
6. Open interest & funding
After a significant flush in Open Interest (washing out over-leveraged positions), we see the OI rising locally again in tandem with the price. Coupled with slightly positive funding, this indicates the building of new, predominantly long positions that support the current upward move.
Score: Bullish (1)
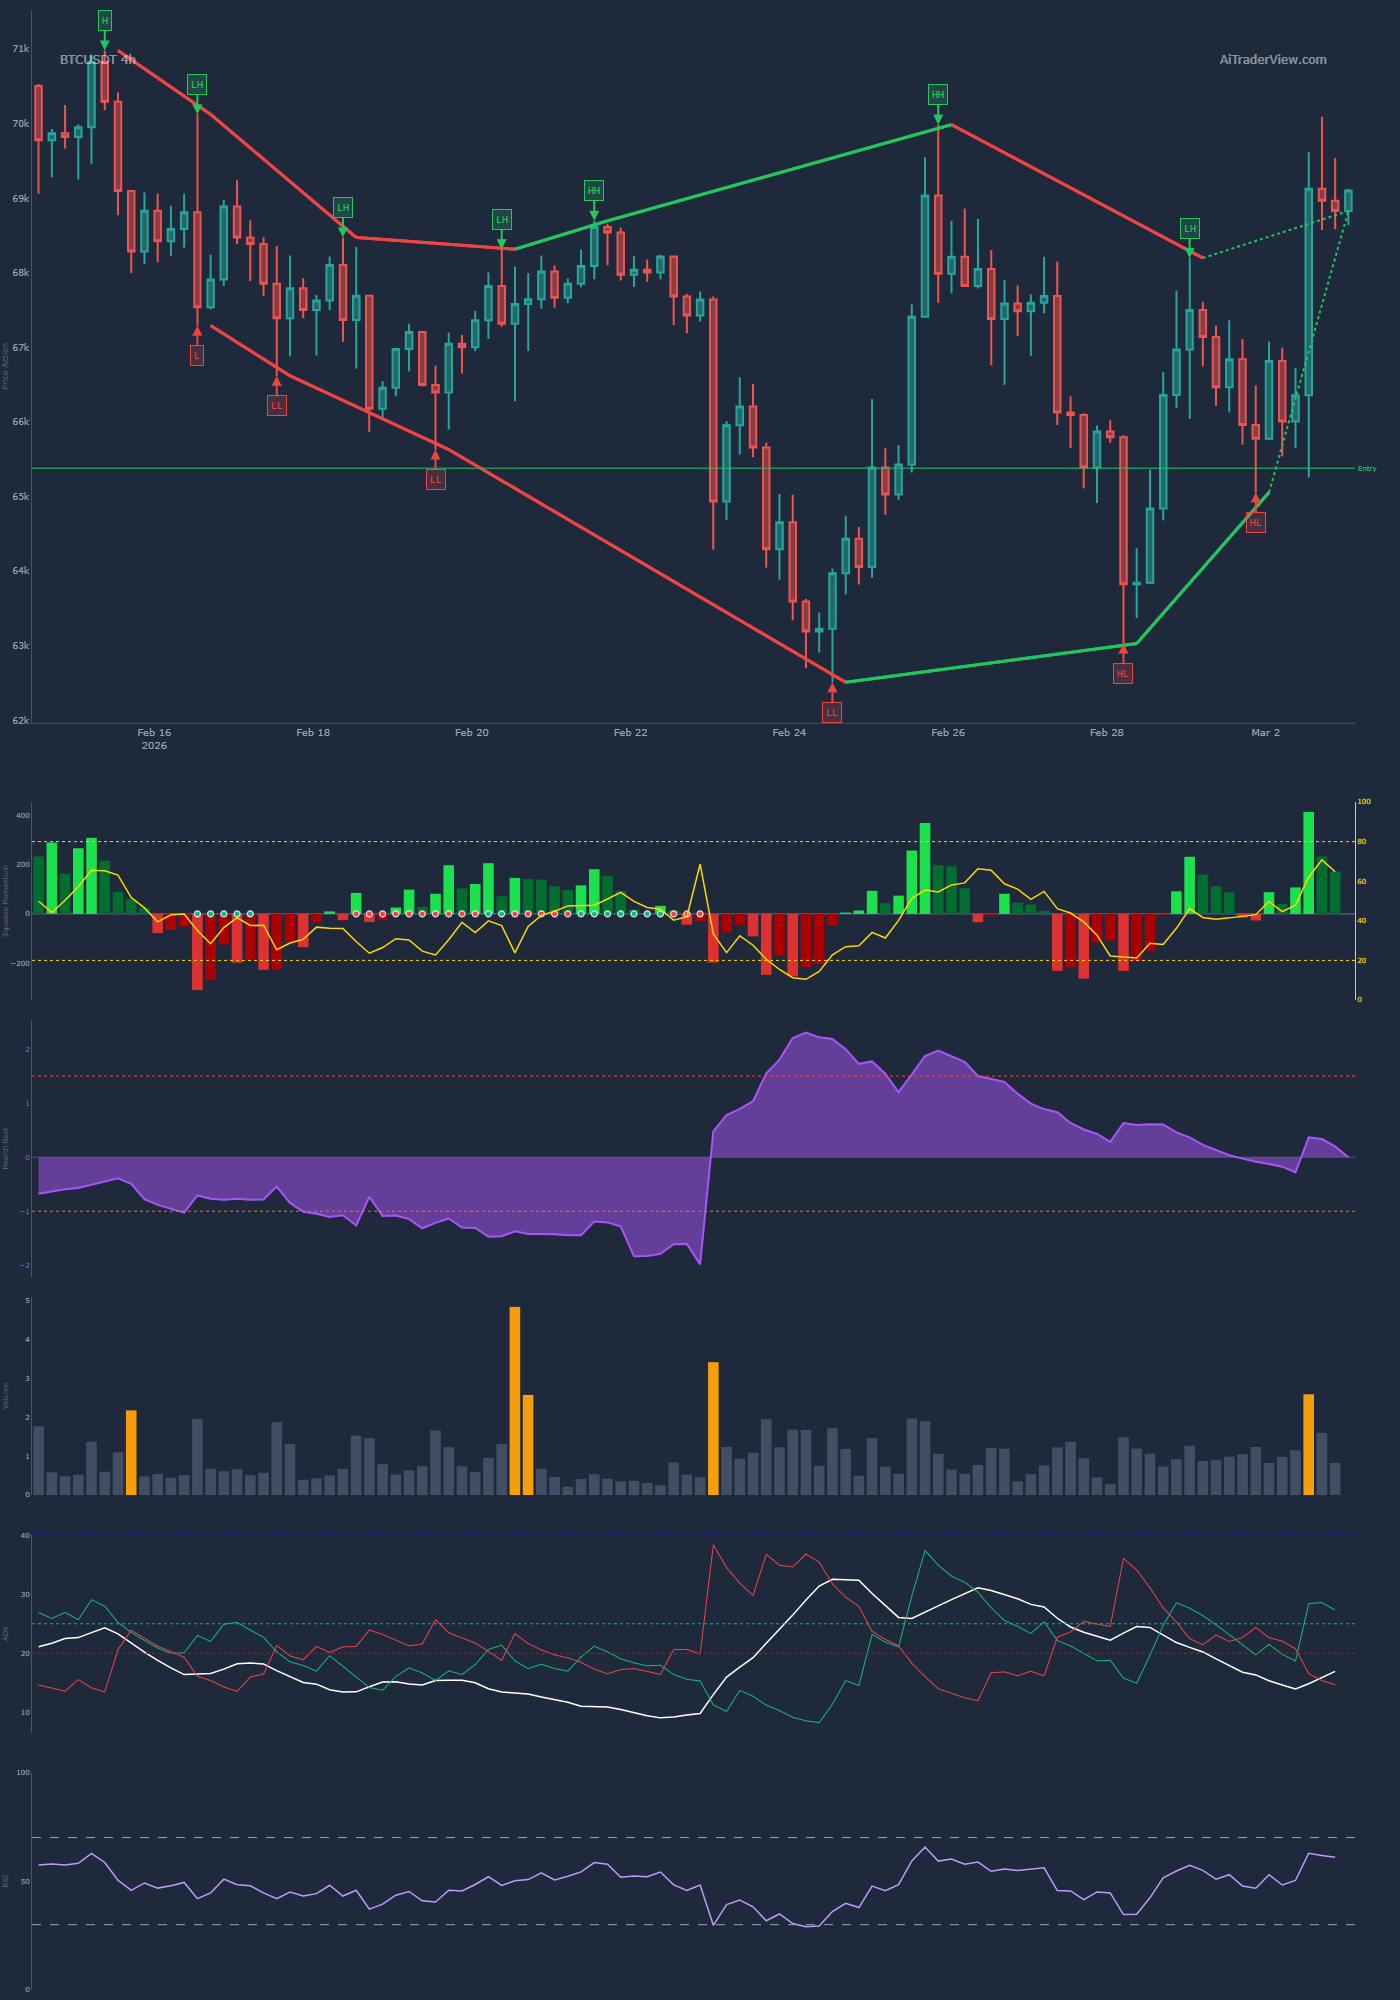
7. Trend
On the 1H trend chart, the local downtrend has been broken. A clean upward structure has formed with consecutive Higher Highs (HH) and Higher Lows (HL). The short-term trend has therefore reversed.
Score: Bullish (1)
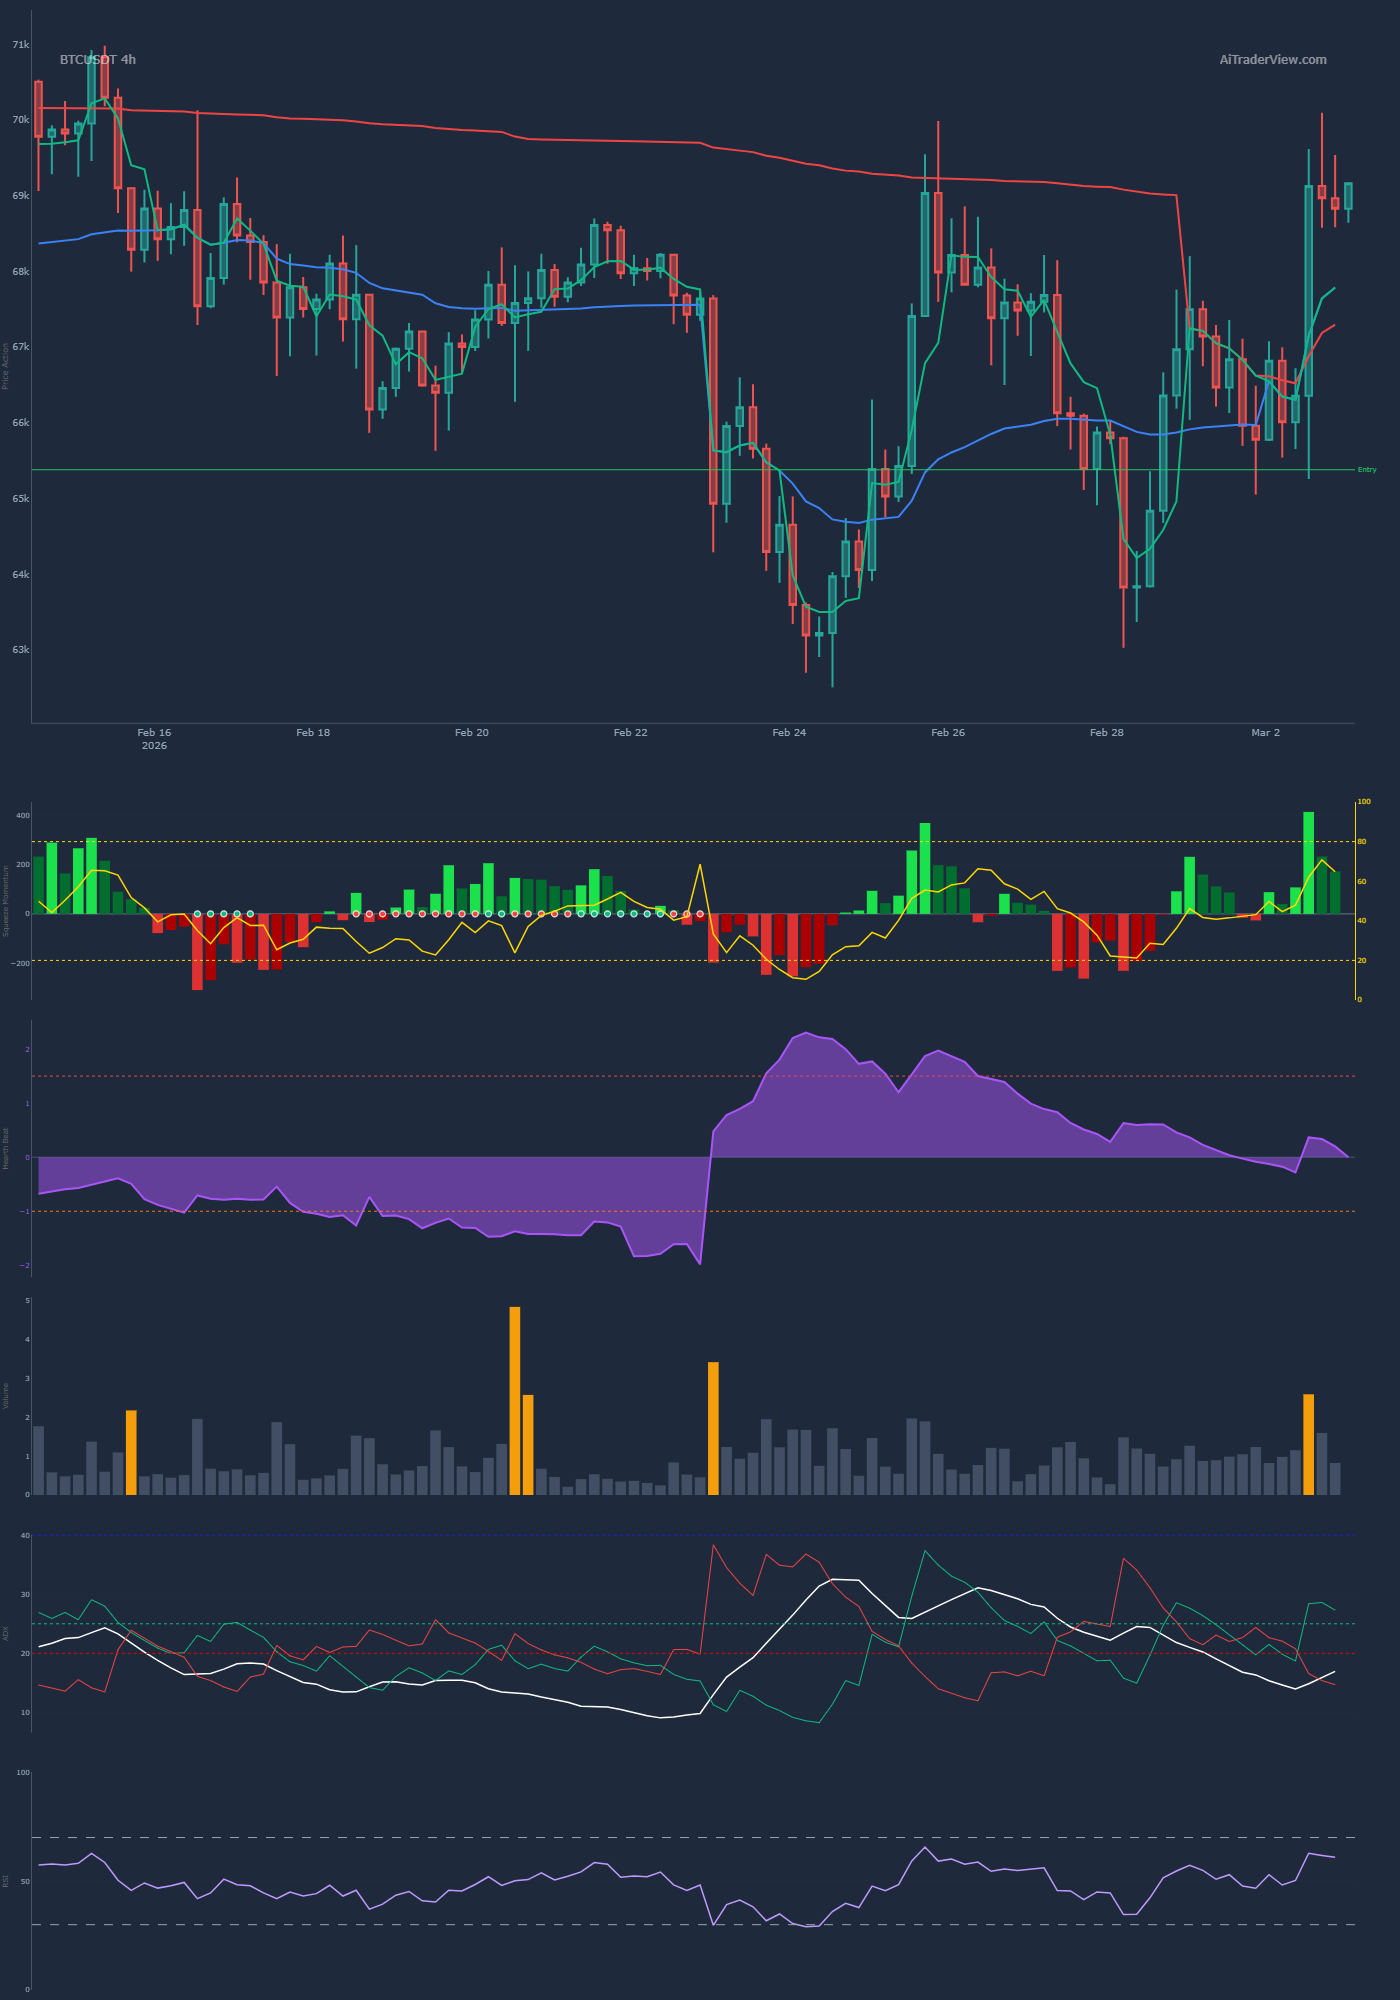
8. EMA
On the 1H chart, the price has convincingly broken above the fast moving averages (EMA 8, 20, and 50). Although the macro EMA (200) may still offer resistance, the short EMAs are currently functioning successfully as dynamic support.
Score: Bullish (1)
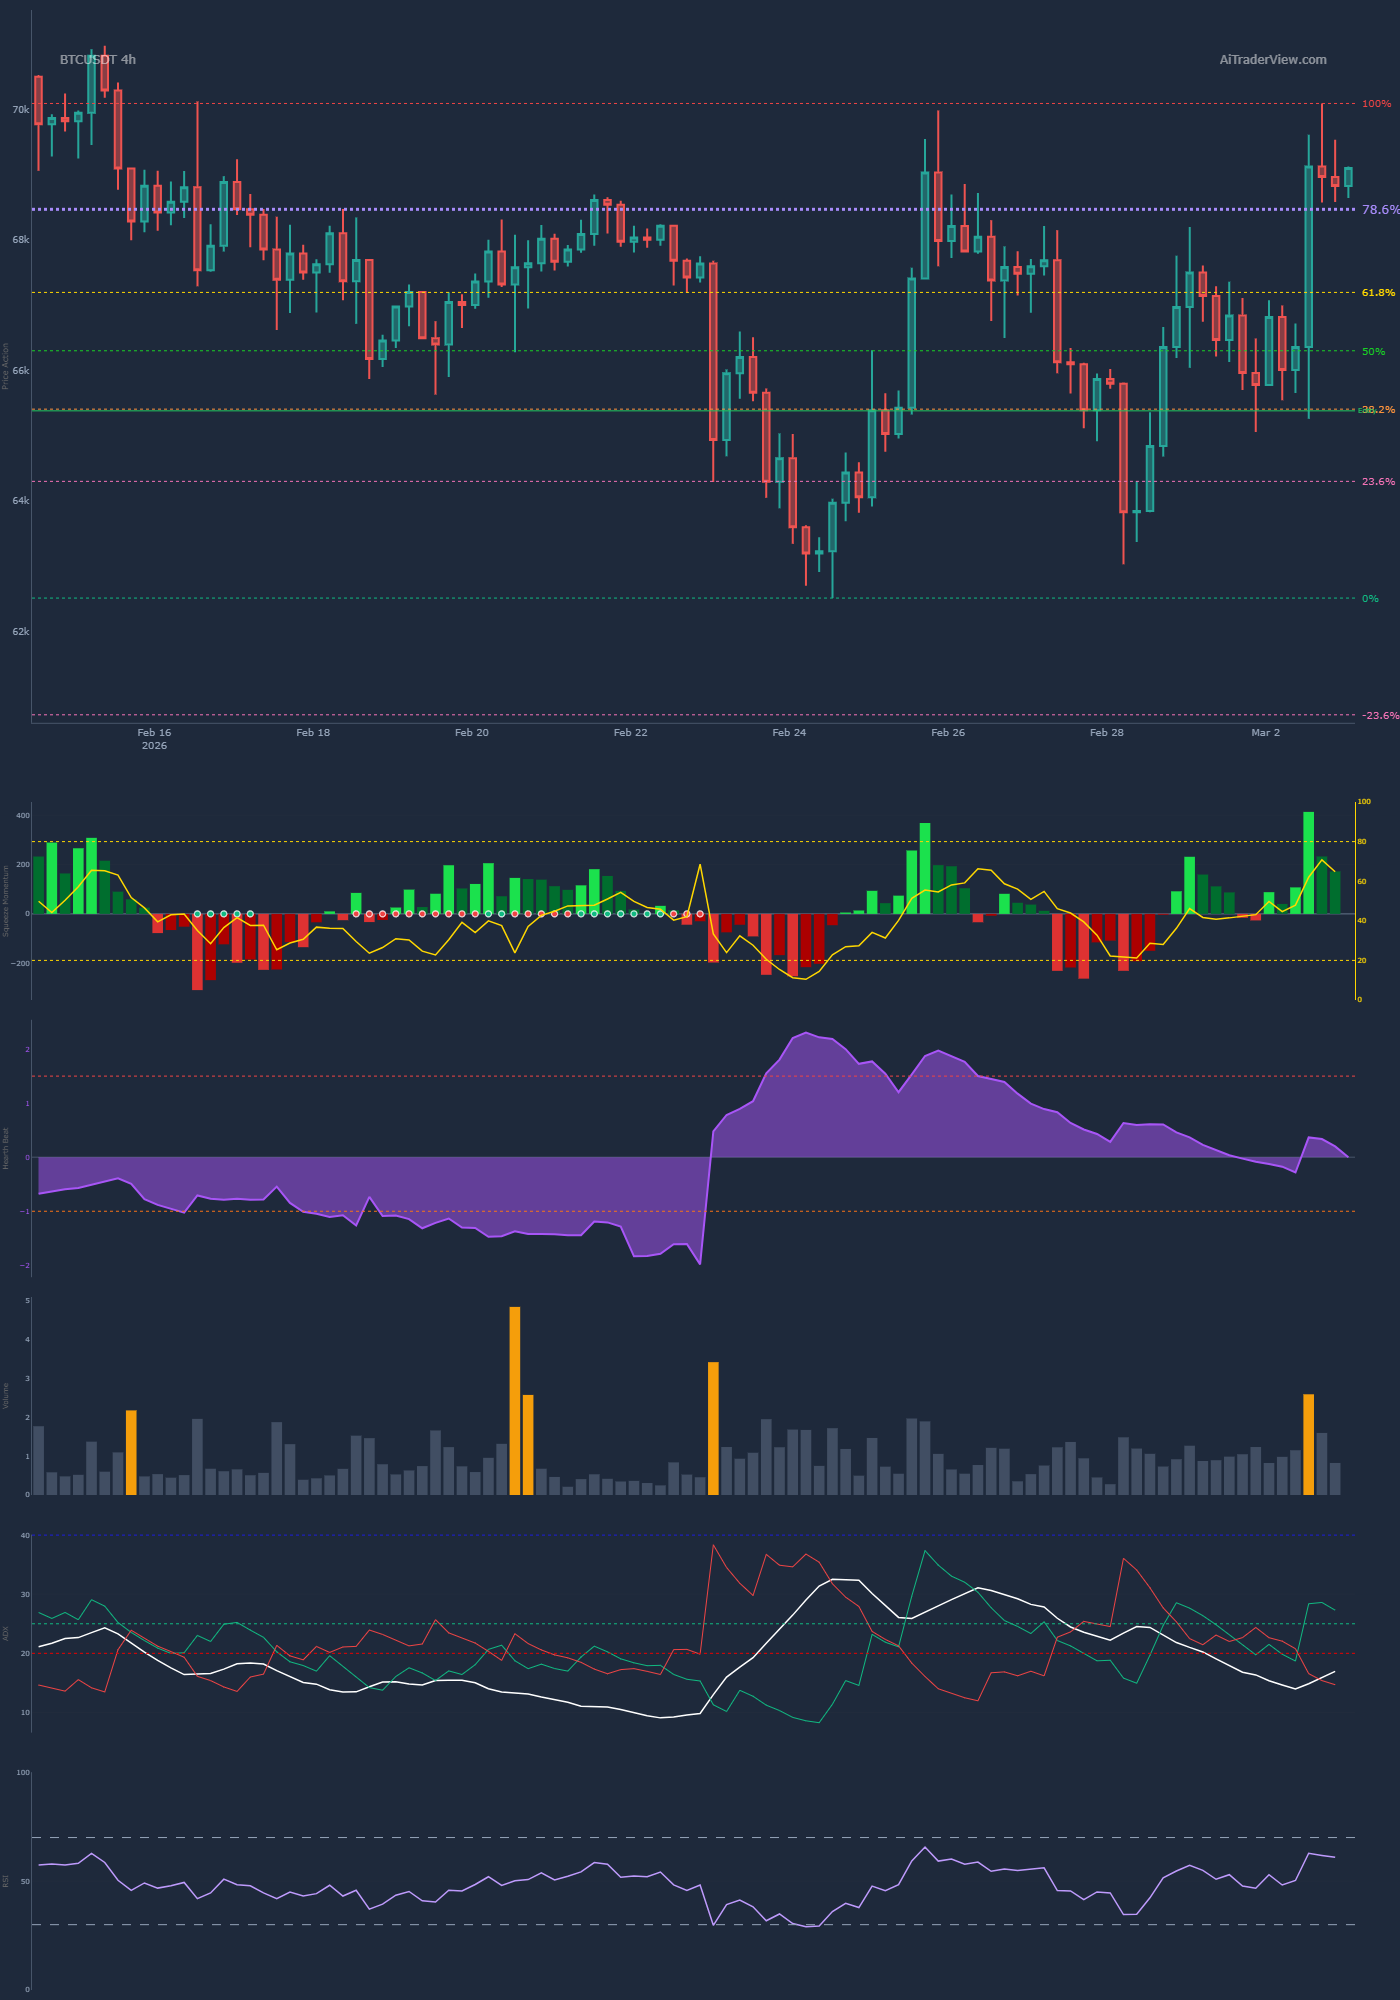
9. Fibonacci
The 1H fibonacci chart shows that the recent impulse move was rejected around the heavy 78.6% retracement zone, and is currently struggling to break convincingly through the golden pocket (0.618). This shows there is solid resistance to the upside.
Score: Bearish (1)
10. nPOC (Naked POC)
The price is currently hovering deep within the active POC clusters of the current trading range. In the directly visible structure, there is no untested ‘naked’ POC acting purely as a magnet from a distance; the market is currently seeking value around the current equilibrium.
Score: Neutral (0)
11. SMC (Smart Money Concepts)
A clear Market Structure Shift (MSS) has occurred on the lower timeframes. Orderblocks and demand zones are being respected, and price inefficiencies (FVGs) are efficiently filled and used as a launchpad for higher prices.
Score: Bullish (1)
12. VWAP
The price has recently broken above the central VWAP (Volume Weighted Average Price) band with conviction on the lower timeframes and is now successfully testing it as support.
Score: Bullish (1)
Data-Driven Conclusion & Scoring System
Below is the score per metric summarized based on your rules. (1 point for a direction, 0 for neutral/mixed).
| Indicator | Bullish (1) | Bearish (1) | Neutral (0) |
| 1. Price & volume profile & FVG | 1 | 0 | 0 |
| 2. Liquidations (Coin & Global) | 0 | 0 | 1 |
| 3. Power trades (Coin & Global) | 0 | 1 | 0 |
| 4. Supply & demand zones | 1 | 0 | 0 |
| 5. CVD & momentum | 0 | 1 | 0 |
| 6. Open interest & funding | 1 | 0 | 0 |
| 7. Trend | 1 | 0 | 0 |
| 8. EMA | 1 | 0 | 0 |
| 9. Fibonacci | 0 | 1 | 0 |
| 10. npoc | 0 | 0 | 1 |
| 11. smc | 1 | 0 | 0 |
| 12. vwap | 1 | 0 | 0 |
| Total (Directional points) | 7 | 3 | (2 eliminated) |
Calculation
The total number of directional points is 10.
- Bullish% = 70%
- Bearish% = 30%
Final Conclusion:
Based on the provided orderflow and technical structure, this asset is locally in an upward momentum (70% Bullish). The price has made a strong Market Structure Shift from a macro demand zone ($63k), is consolidating in bullish FVGs, and is supported by a recovering Open Interest. The biggest risks to this bullish scenario lie in the underlying orderflow weakness: the sharply dropping CVD and sustained selling pressure in the Power Trades warn that bears (limit sellers) are heavily trying to absorb the push higher.
⚠️ RISK WARNING & AI DISCLOSURE
- This information is generated by Artificial Intelligence (AI) and complex algorithms. While advanced, these systems can contain errors or inaccuracies and are for educational purposes only.
- Technical analysis provides no guarantees; this information is purely informative.
- All discussed scenarios are hypothetical and do not constitute predictions or expectations.
- Past performance is not an indicator of future results.
- This is not financial advice and is not intended as a call-to-action for the reader.
- No implicit direction is claimed, and no specific behavior of market participants is suggested.