
Based on the provided 4-hour and daily (1D) orderflow snapshots, DOT is currently experiencing a localized relief bounce within a broader macro downtrend. The overarching market structure remains predominantly bearish, with significant overhead supply and historical selling pressure. However, short-term orderflow indicates that a short-squeeze dynamic is currently providing local upside momentum.
Technical & Orderflow Breakdown
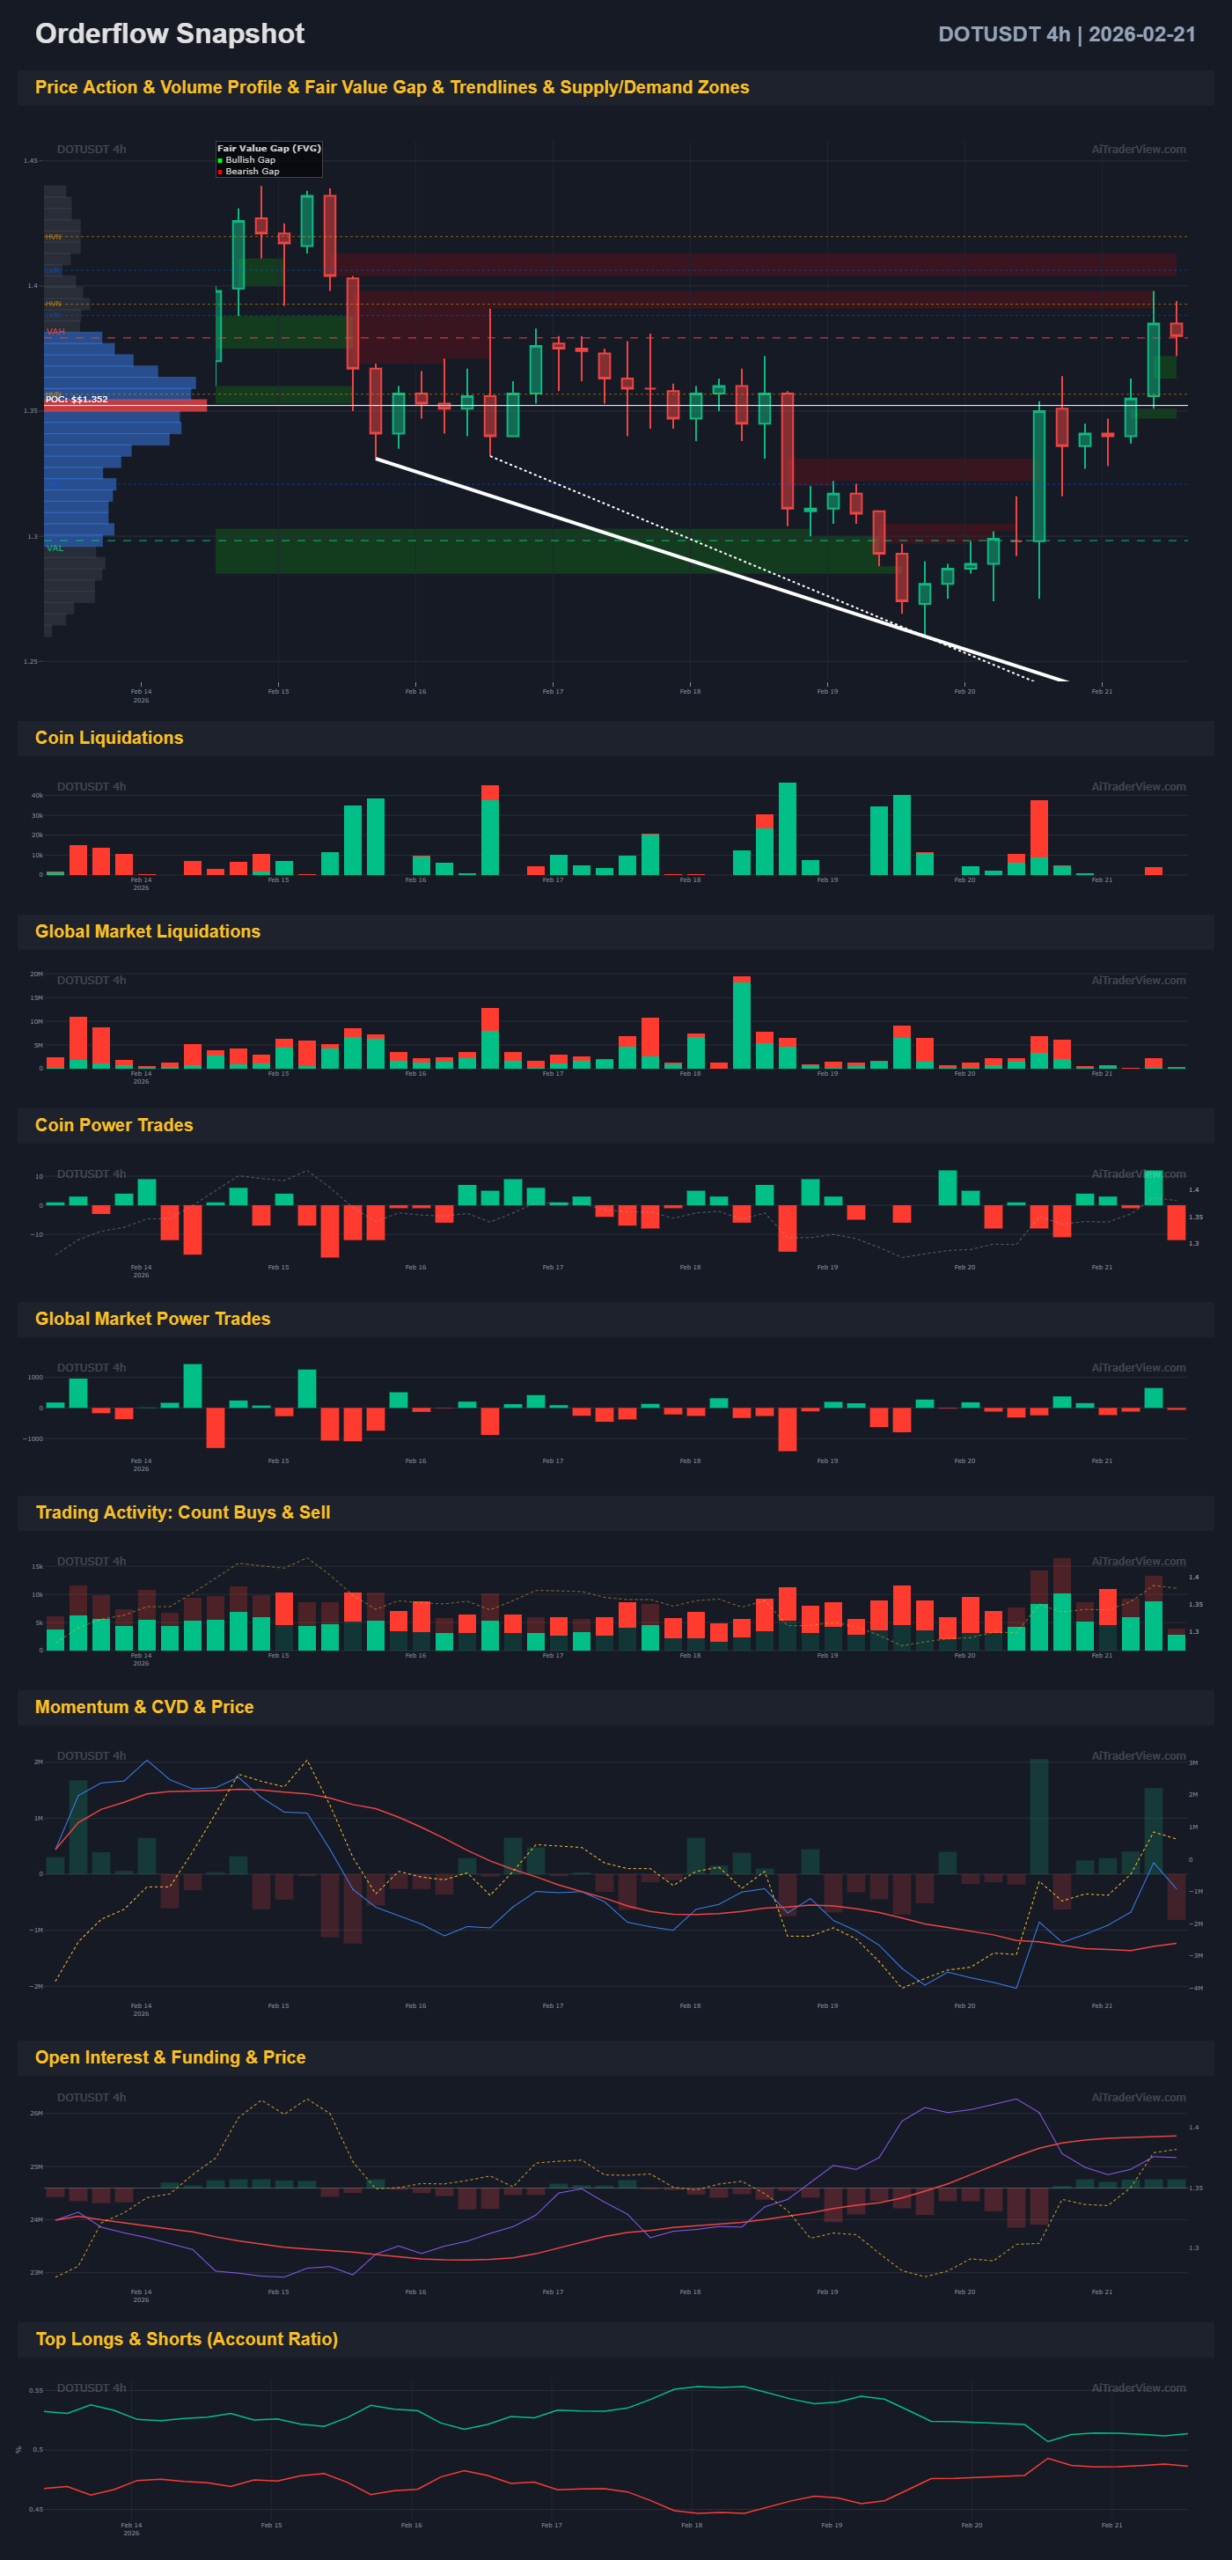
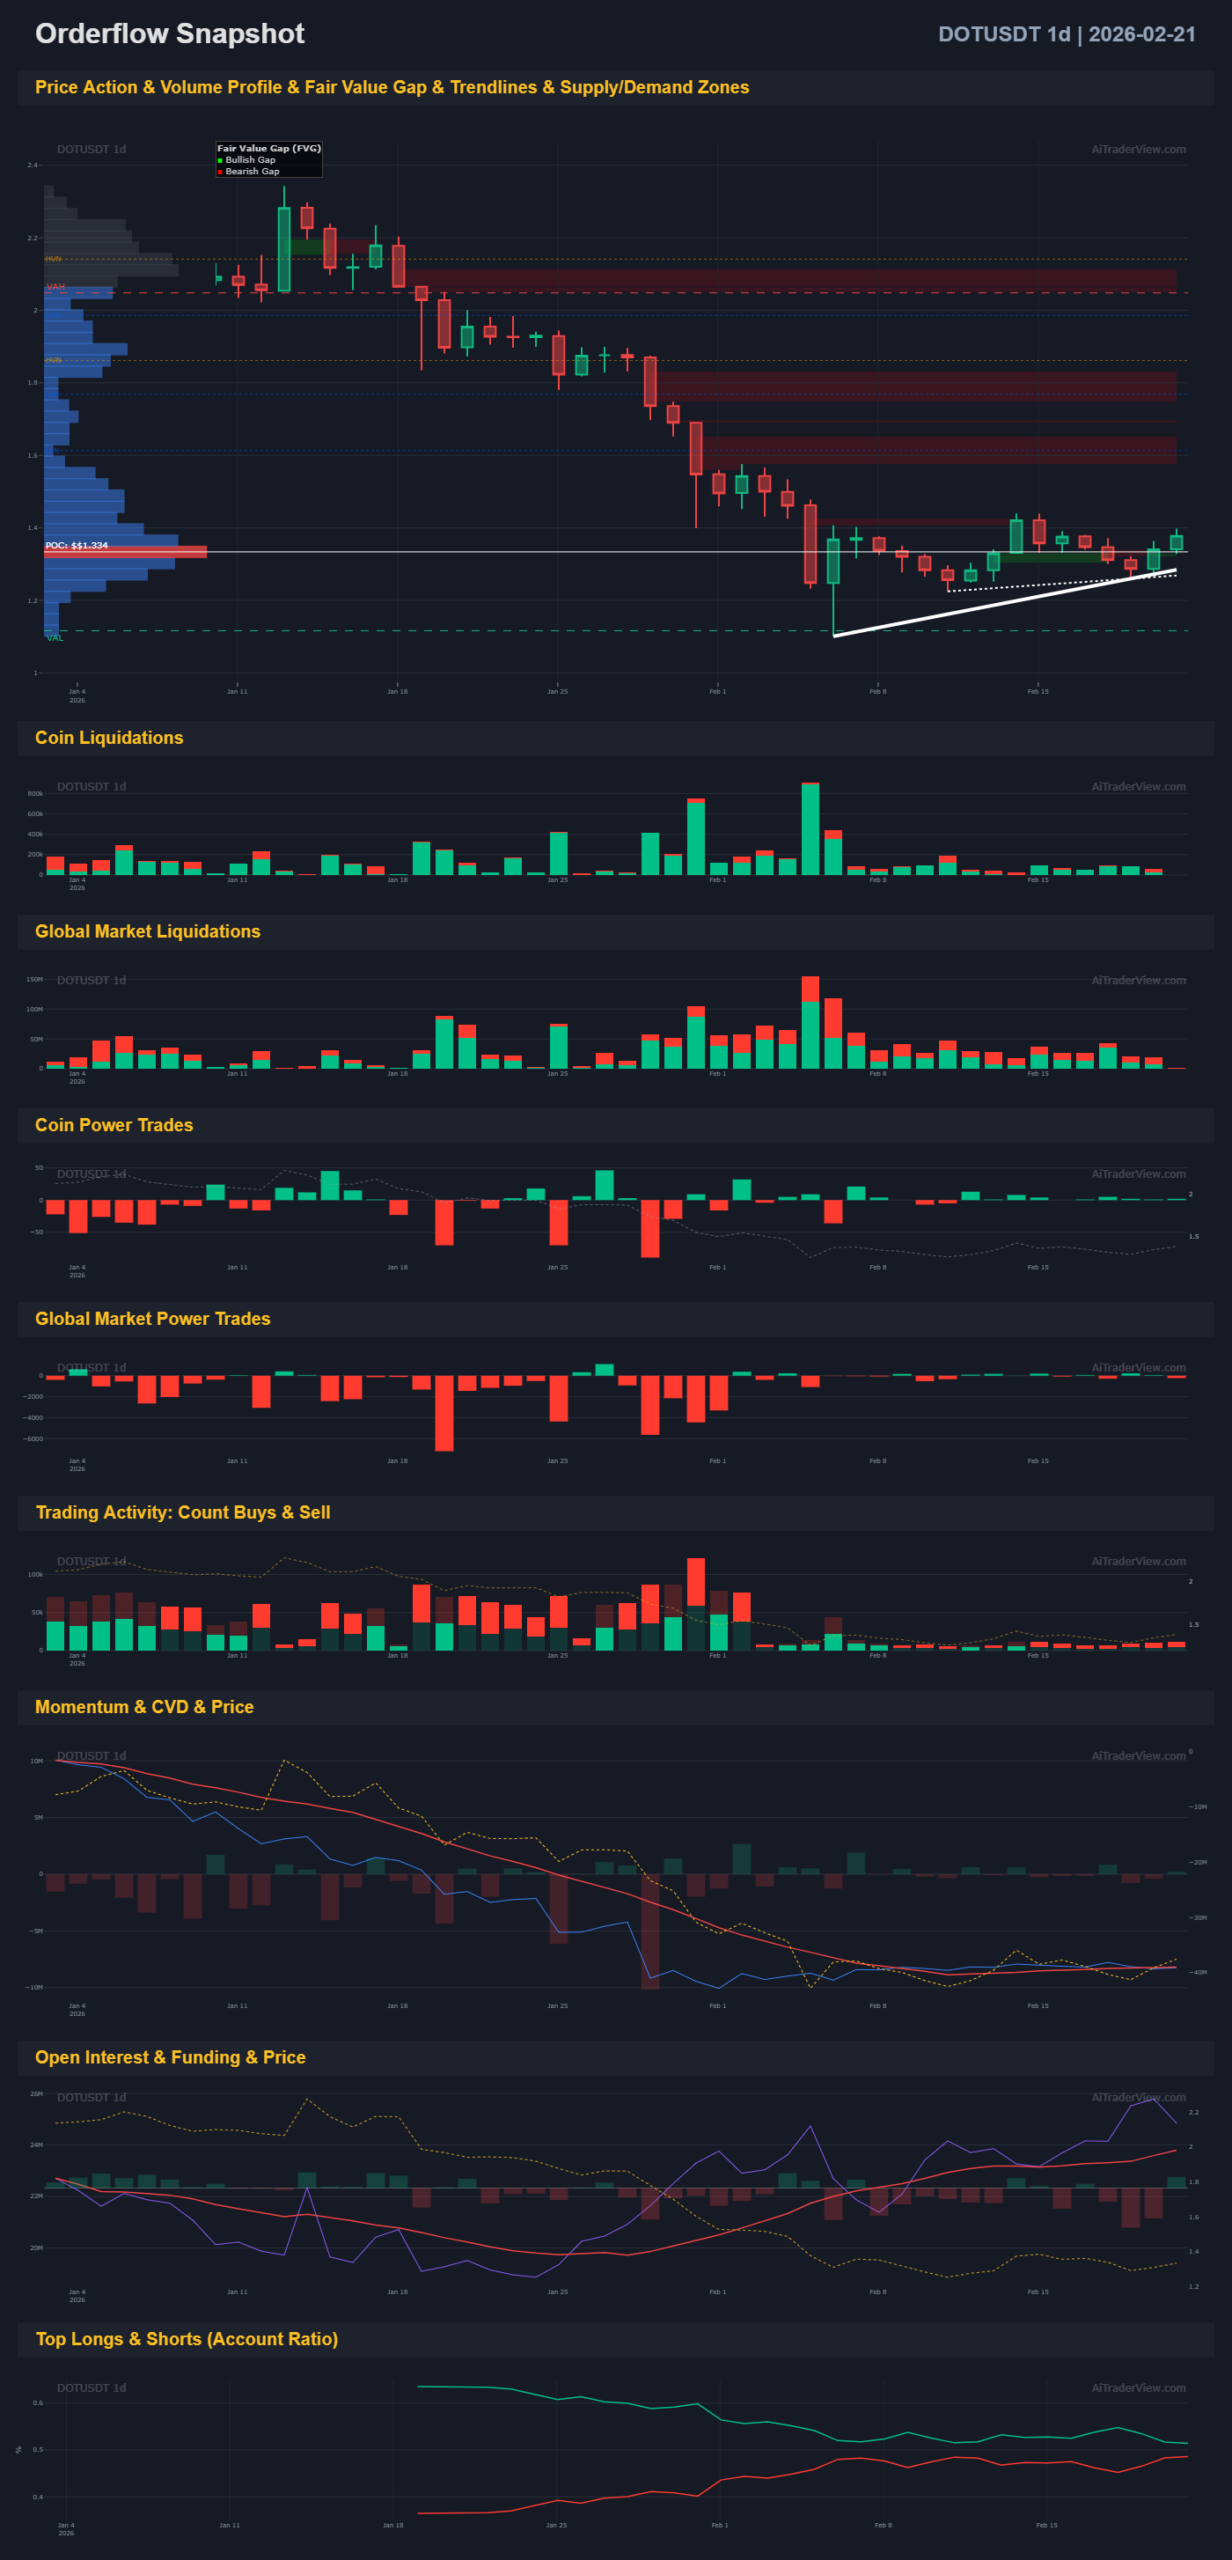
1. Price Action, Volume Profile & Supply/Demand Zones
- 1D Timeframe: The macro structure is a clear downtrend. Price is trading well below the Point of Control (POC), which sits firmly above current price action and will act as heavy resistance. Multiple red supply zones are stacked overhead.
- 4H Timeframe: Price recently swept into a lower demand zone (green box) and caught a bid, establishing a local ascending trendline (white line) formed by higher lows. It is currently testing an intermediate supply zone and a small bullish Fair Value Gap (FVG).
2. Liquidations (Coin & Global)
- Both the 1D and 4H charts show significant clusters of green liquidation bars recently. This indicates that the current upward price movement is largely fueled by short liquidations (forced buybacks) rather than pure organic spot buying.
3. Power Trades & Trading Activity
- Power Trades: The 1D chart shows a historical dominance of red power trades, confirming sustained macro selling pressure. The 4H chart shows mixed power trades, with some recent green prints supporting the local bounce, but no aggressive long-term buying conviction.
- Trading Activity: Buy/Sell count shows an uptick in buying activity on the most recent 4H candles, correlating with the localized bounce off the demand zone.
4. CVD, Momentum & Open Interest
- CVD & Momentum: The Daily CVD (Cumulative Volume Delta) is in a persistent, grinding downtrend, showing long-term aggressive selling. The 4H momentum histogram is crossing into the green, and 4H CVD is attempting a weak curl upward, indicating a temporary shift in short-term momentum.
- Open Interest (OI) & Funding: OI on the 1D is generally declining or flatlining, suggesting a lack of macro participation. However, on the 4H, OI is rising alongside the recent price bounce. Rising price + rising OI typically suggests new long positions are being opened (or shorts are aggressively defending underwater positions before being liquidated).
5. Long/Short Account Ratio
- The Top Longs & Shorts ratio shows a heavy dominance of long accounts (green line significantly above the red line). In a macro downtrend, a high ratio of long accounts is often bearish, as it represents a large pool of trapped retail liquidity that can be squeezed downward.
Data-Driven Scoring & Conclusion
Below is the objective point-based assessment of the visible data metrics. (Scoring: 1 point for Bullish, 1 point for Bearish, 0 for Mixed/Neutral).
| Metric | Observation | Bias | Score |
| 1. Price, VP & S/D Zones | Macro downtrend, price below POC, heavy overhead supply. 4H local bounce. | Bearish | 1 Bearish |
| 2. Liquidations | Prominent short liquidations fueling the recent upside. | Bullish | 1 Bullish |
| 3. Power Trades | Heavy red dominance on 1D; weak/mixed buying on 4H. | Bearish | 1 Bearish |
| 4. Trading Activity | Short-term uptick in buying activity on the 4H timeframe. | Bullish | 1 Bullish |
| 5. CVD & Momentum | Macro CVD down, 4H momentum curling up. Conflicting timeframes. | Mixed | 0 |
| 6. Open Interest & Funding | 4H OI rising with price action, indicating localized long buildup. | Bullish | 1 Bullish |
| 7. Long/Short Ratio | Heavy long bias in a downtrend acts as downside liquidity. | Bearish | 1 Bearish |
| 8. Trend Structure | Lower highs and lower lows on the daily chart. | Bearish | 1 Bearish |
Final Calculation:
- Total Points Assigned: 7 points
- Bullish Points: 3
- Bearish Points: 4
Result:
- Bullish %: 3/7 ≈ 42.8%
- Bearish %: 4/7 ≈ 57.1%
Final Conclusion:
The market leans 57.1% Bearish. While there is a tradable short-term long opportunity supported by short liquidations, rising 4H open interest, and a local ascending trendline, the macro structure remains hostile. The asset is trading under significant overhead supply, below the primary volume node (POC), and exhibits a structurally weak daily CVD. The current upside should be treated as a relief rally within a broader downtrend until key daily supply zones are invalidated.
⚠️ RISK WARNING & AI DISCLOSURE
- This information is generated by Artificial Intelligence (AI) and complex algorithms. While advanced, these systems can contain errors or inaccuracies and are for educational purposes only.
- Technical analysis provides no guarantees; this information is purely informative.
- All discussed scenarios are hypothetical and do not constitute predictions or expectations.
- Past performance is not an indicator of future results.
- This is not financial advice and is not intended as a call-to-action for the reader.
- No implicit direction is claimed, and no specific behavior of market participants is suggested.