

Here is the analysis from the data that is calculated from AiTraderView.com App. We have combined the ETH/USDT data from both the daily (1d) and 4-hour (4h) orderflow charts to provide a comprehensive view.
The general context is clear: we remain in a high-timeframe downtrend where the market is attempting to find a floor, yet there is a distinct lack of conviction from buyers.
1. Price & Volume Profile & FVG
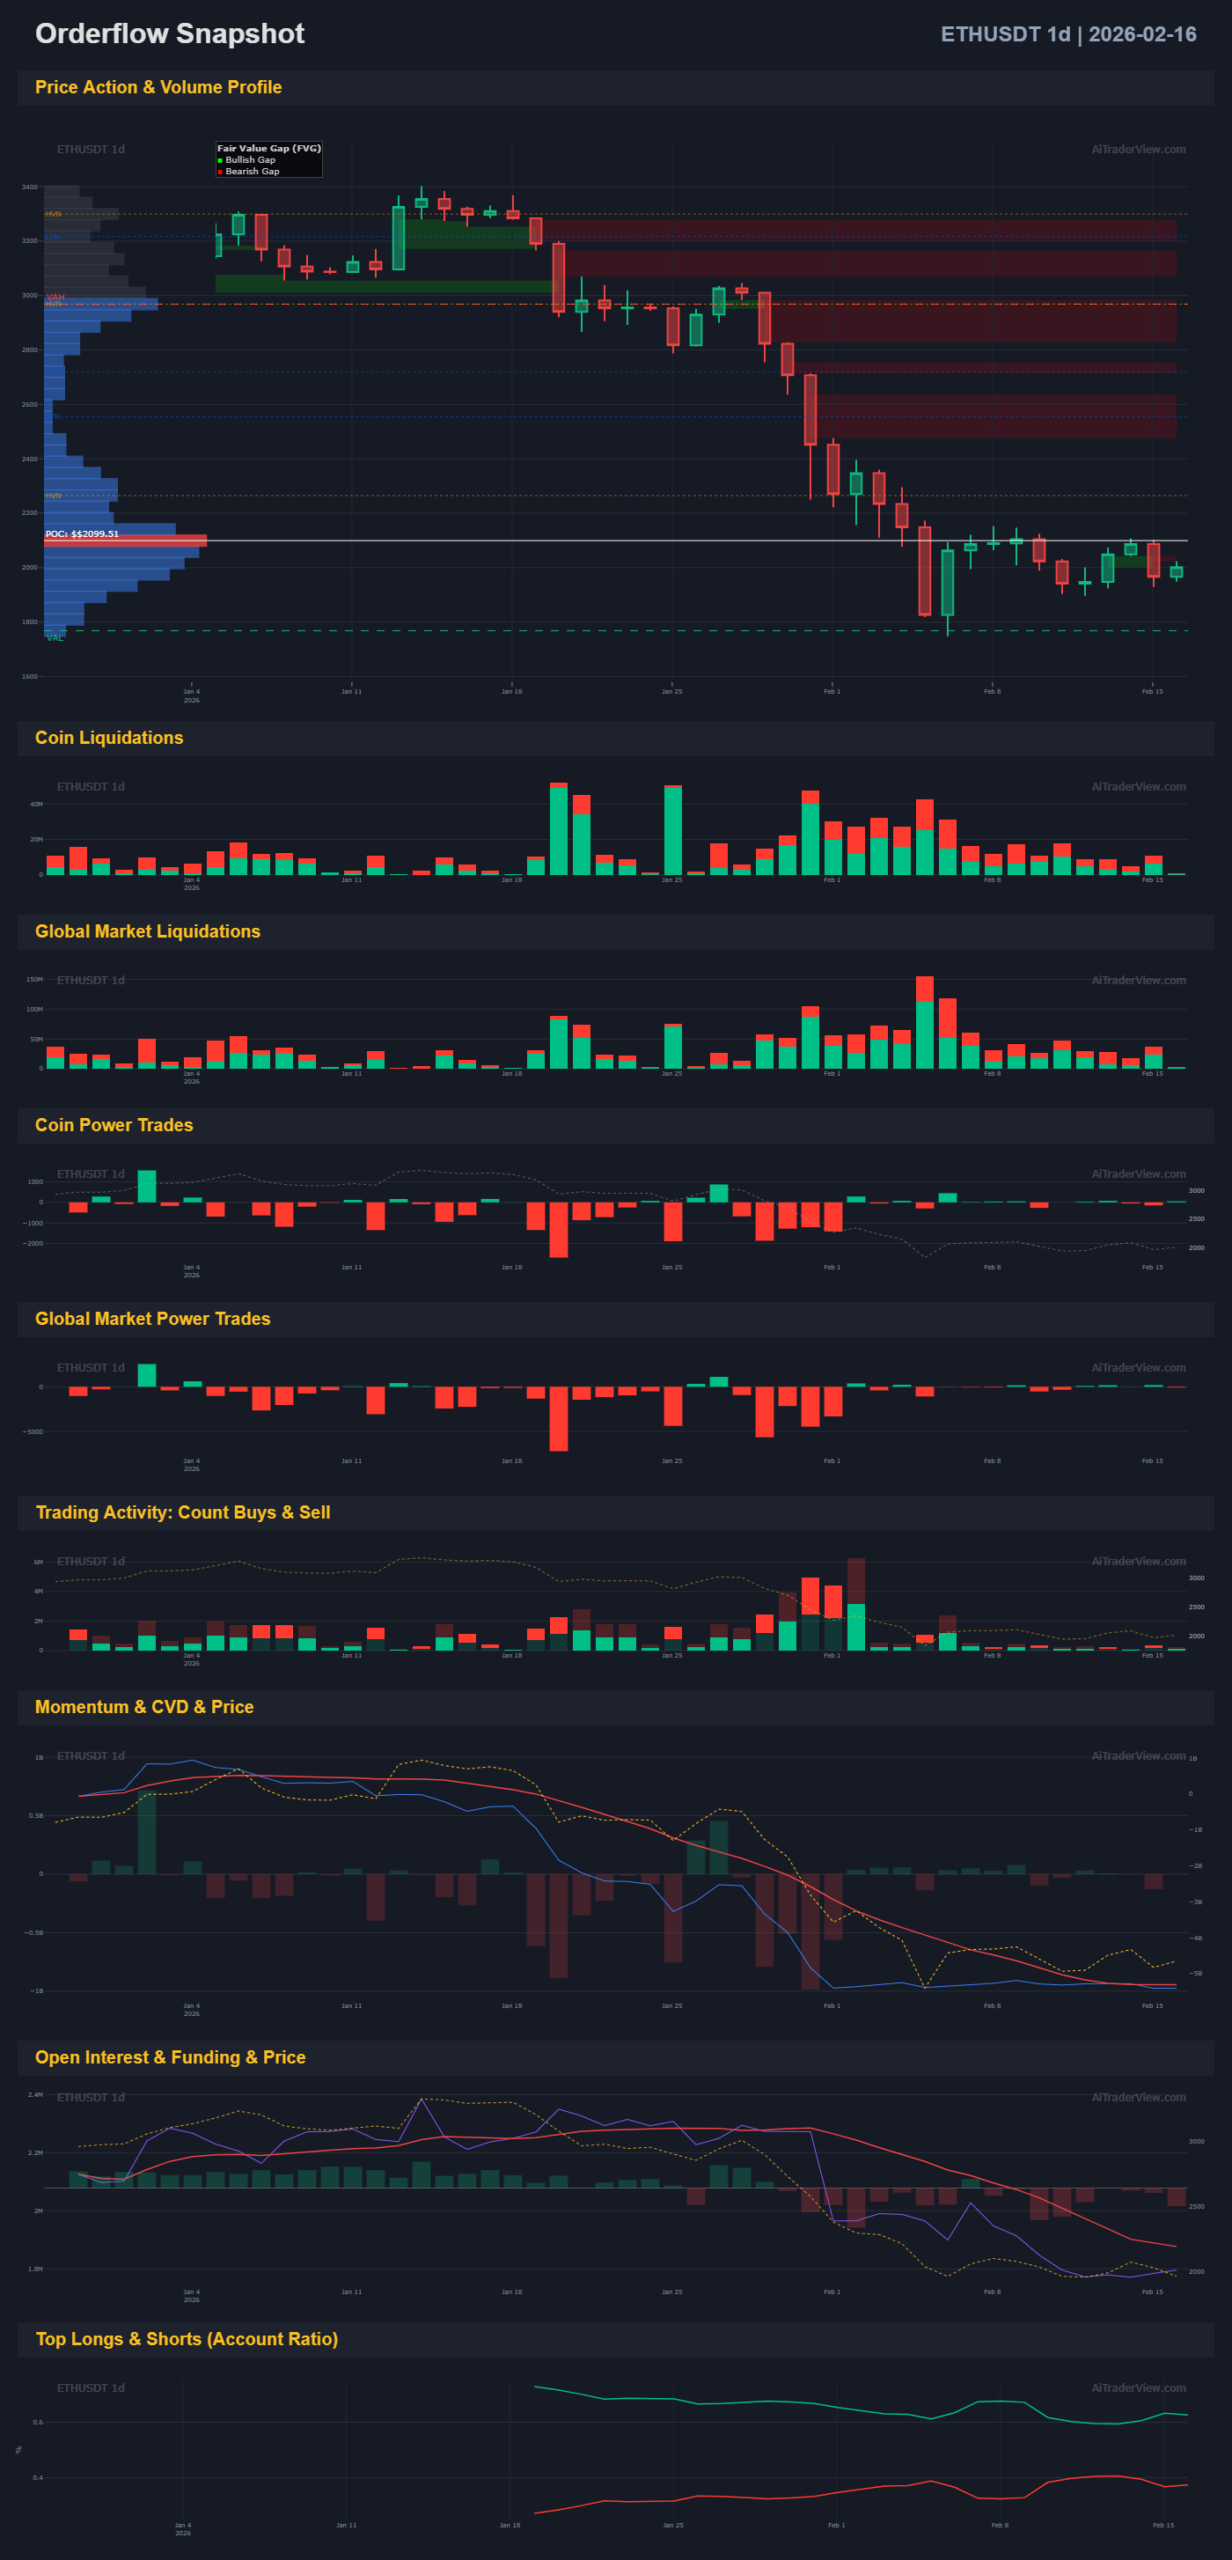
- 1D (Daily): Price action has been heavily bearish and is currently consolidating at the bottom of the range. We are trading directly on the Point of Control (POC) of the current local range (the red line around the current price). However, there is a massive amount of overhead resistance, marked by the red Bearish FVG (Fair Value Gaps). As long as we do not break above this, every rally is a ‘sell the rip’ opportunity.
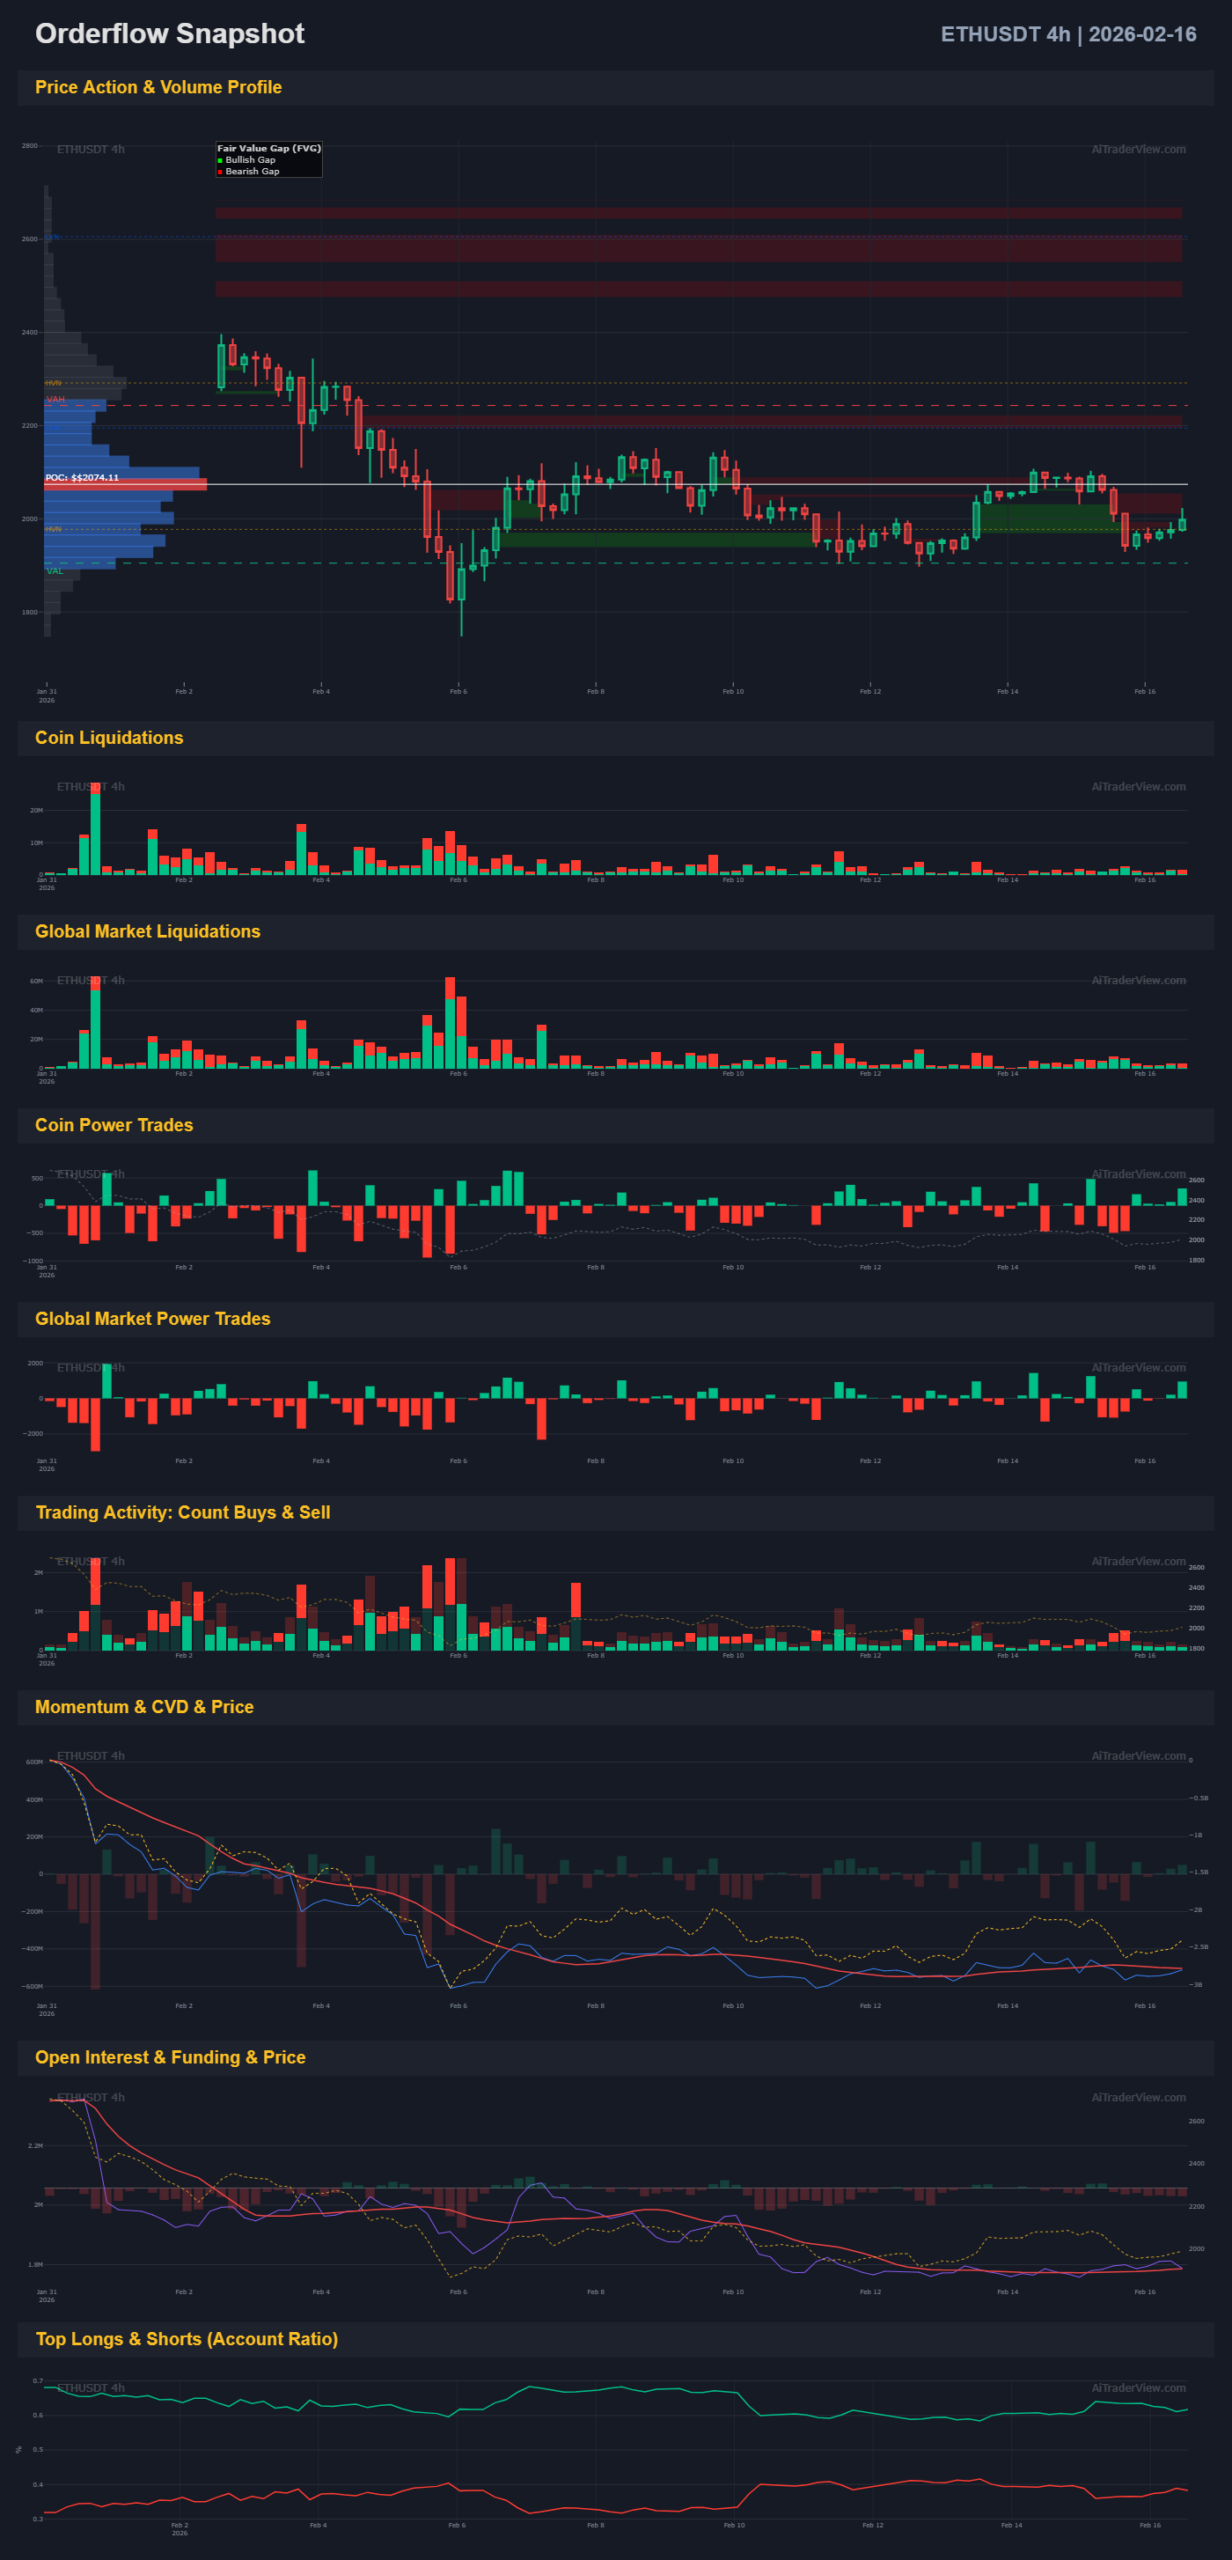
- 4H: On the lower timeframe, we see a range-bound market. Price is trapped between a green Bullish FVG (support) below and red resistance zones directly above. The price is struggling to move away from the local POC, indicating acceptance of lower prices or accumulation, but no signs of a reversal yet.
2. CVD & Momentum
- CVD (Cumulative Volume Delta): This is one of the most concerning indicators. On the 1D chart (orange line in the ‘Momentum & CVD’ panel), we see CVD dropping steadily even as price moves sideways. This means aggressive market sellers are dominant and are hitting into passive limit buys. This indicates absorption by sellers.
- Momentum: The momentum oscillators on the 1D are low and flat (negative momentum). On the 4H, there is no powerful divergence suggesting a quick turnaround; the structure looks weak.
3. Open Interest & Funding
- Open Interest (OI): OI dropped drastically during the initial crash (white line in the second-to-last panel) and has been flat since. No new money is flowing into the market to support a new trend. Flat OI during consolidation after a drop is often a sign of bearish consolidation (continuation).
- Funding: Funding rates appear neutral to slightly positive. There is no extreme “short squeeze” setup visible based on negative funding, which is often required for a V-shape recovery.
4. Long/Short Ratio & Trading Activity
- L/S Ratio: In the bottom panel (Account Ratio), we see ‘Top Longs’ (green line) remaining consistently high relative to shorts. In a downtrend, this is often a ‘contrarian’ bearish signal: retail traders are trying to buy the bottom (long), while ‘smart money’ is likely short or sitting on the sidelines. The market often moves against the crowded trade (maximum pain is down).
- Trading Activity: The count of buys and sells is decreasing. Volume is drying up. This indicates indecision, but in a downtrend, low volume usually favors trend continuation (lack of buyers).
5. Power Trades
- Global Market Power Trades: The 1D chart shows large red blocks (sell pressure) in the past during the drop. Recently on the 4H, the picture is mixed with some minor green and red outliers, but no dominant buy walls indicating institutional accumulation.
6. Liquidations
- Liquidations: The major “flush” has already occurred (see high liquidation bars on the left of the 1D). On the 4H chart, we recently see some green spikes (short liquidations). This implies that small pumps are being used to squeeze out early shorts, but price fails to follow through. This is weakness; shorts are liquidated, but there are no spot buyers to take over.
Scoring Table
Below is the quantification of the data from the charts.
| Component | Bullish Score | Bearish Score | Neutral | Notes |
| Price vs POC | 0 | 1 | 0 | Price below key Value Areas, hitting resistance. |
| Trend Structure | 0 | 1 | 0 | Lower Lows, Lower Highs on HTF. 4H is choppy. |
| CVD | 0 | 1 | 0 | Clear downtrend in CVD (sellers are aggressive). |
| Momentum | 0 | 1 | 0 | No strength, indicators remain in negative territory. |
| Open Interest | 0 | 0 | 1 | Flat. No influx of new capital. |
| Funding | 0 | 0 | 1 | No extreme values, market is balanced/waiting. |
| Long/Short | 0 | 1 | 0 | Crowded long trade (retail is long), contrarian bearish. |
| Trading Activity | 0 | 0 | 1 | Volume drying up, no conviction. |
Conclusion & Percentage
I sum the points per row. ‘Neutral’ counts towards the total variables (8) but adds no points to bullish or bearish.
- Total Components: 8
- Bullish Points: 0
- Bearish Points: 5
- Neutral: 3
The Percentages:
- Bullish: 0 / 8 = 0%
- Bearish: 5 / 8 = 62.5%
- (Neutral/Waiting: 37.5%)
Final Verdict:
The market structure is predominantly Bearish. The data shows that any minor relief rally is likely being sold into (selling into resistance). As long as CVD does not flip and we do not reclaim the red FVG zones, the path of least resistance is down. We are currently in a “no-trade” zone for longs.
⚠️ RISK WARNING & AI DISCLOSURE
- This information is generated by Artificial Intelligence (AI) and complex algorithms. While advanced, these systems can contain errors or inaccuracies and are for educational purposes only.
- Technical analysis provides no guarantees; this information is purely informative.
- All discussed scenarios are hypothetical and do not constitute predictions or expectations.
- Past performance is not an indicator of future results.
- This is not financial advice and is not intended as a call-to-action for the reader.
- No implicit direction is claimed, and no specific behavior of market participants is suggested.