
Market Overview: The February Shift
The charts display a remarkable correlation across the entire cryptocurrency market. A distinct market-wide pattern has emerged: asset prices collectively found a bottom (Lower Low) around February 6, 2026.
Since that pivot point, the market has undergone a structural shift. The bearish momentum has faded, characterized by the breaking of downward trendlines (red) and the formation of sustained upward support lines (green) marked by “Higher Lows” (HL).
Below is the specific trend analysis per coin based on the 4-hour (4h) timeframes:
1. ADA (Cardano)
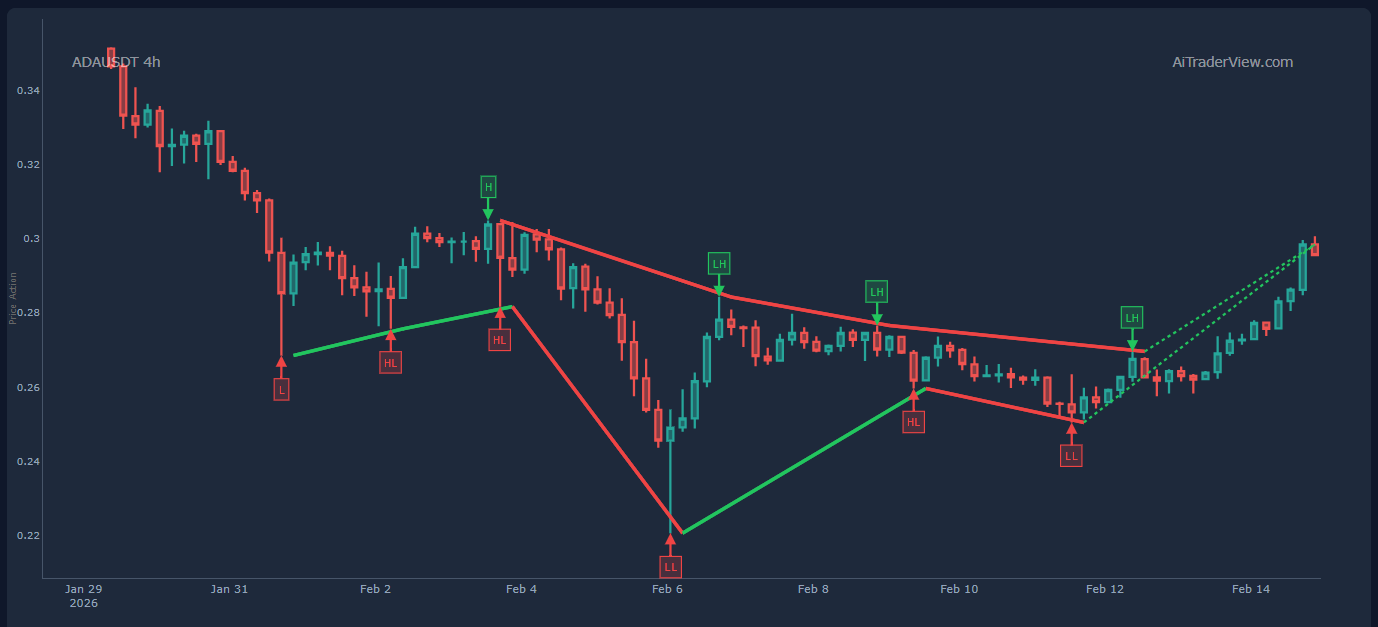
- Current Trend: Bullish.
- Structure: Following the February 6th low, a clear pattern of Higher Lows (HL) has been established. The price has successfully breached the descending resistance line.
- Projection: The technical indicators suggest a continuation of the breakout, targeting the 0.30 USDT level and above. Momentum is strictly positive.
2. AVAX (Avalanche)
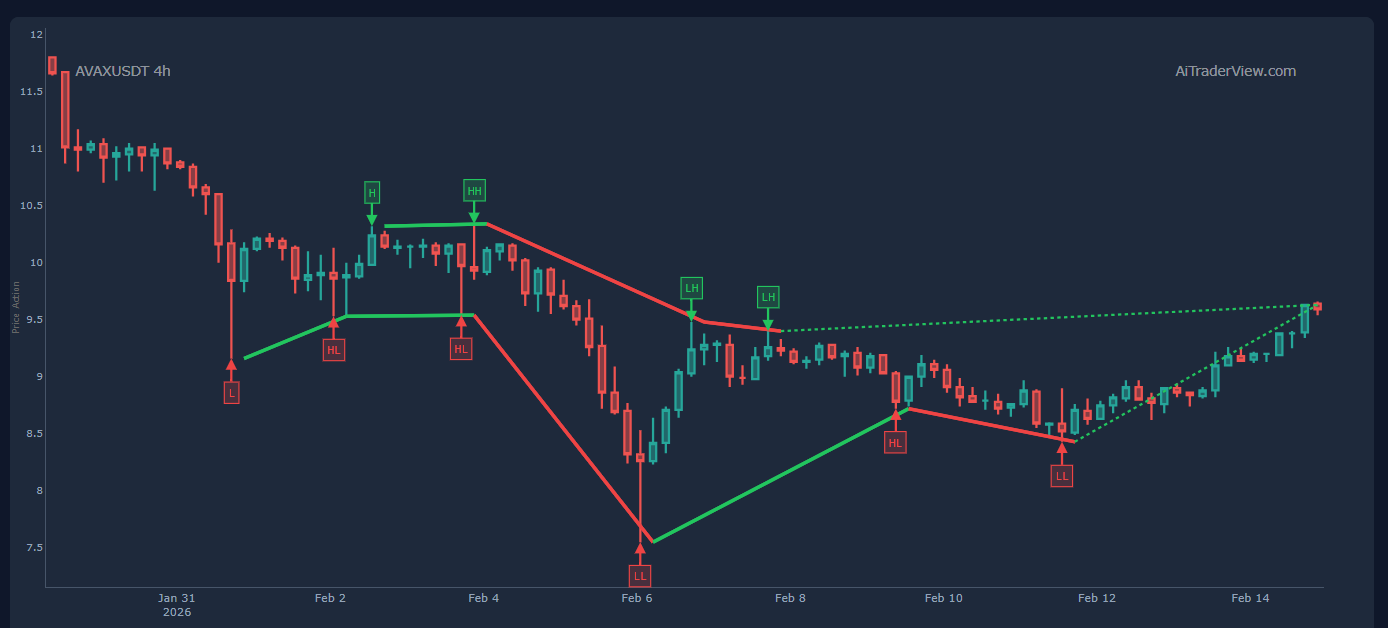
- Current Trend: Bullish Reversal.
- Structure: AVAX displays a sharp V-shaped recovery following its Lower Low. The price recently broke through local resistance (LH) and is currently consolidating just above 9.50 USDT.
- Projection: The trajectory points toward a further increase into the 9.60 – 9.70 zone, flipping the previous downtrend line into new support.
3. BTC (Bitcoin)
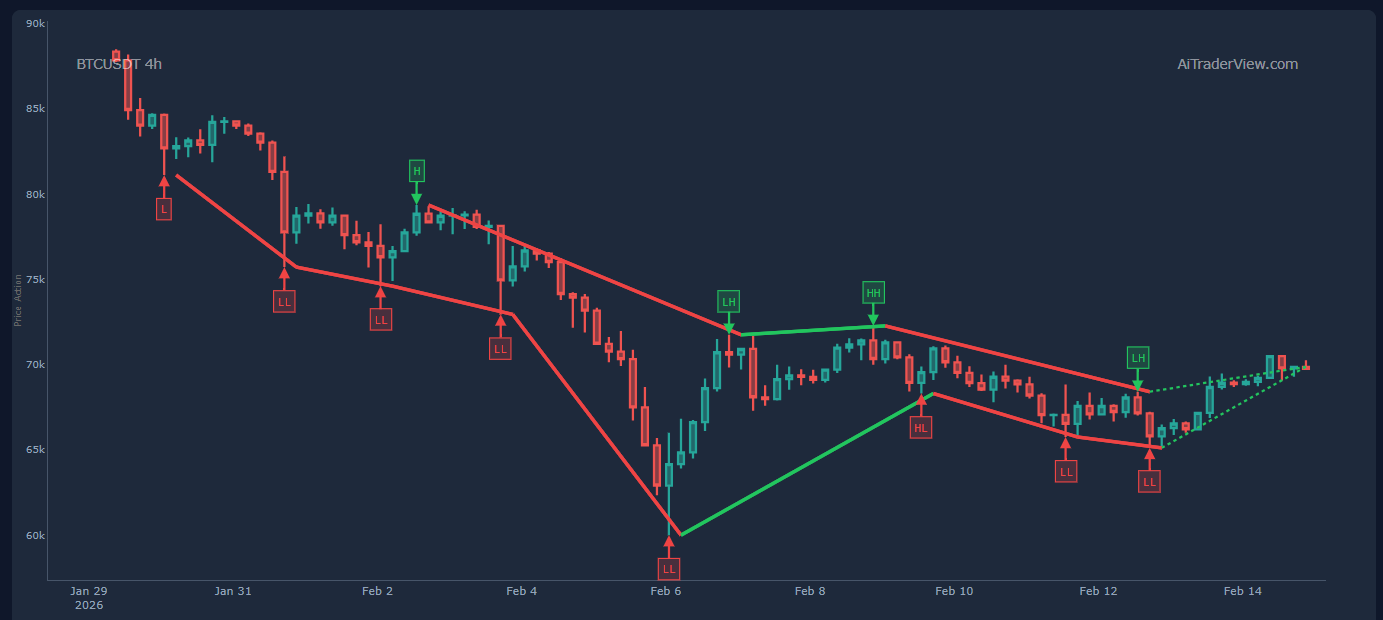
- Current Trend: Bullish Consolidiation & Breakout.
- Structure: Bitcoin established a firm floor around 60k before staging a powerful recovery. A “Higher High” (HH) was recently printed, and price action is exiting a falling wedge/flag pattern.
- Projection: The chart indicates a breakout above the final resistance trendline near 70k. If this support holds, the setup favors a retest of previous market tops.
4. DOT (Polkadot)
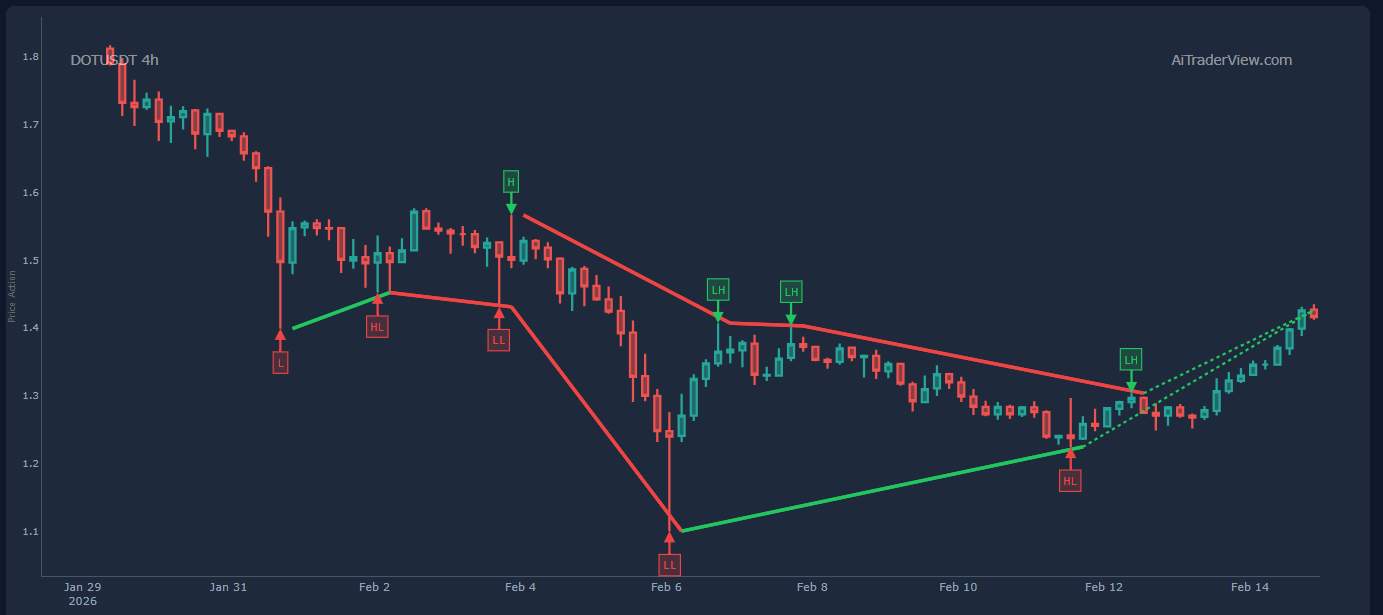
- Current Trend: Bullish Recovery.
- Structure: After a deep correction to ~1.10 USDT, DOT is climbing out of the trough. The confirmation of a recent “Higher Low” (HL) around 1.22 was critical in validating the trend reversal.
- Projection: The price is currently piercing through diagonal resistance, with a short-term target set at 1.45 USDT.
5. ETH (Ethereum)
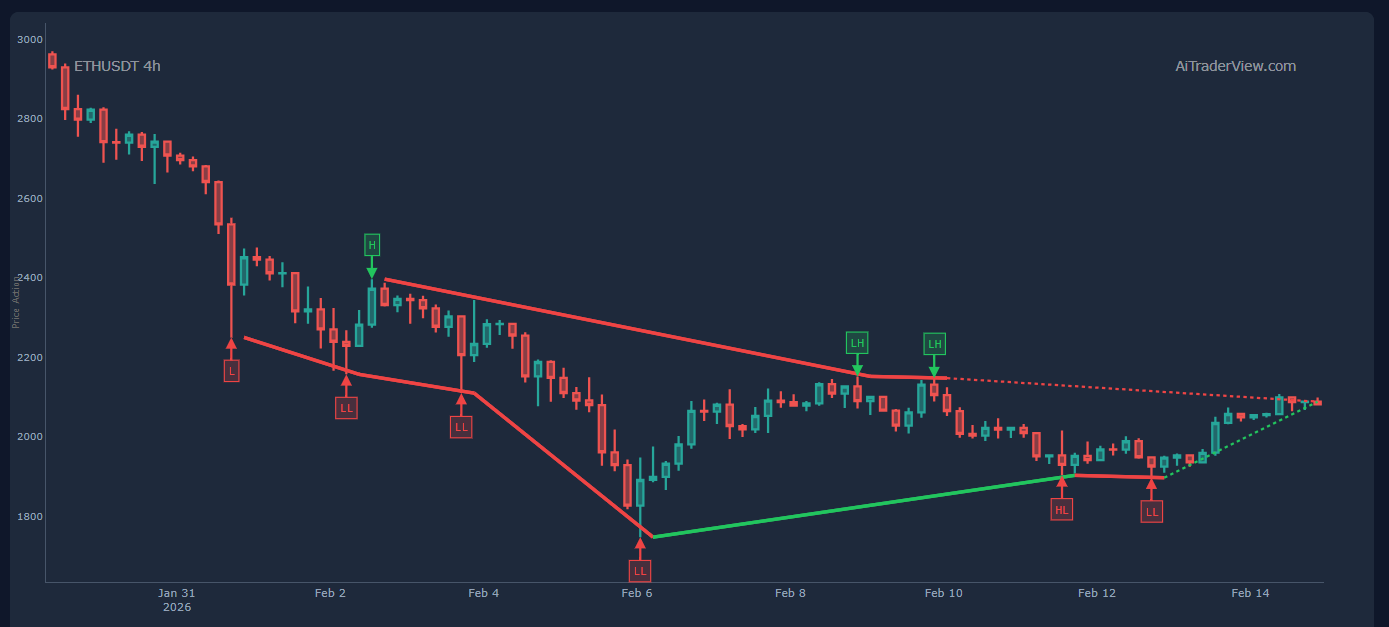
- Current Trend: Pending Breakout.
- Structure: ETH is coiling within a narrowing triangle pattern. The bottom (LL) was found near 1750. The continuous formation of Higher Lows (HL) indicates building buying pressure.
- Projection: Price action is pressing against the upper resistance line near 2100. The chart structure suggests an imminent upward breakout is likely.
6. LINK (Chainlink)
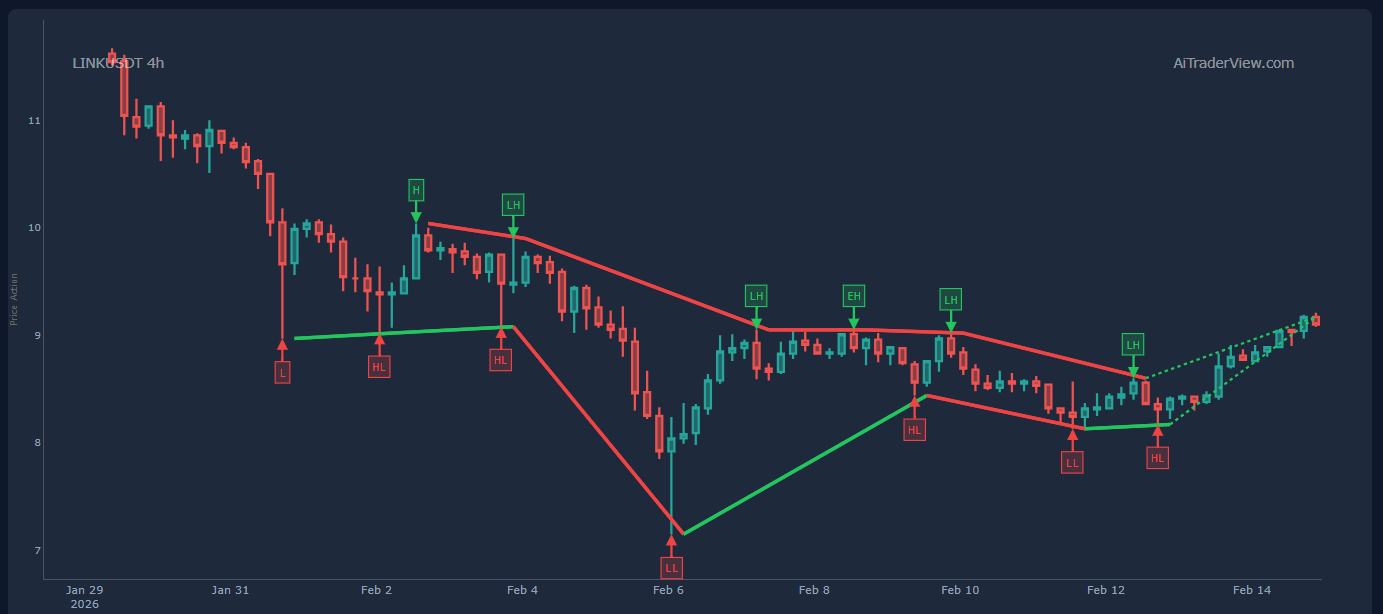
- Current Trend: Strongly Bullish.
- Structure: LINK has maintained a very healthy upward channel since the February 6th bottom. The Higher Lows are stepping up methodically.
- Projection: The price is currently testing the 9.00 – 9.20 USDT zone. As long as the green support trendline remains intact, the bullish structure holds.
7. SOL (Solana)
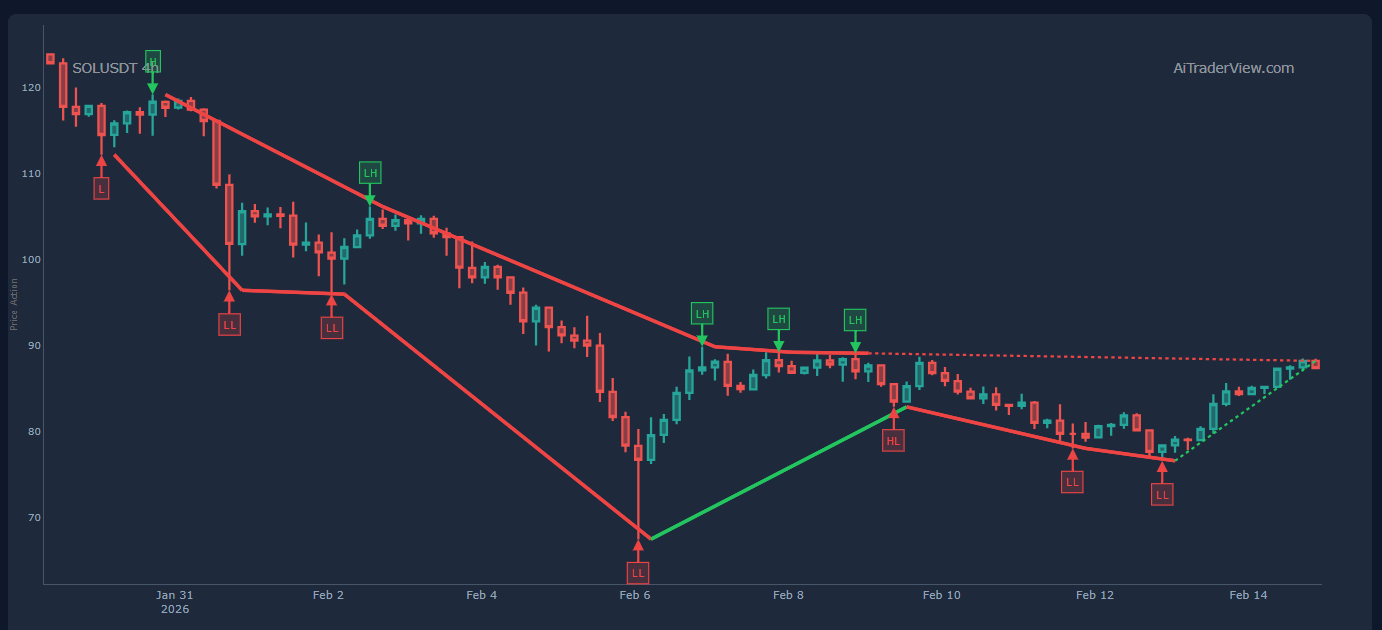
- Current Trend: Bullish Consolidation.
- Structure: Solana found support around 68 USDT and has recovered to approximately 88 USDT. Recent price action has been sideways/consolidating, building a base for the next leg up.
- Projection: The price is on the verge of breaking through horizontal/diagonal resistance, which could trigger a rapid acceleration of the trend.
8. XLM (Stellar)
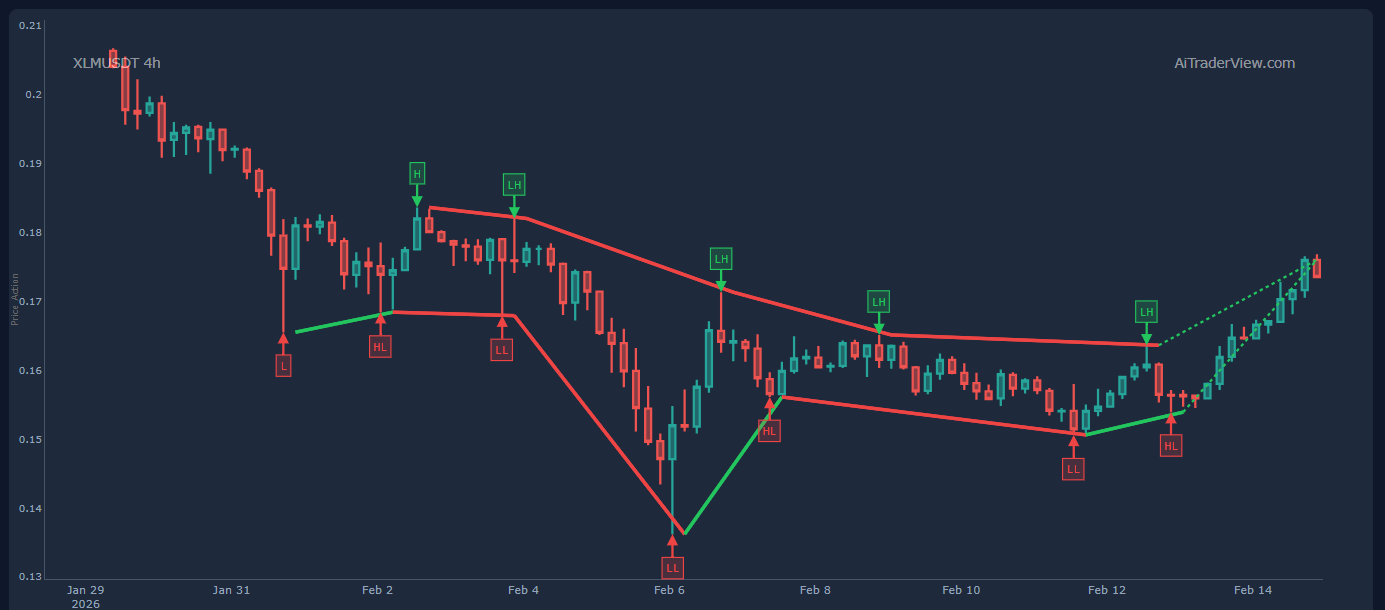
- Current Trend: Aggressively Bullish.
- Structure: While displaying high volatility, XLM shows a strong upward impulse following the bottom at 0.135. The recent ‘Higher Low’ has been confirmed.
- Projection: The price is breaking out with strength and appears to be on a path toward the 0.180 zone.
9. XRP (Ripple)
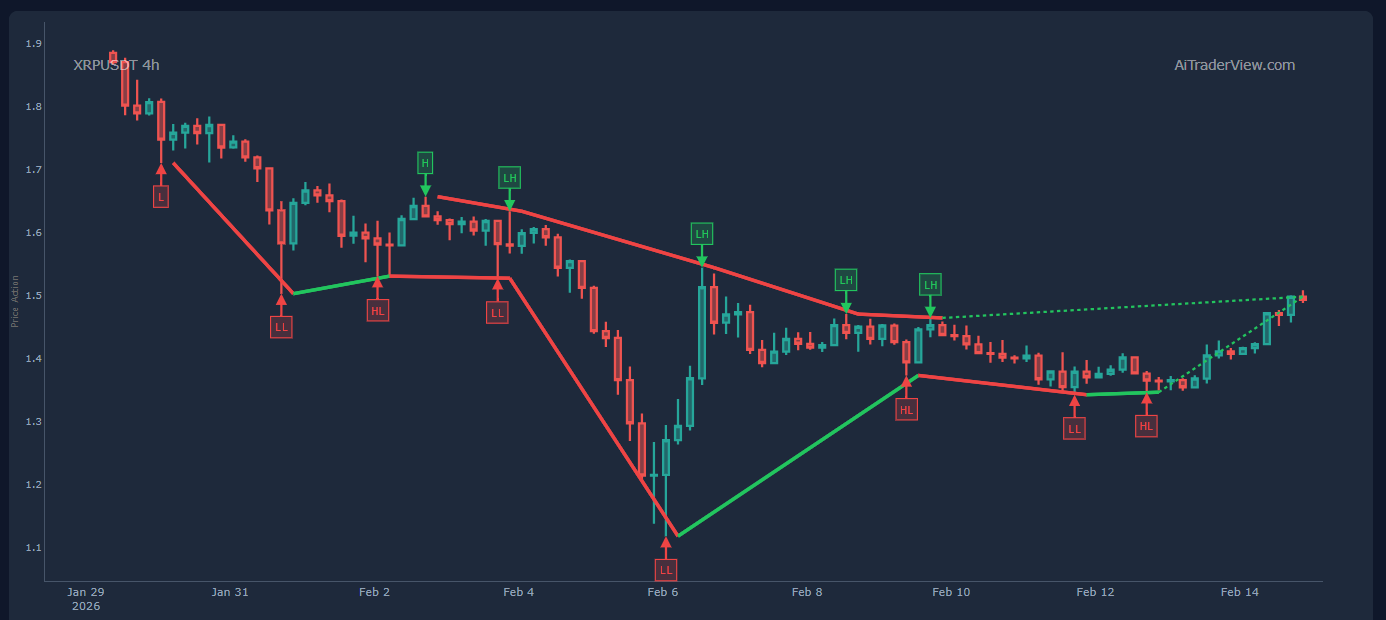
- Current Trend: Bullish.
- Structure: XRP is forming a large symmetrical recovery pattern. Successive Higher Lows (HL) are supporting the price in the 1.35 – 1.40 region.
- Projection: The chart suggests a breakout above the 1.50 USDT threshold is underway, clearing the path to test higher resistance levels.
Summary
The market appears to have collectively exited a corrective phase that concluded on February 6th. All analyzed assets are now printing Higher Lows and shattering their respective downtrend lines. Momentum across all charts currently favors the bulls.
⚠️ RISK WARNING & AI DISCLOSURE
- This information is generated by Artificial Intelligence (AI) and complex algorithms. While advanced, these systems can contain errors or inaccuracies and are for educational purposes only.
- Technical analysis provides no guarantees; this information is purely informative.
- All discussed scenarios are hypothetical and do not constitute predictions or expectations.
- Past performance is not an indicator of future results.
- This is not financial advice and is not intended as a call-to-action for the reader.
- No implicit direction is claimed, and no specific behavior of market participants is suggested.