

Based on the data of our Technical Analysis Software, here is a technical analysis of the Cardano ADA/USDT (Cardano) chart.
1. General Overview
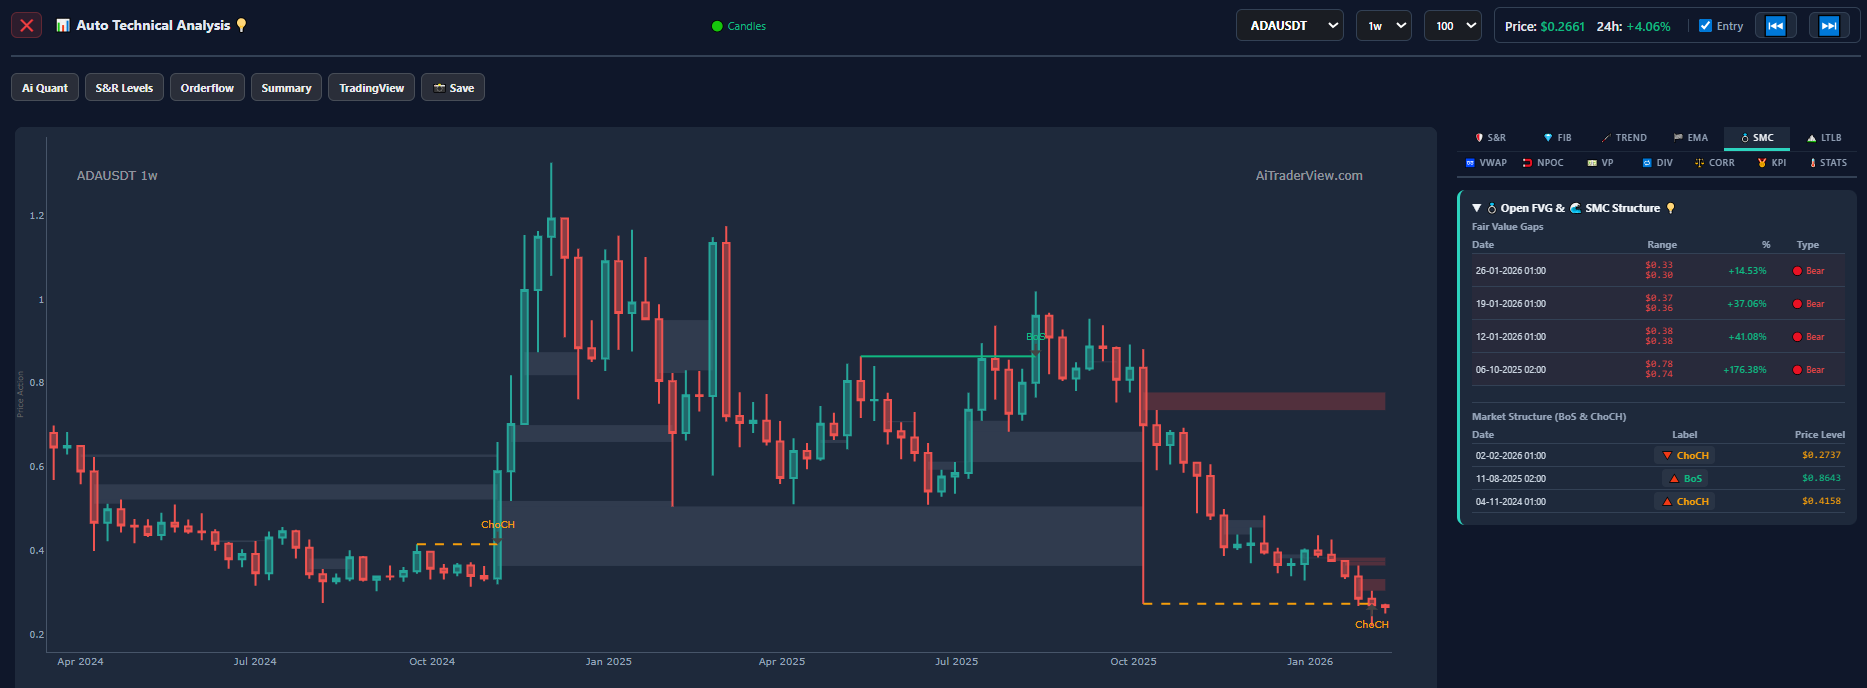
- Asset: ADA (Cardano) versus USDT (Tether).
- Timeframe: 1 Week (1w). Each candle represents one week of price action. This is a long-term chart.
- Current Price: $0.2661.
- Current Date (according to chart/interface): February 2026.
2. Market Structure (SMC – Smart Money Concepts)
The chart relies heavily on SMC indicators. These are the most critical signals:
- Bearish ChoCH (Change of Character): In the bottom right of the chart, a “ChoCH” label is visible with an orange dotted line around the level of $0.2737.
- Meaning: The price has dropped below a significant previous ‘low’. This confirms a shift in market character from (potentially) neutral/bullish to bearish.
- The current price ($0.2661) is trading below this level, confirming market weakness.
- Full Retracement: The chart shows that the massive price surge from late 2024 (where the price peaked above $1.20) has been completely erased. The price has returned to the “base” seen in 2024.
3. Key Levels (Support & Resistance)
- Current Support: The price is now sitting in a historical consolidation zone from 2024 (between $0.25 and $0.40). If this level fails to hold, the price could drop further.
- Resistance (FVGs): The right sidebar (under “Open FVG”) lists several Bearish Fair Value Gaps. These are zones where the price will likely encounter resistance if it attempts to rise:
- $0.30 – $0.33: First heavy resistance (+14.53% from current price).
- $0.36 – $0.37: Second resistance zone.
- The fact that these are marked as “Bear” suggests significant selling pressure exists in these zones.
4. Trend Analysis
- Long-term Trend: The trend is strongly downward. Following the peak in early 2025, a series of ‘lower highs’ and ‘lower lows’ has been established.
- Momentum: The large red candles in the second half of 2025 demonstrate aggressive selling pressure. There is no clear sign of a bottom formation yet (such as a long lower wick or a bullish engulfing candle).
Conclusion
The chart presents a very bearish picture for ADA on the weekly timeframe.
- The market structure has broken to the downside ($0.2737).
- There is heavy resistance directly above the current price ($0.30+).
- This is a “round trip” scenario: all gains from the previous bull run have evaporated.
You can also use this chart for free in our technical analysis software. Create an account and you can start using the web app right away.
⚠️ RISK WARNING & AI DISCLOSURE
- This information is generated by Artificial Intelligence (AI) and complex algorithms. While advanced, these systems can contain errors or inaccuracies and are for educational purposes only.
- Technical analysis provides no guarantees; this information is purely informative.
- All discussed scenarios are hypothetical and do not constitute predictions or expectations.
- Past performance is not an indicator of future results.
- This is not financial advice and is not intended as a call-to-action for the reader.
- No implicit direction is claimed, and no specific behavior of market participants is suggested.