
Ethereum (ETH) is currently trading around $1,948, having broken through a key structural support level. Unlike Bitcoin, which is testing support, Ethereum has confirmed a breakdown below its immediate Support 1 (S1) level, signaling a continuation of the aggressive downtrend established over the past week.
This analysis examines the bearish market structure, order flow dynamics, and the specific technical indicators driving this price action.
Market Structure & Trend: Confirmed Breakdown
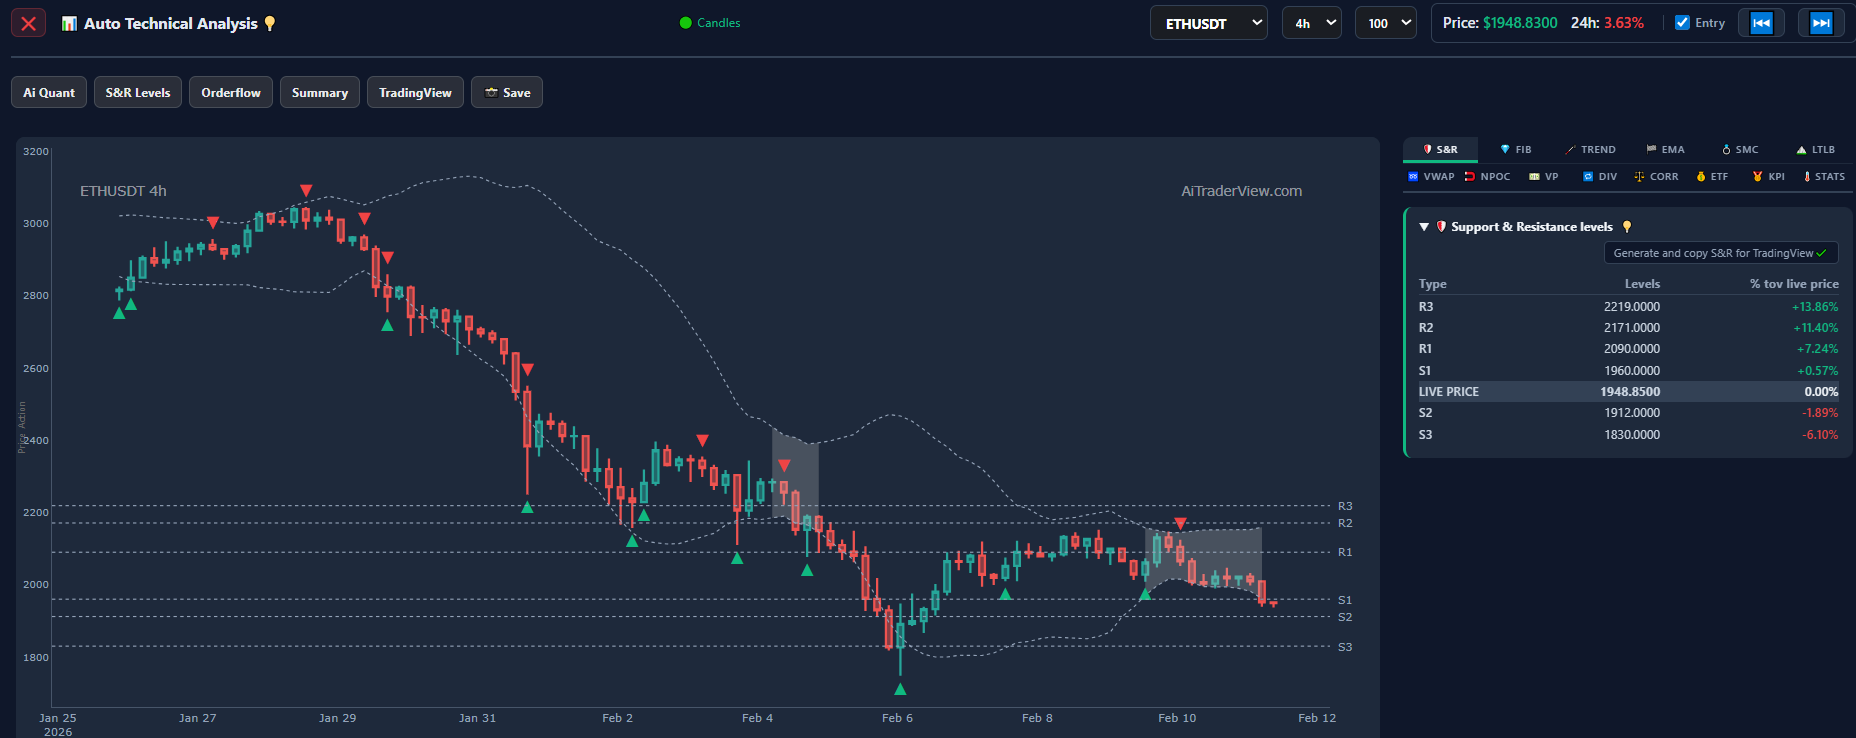
The technical landscape for Ethereum is decisively bearish across intraday timeframes. According to the 4-hour chart data, ETH is trading below the critical $1,960 support level.
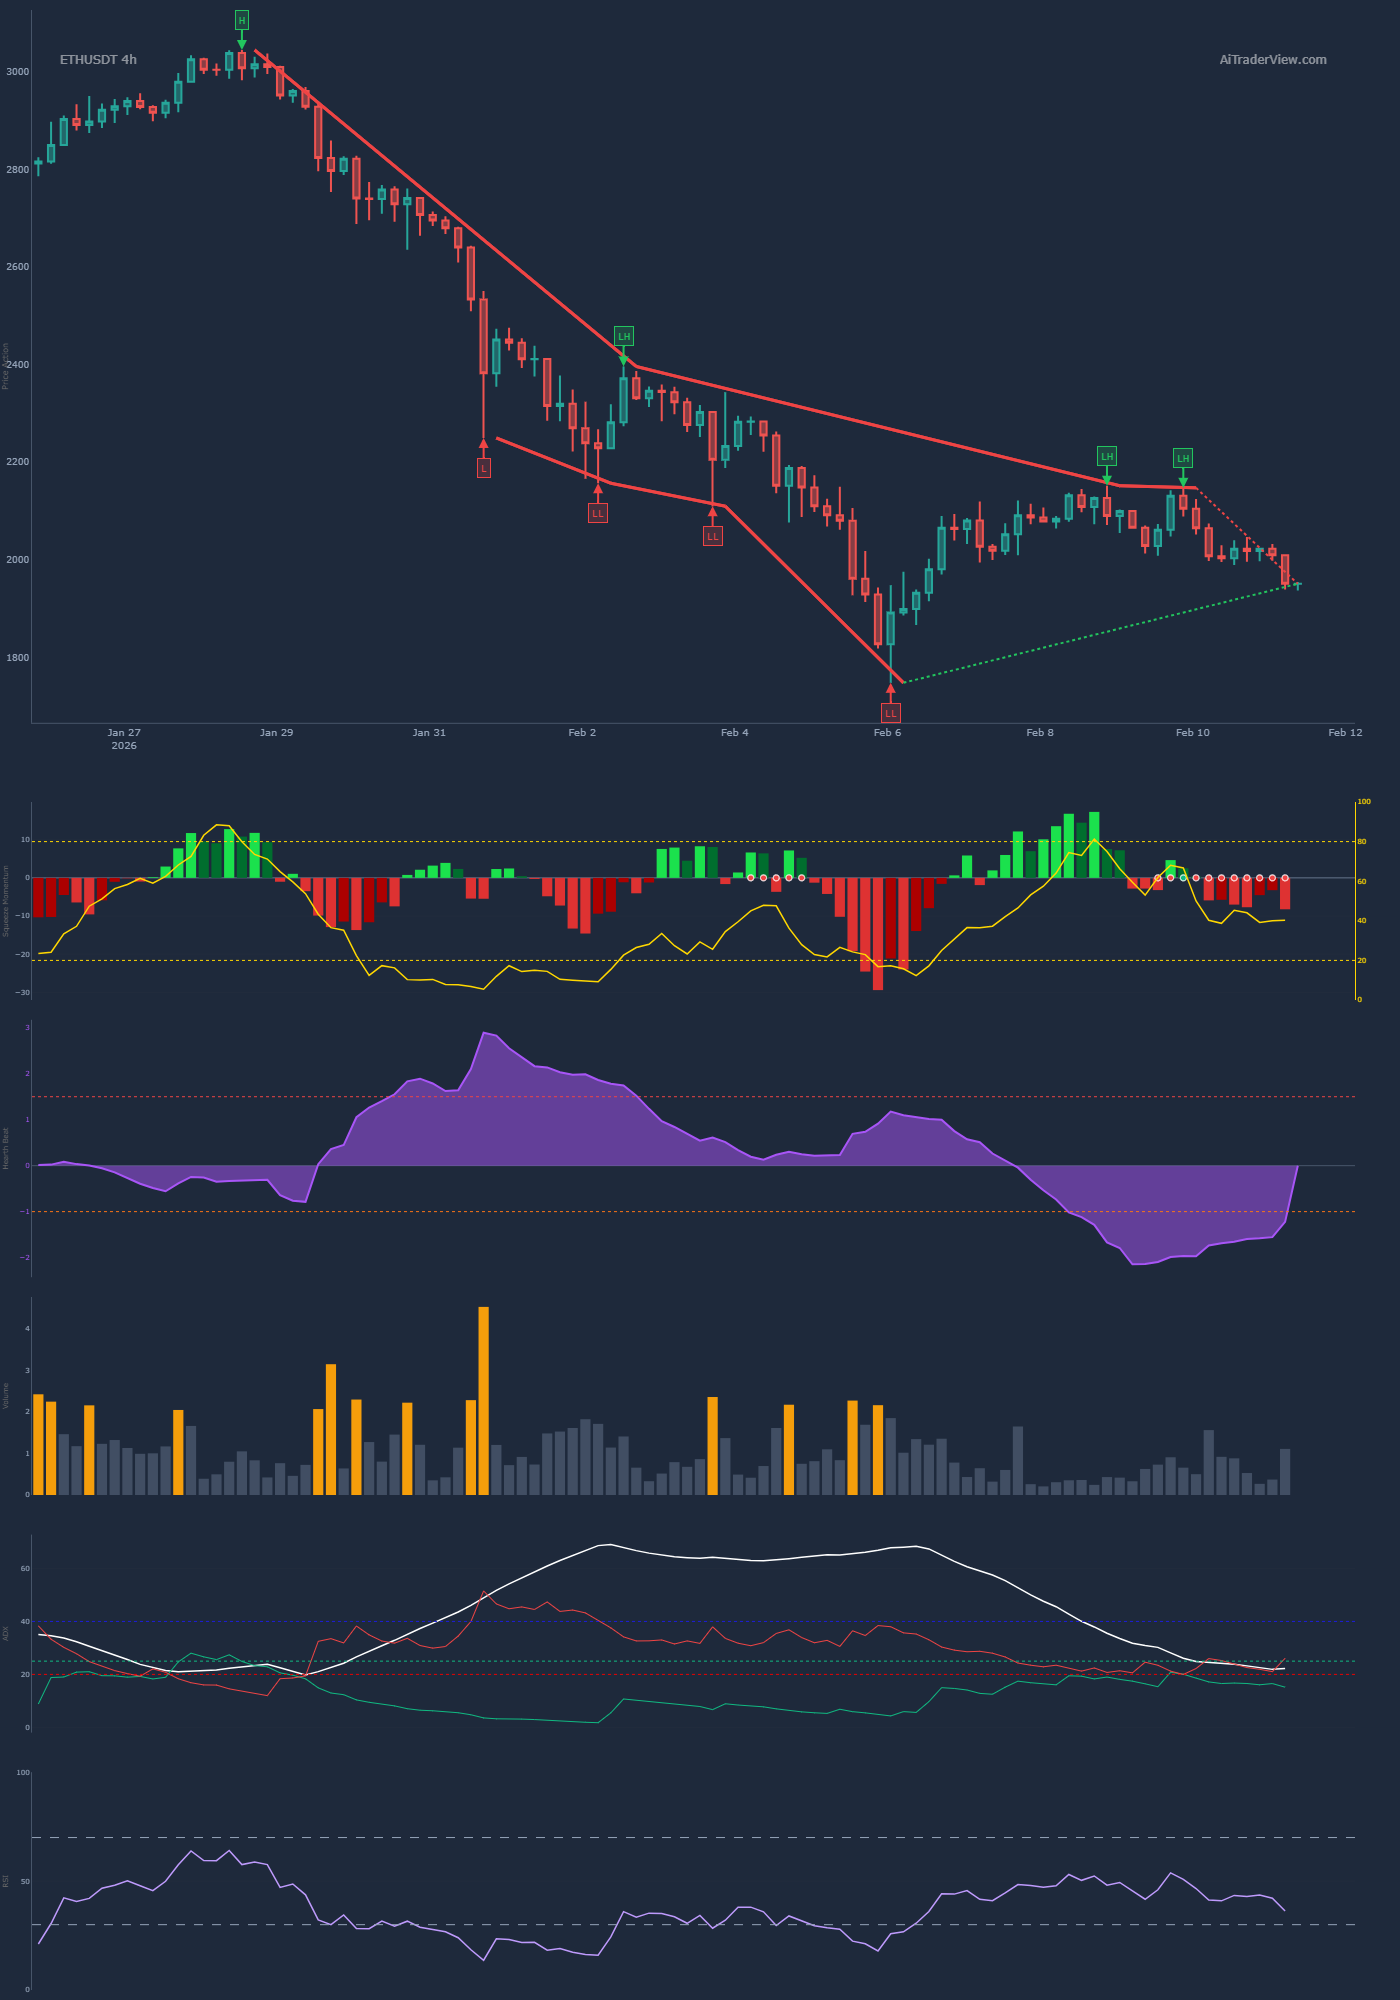
- Smart Money Concepts (SMC): The market structure is defined by a series of Lower Highs (LH) and Lower Lows (LL). The most recent rejection created a Lower High before the price cascaded down to current levels.
- Support & Resistance Levels:
- Resistance (R1): $2,090 (Previous support flipped to resistance).
- Broken Support (S1): $1,960 (Now acting as immediate overhead resistance).
- Target Support (S2): $1,912.
- Critical Low (S3): $1,830.
- Trend Channel: Price is respecting a steep descending channel. The failure to maintain the pennant structure formed earlier in the week has accelerated the move downward.
Momentum & Volatility: The Squeeze Fires Short
The momentum indicators confirm that this move is supported by significant volatility rather than just a lack of liquidity.
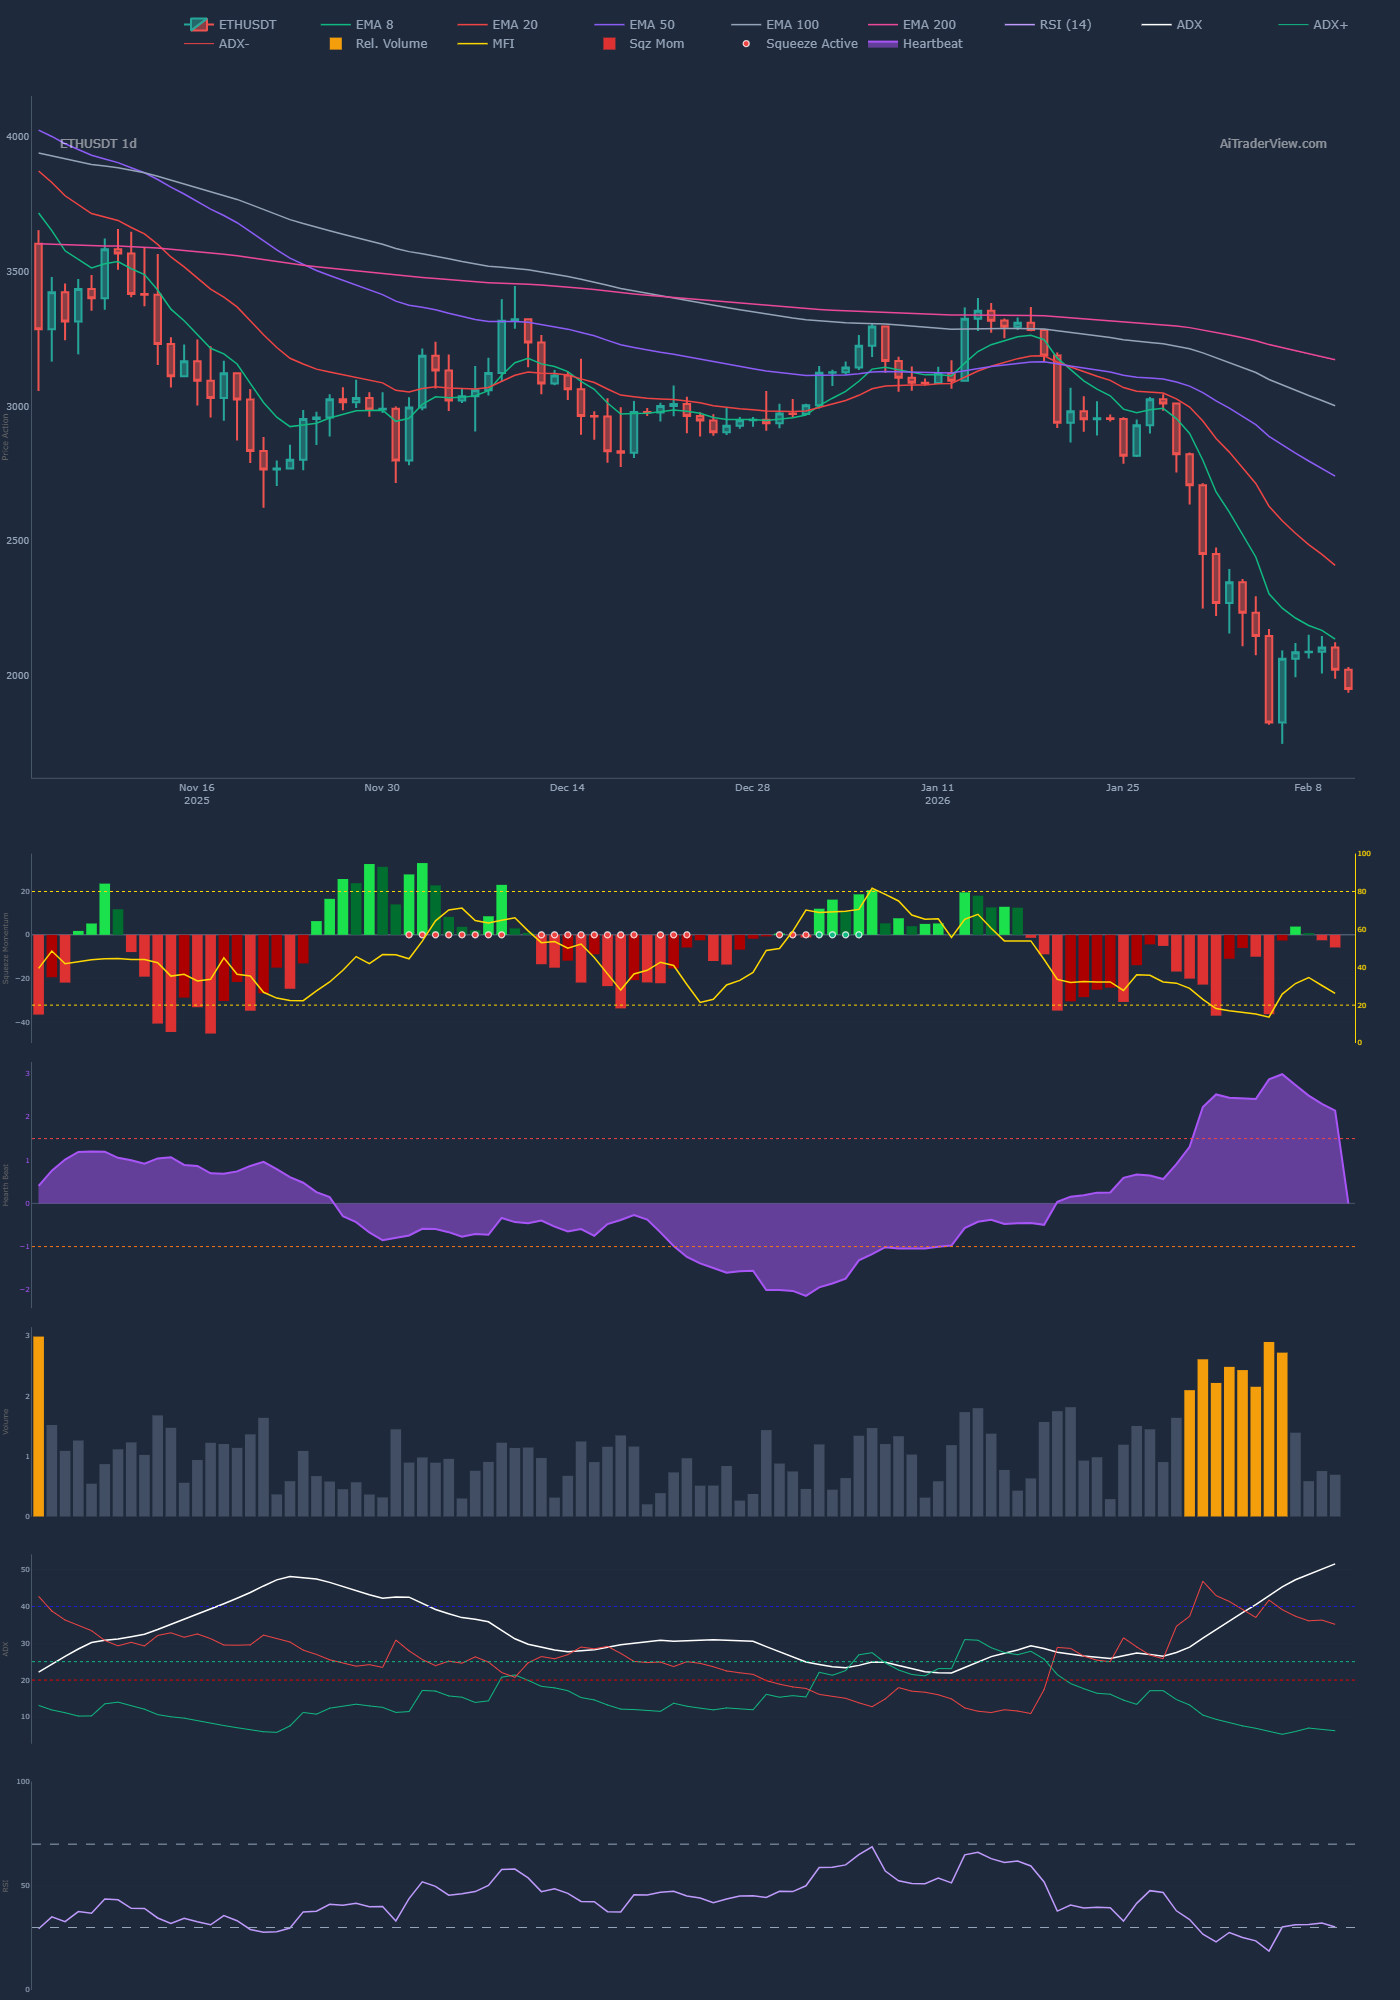
- ADX (Trend Strength): The Average Directional Index (ADX) is rising sharply and is currently above 30. A rising ADX signifies that the current bearish trend is gaining strength and is not merely a ranging market.
- TTM Squeeze: The Squeeze indicator on the 1-hour and 4-hour charts shows red histograms, indicating a fired short squeeze. The momentum bars are expanding downward, suggesting the selling pressure is intensifying rather than exhausting.
- EMAs: Ethereum is trading well below its EMA ribbon. The 20 EMA is acting as a dynamic ceiling, preventing any mean reversion. The gap between the EMA 20 and EMA 50 is widening, a classic bearish expansion signal.
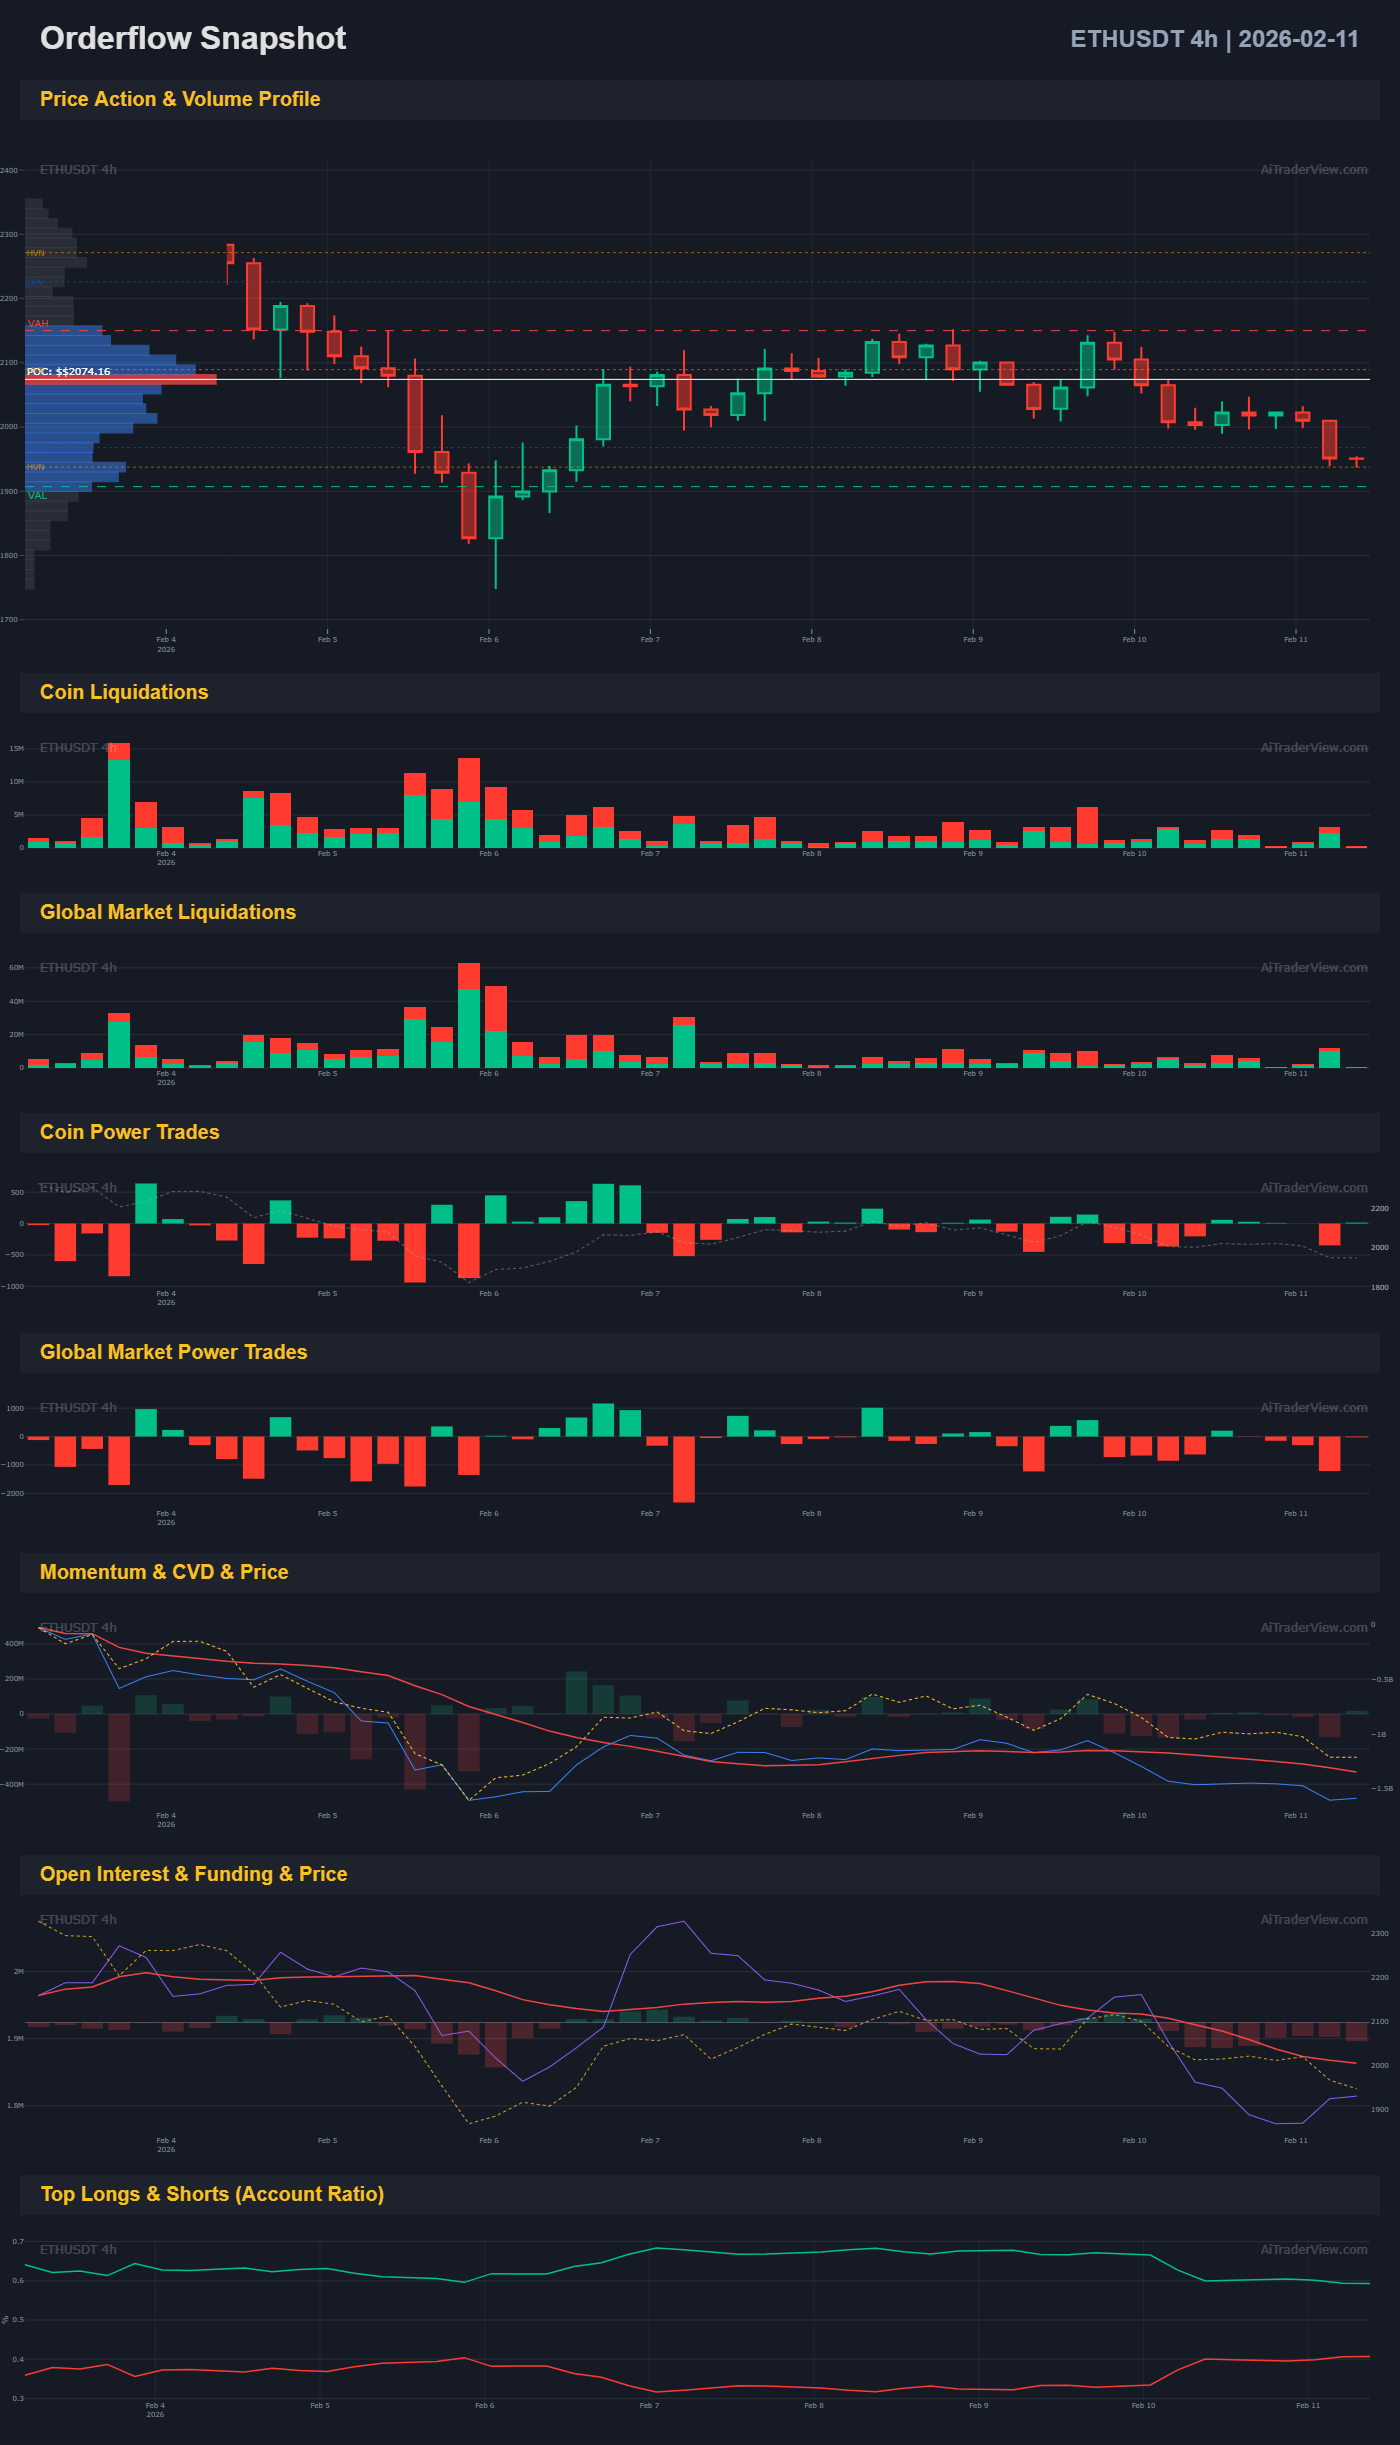
Order Flow & CVD: Aggressive Selling
The internal market data reveals that aggressive sellers are driving price action.
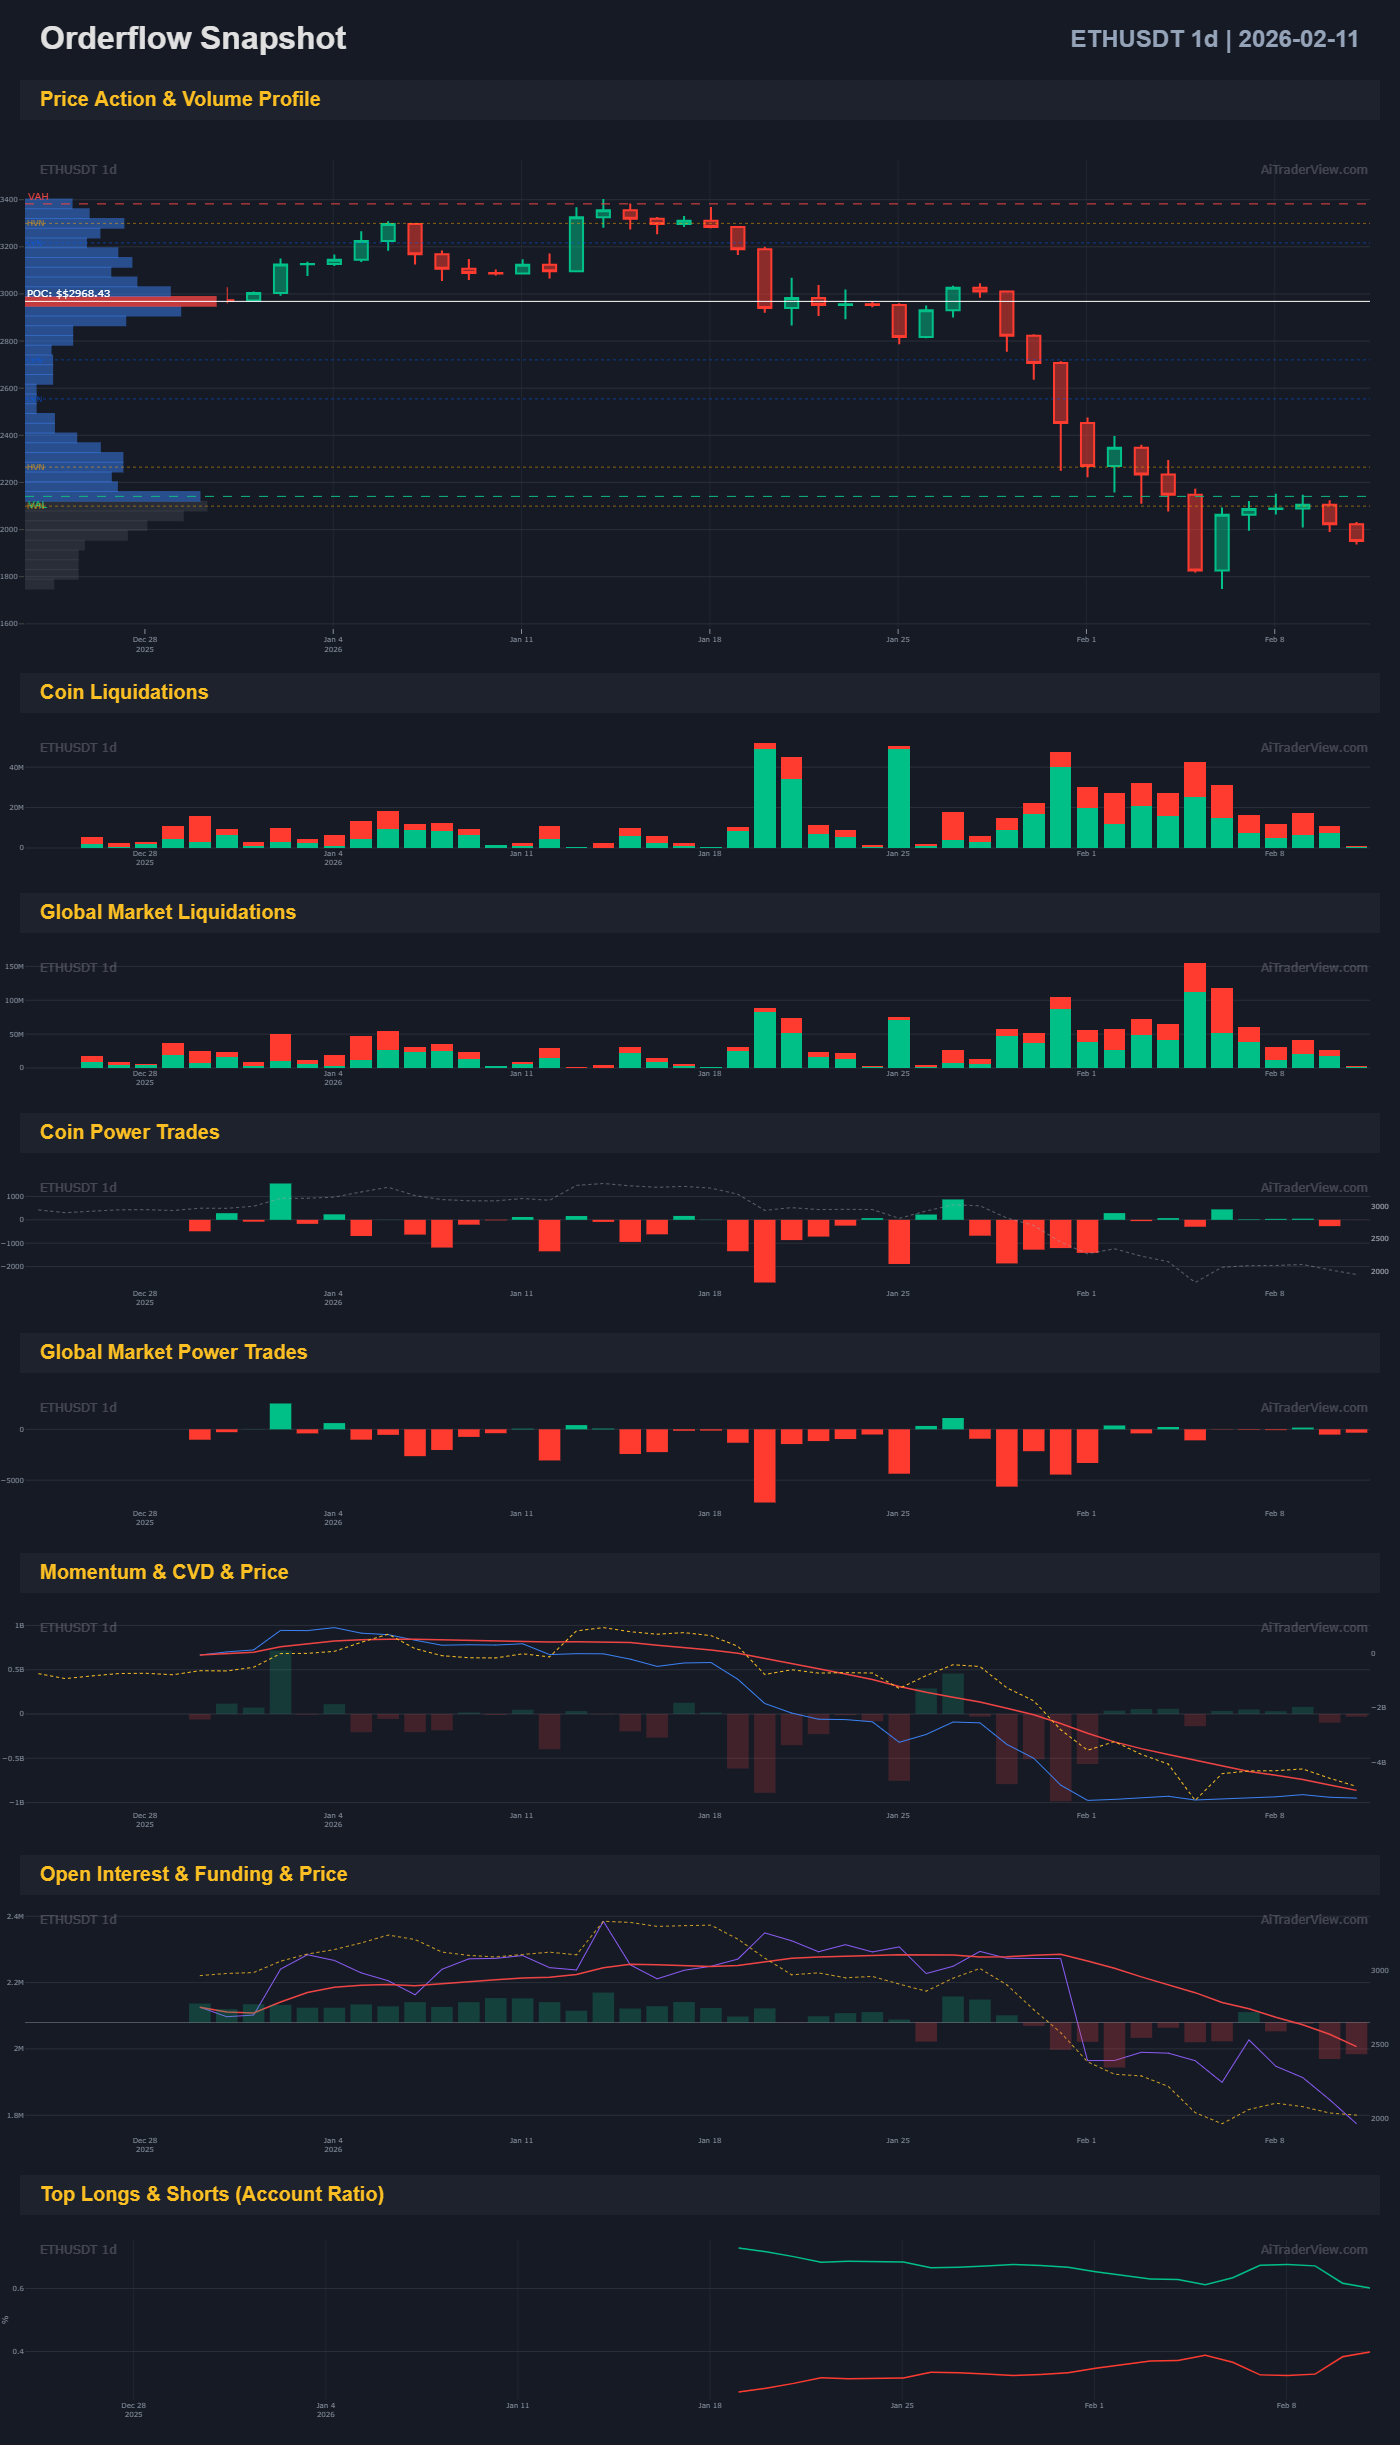
- Cumulative Volume Delta (CVD): The CVD is trending sharply downward on both the 4-hour and daily timeframes. This divergence indicates that market sell orders are overwhelming limit buy orders.
- Volume Profile: The Point of Control (POC) for the recent 4-hour session sits at $2,037. With price now trading nearly $100 below this level, the $2,037 zone will likely act as a formidable supply wall if a bounce occurs.
- Liquidations: The drop below $2,000 triggered a cascade of long liquidations (green bars in the liquidation pane). The market is effectively hunting liquidity pockets lower down, as open interest remains relatively sticky despite the price drop.
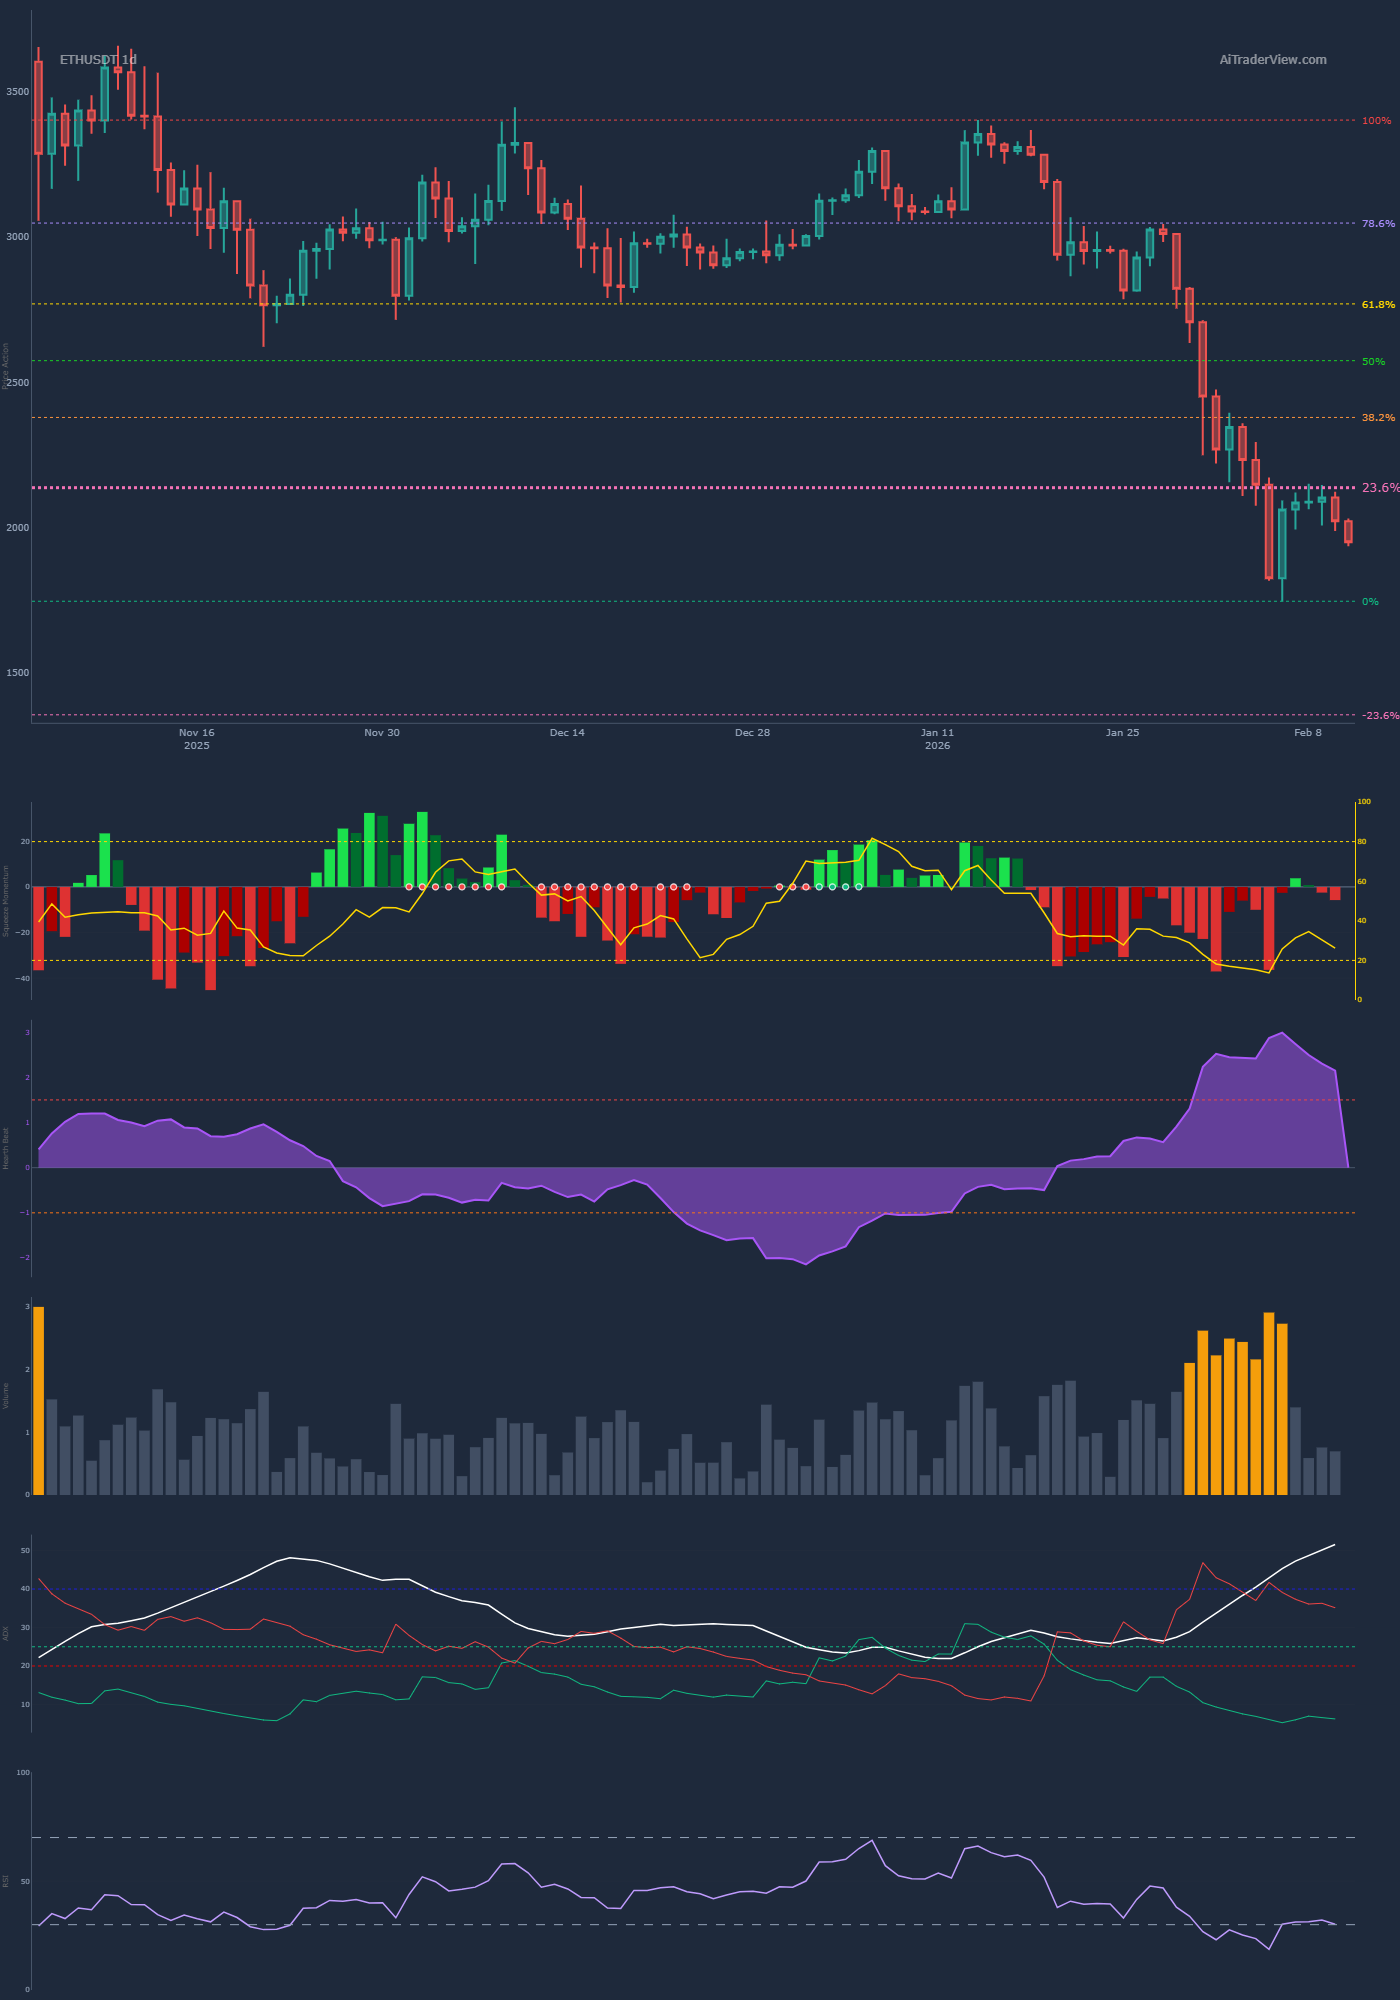
Fibonacci & Key Zones
On the daily timeframe, Ethereum is approaching a critical “line in the sand.”
- Fibonacci Levels: Having decisively lost the 23.6% retracement level, price action is now hovering just above the 0% baseline (the previous swing low). A break below this swing low would put ETH in “price discovery” mode to the downside relative to the recent range.
- RSI: The Relative Strength Index (RSI) is hovering near the 30 level (oversold territory). While this typically suggests a potential relief bounce, in a strong trending market (high ADX), the RSI can stay oversold for extended periods while price continues to drop.
Summary
Ethereum’s technical posture is significantly weaker than the broader market. The loss of the $1,960 support level changes the immediate outlook from consolidation to trend continuation.
The combination of a rising ADX, a fired short squeeze, and negative CVD suggests that the path of least resistance remains downward toward $1,912 and potentially $1,830.
- Bearish Scenario: Sustained trading below $1,960 validates the move toward S2 ($1,912).
- Bullish Invalidation: Bulls must reclaim the $2,037 (Volume POC) and $2,090 levels to shift the market structure back to neutral.
⚠️ RISK WARNING & AI DISCLOSURE
- This information is generated by Artificial Intelligence (AI) and complex algorithms. While advanced, these systems can contain errors or inaccuracies and are for educational purposes only.
- Technical analysis provides no guarantees; this information is purely informative.
- All discussed scenarios are hypothetical and do not constitute predictions or expectations.
- Past performance is not an indicator of future results.
- This is not financial advice and is not intended as a call-to-action for the reader.
- No implicit direction is claimed, and no specific behavior of market participants is suggested.