

Bitcoin (BTC) is currently navigating a period of heightened volatility, trading around the $69,000 level following a significant corrective move. Market participants are closely monitoring the interplay between structural chart patterns and on-chain orderflow data to gauge the market’s next directional cue.
This analysis examines the current technical landscape, focusing on trend structure, momentum indicators, and market composition.
Trend Structure: The Broadening Formation
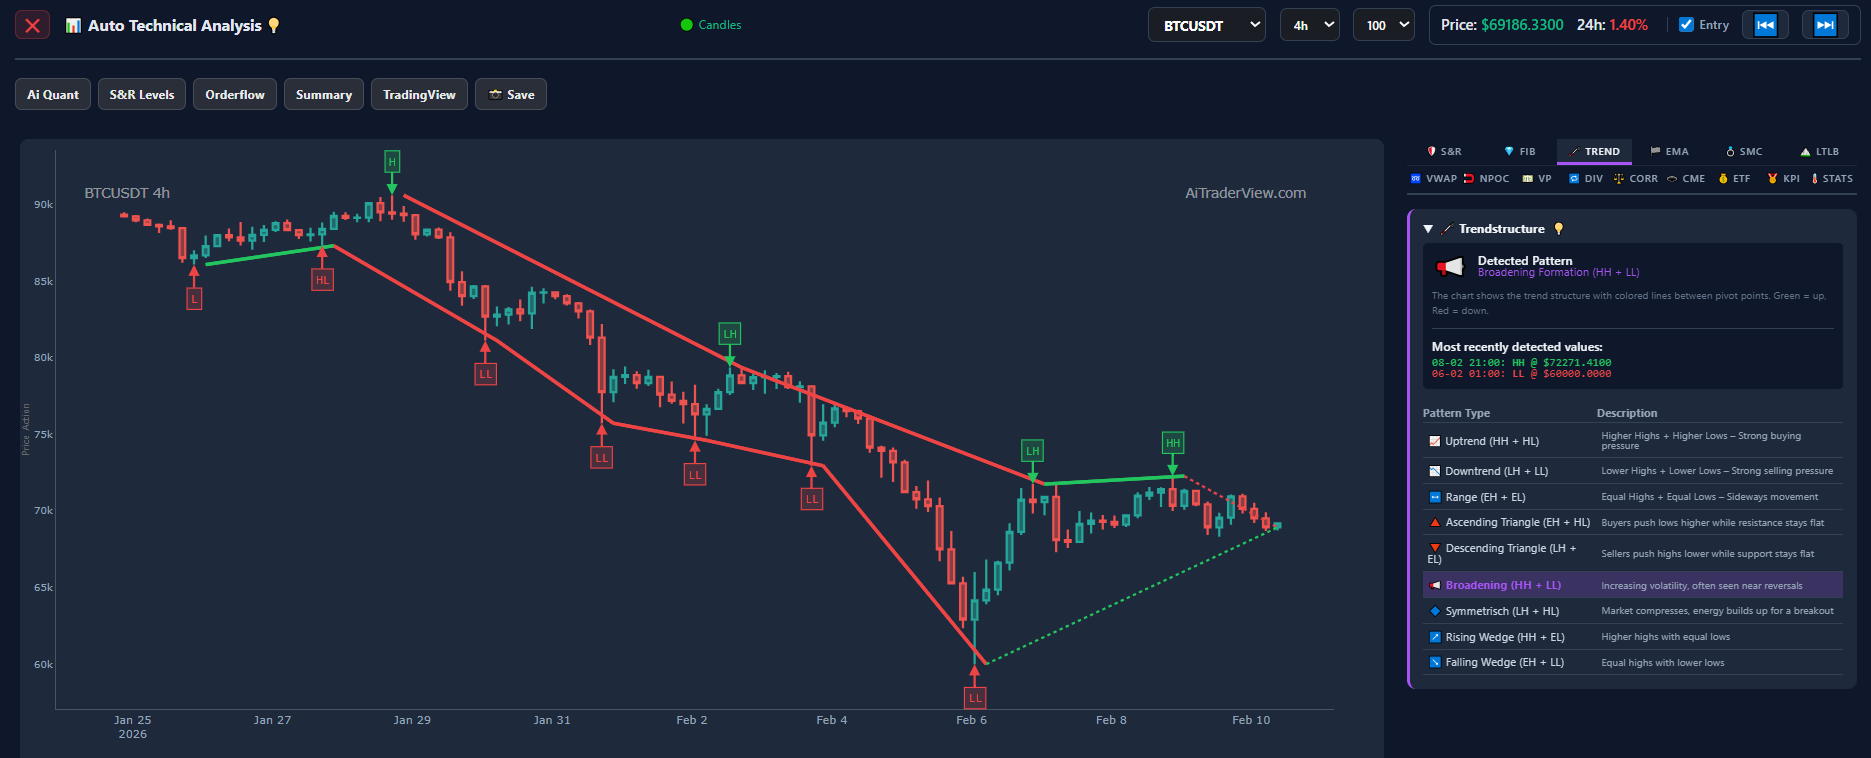
On the 4-hour timeframe, the market structure has evolved into a Broadening Formation. This pattern is defined by expanding price swings, creating a series of Higher Highs (HH) and Lower Lows (LL).
- Recent Pivots: Automated analysis identifies a recent local high at approximately $72,271 and a swing low near $60,000.
- Implications: Broadening formations are synonymous with increasing market disagreement and volatility. They often appear during transitional phases where neither bulls nor bears have established definitive control, leading to widening price ranges.
Momentum and Oscillator Analysis
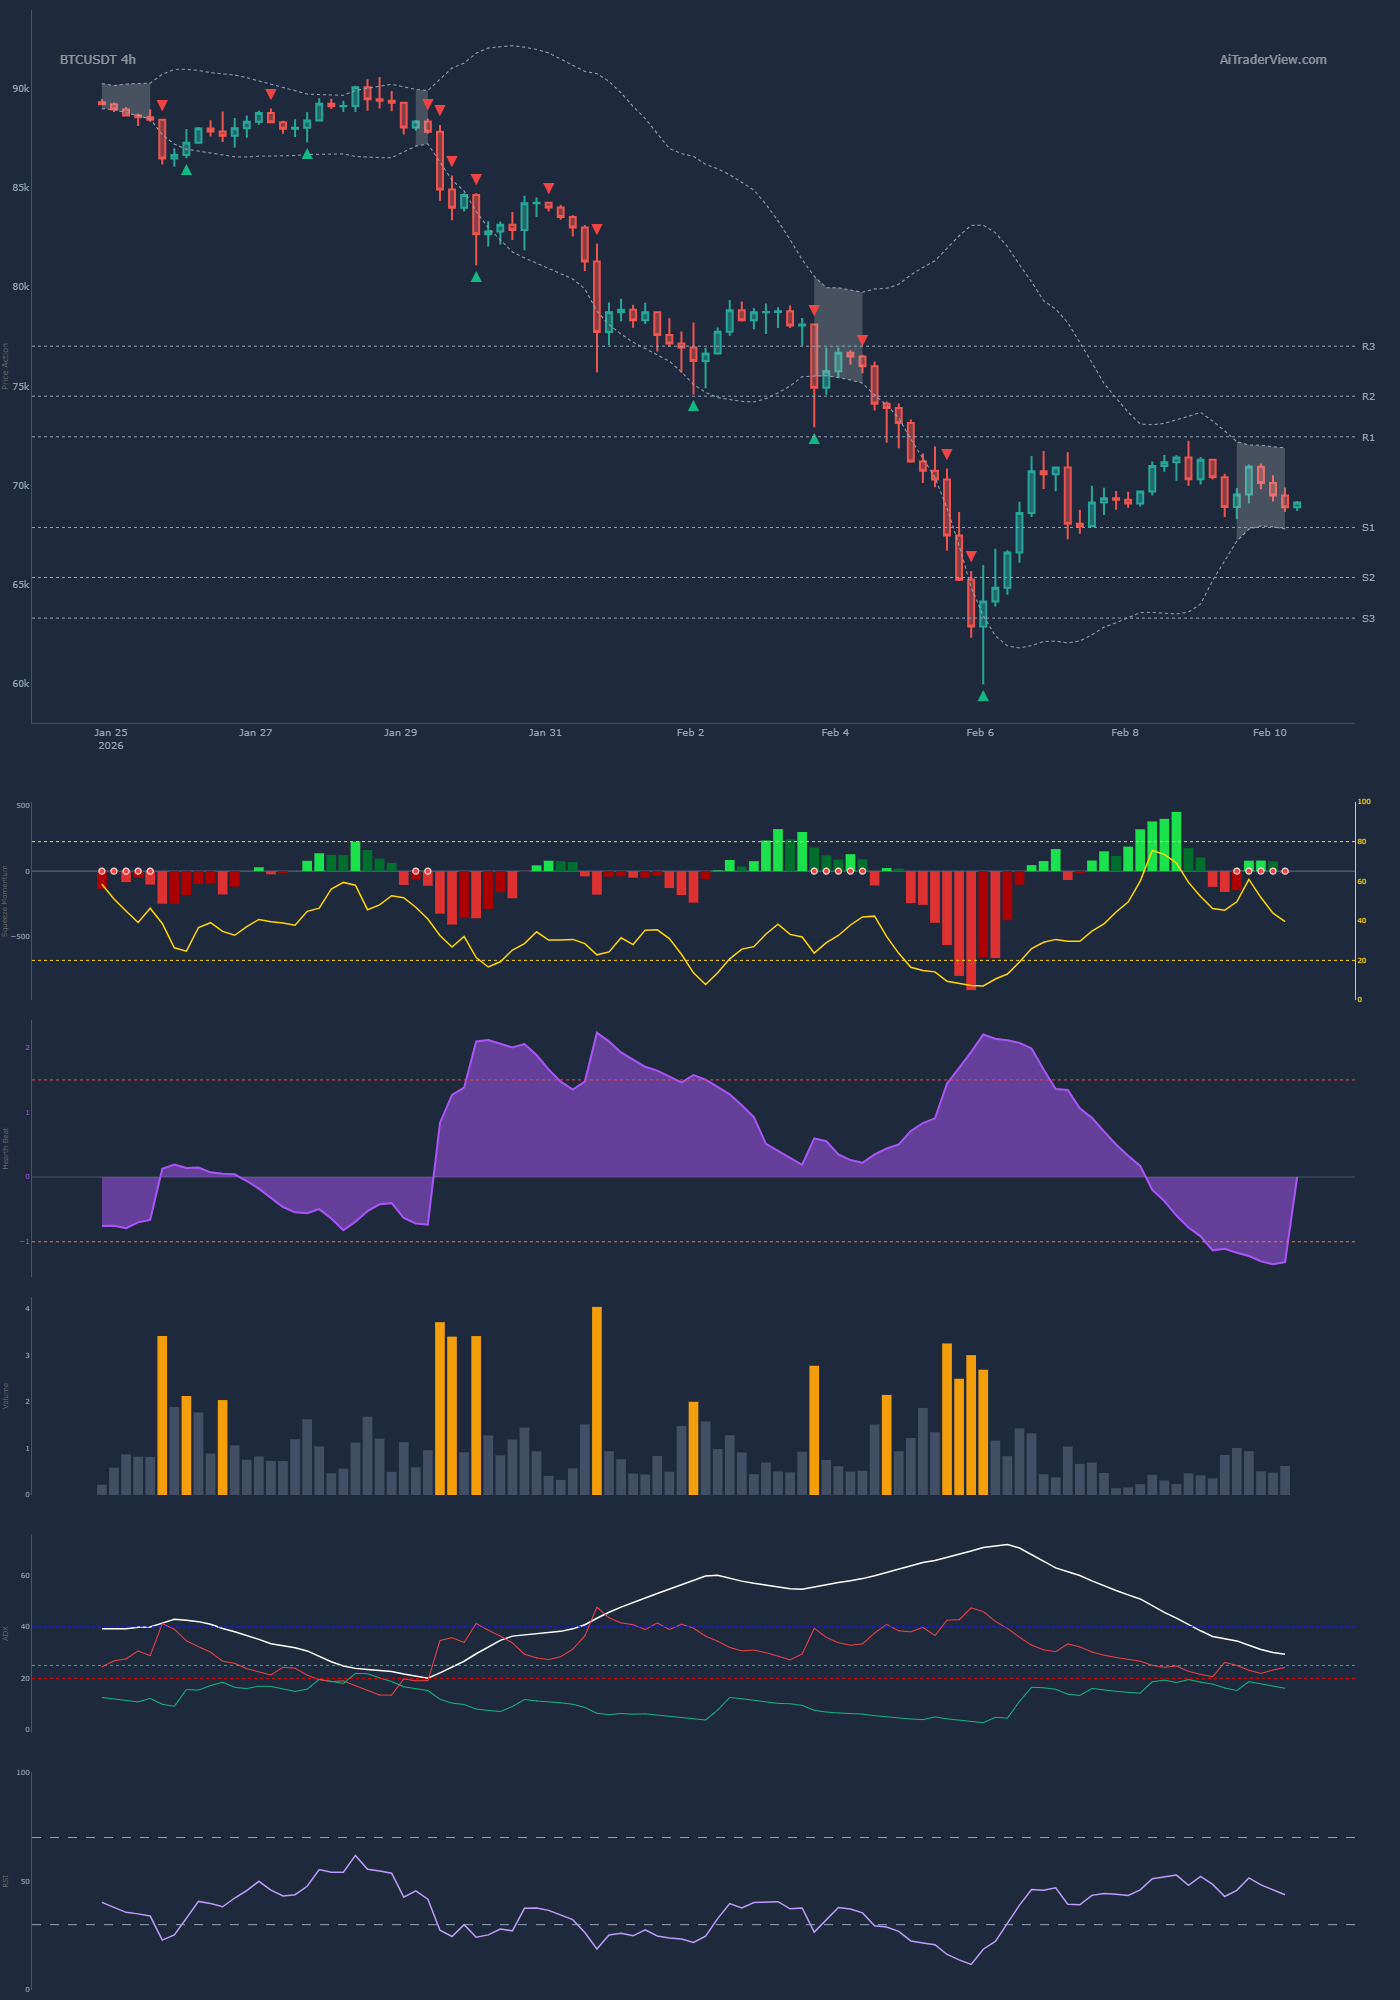
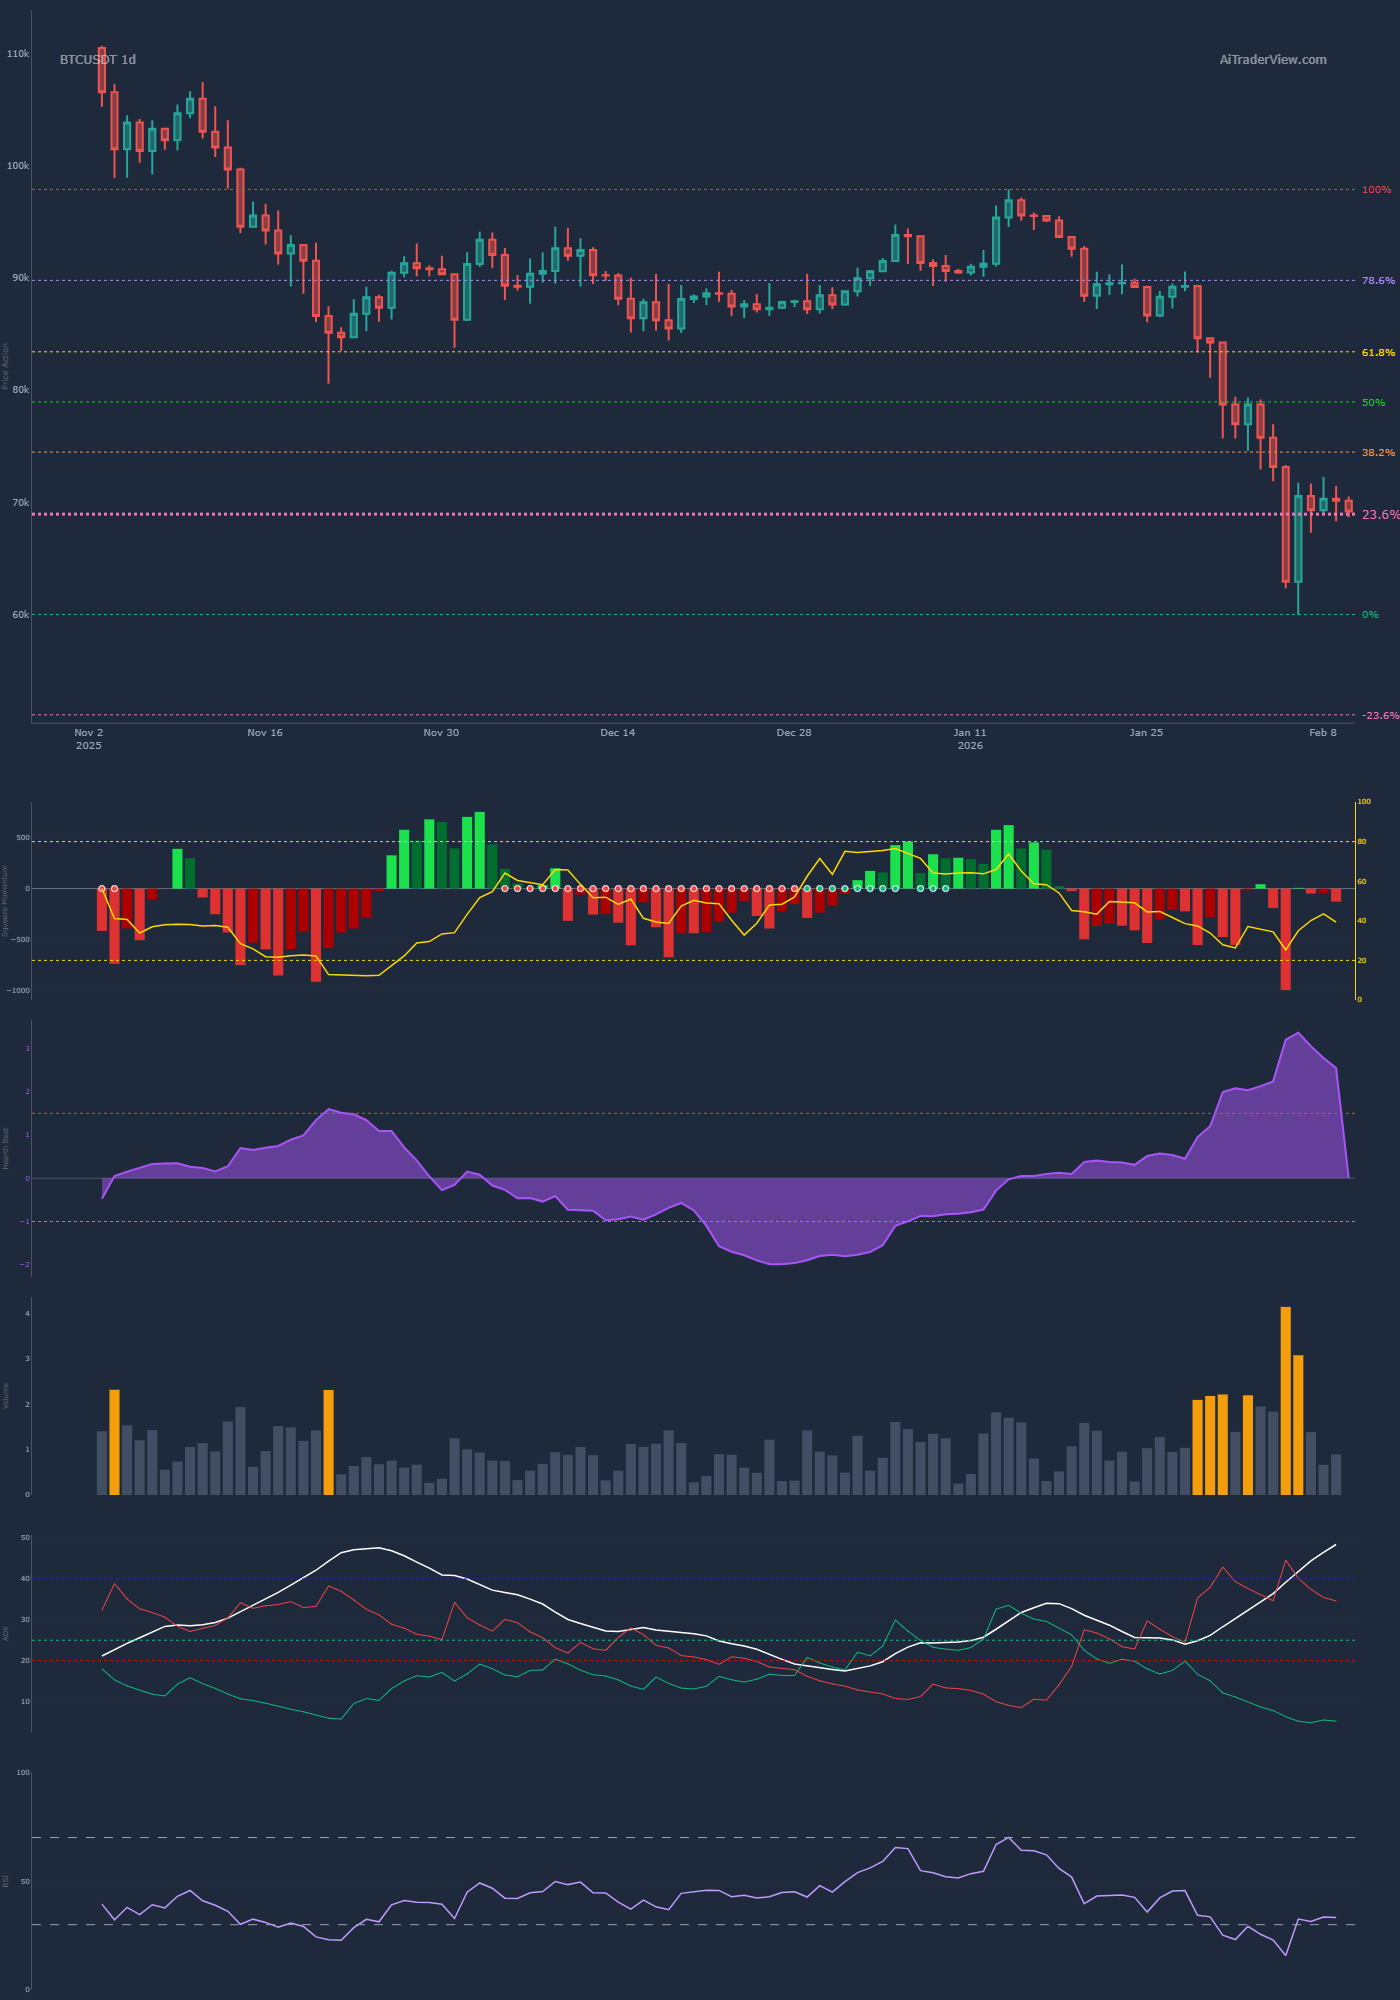
RSI and ADX
On the daily chart, the Relative Strength Index (RSI) is hovering near oversold territory. Historically, this zone attracts attention as traders look for signs of mean reversion or trend continuation. Meanwhile, the Average Directional Index (ADX) remains elevated. A high ADX reading typically signifies a strong prevailing trend—in this case, the recent downside momentum—though a plateauing ADX can sometimes precede a consolidation phase.
Squeeze Radar
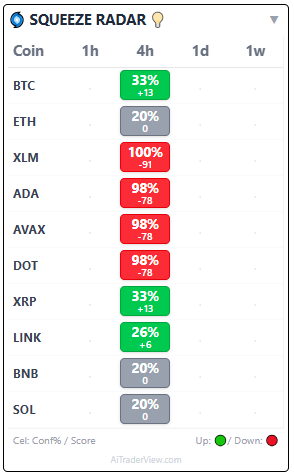
Short-term volatility metrics show divergence between Bitcoin and the altcoin market. The Squeeze Radar for the 4-hour timeframe highlights Bitcoin with a positive score (+13/33%), indicated in green. In contrast, major altcoins such as ADA, AVAX, and DOT show deep negative readings, suggesting that Bitcoin is currently decoupling from the broader altcoin weakness.
Orderflow and Volume Profile
Understanding the flow of orders provides context to the price action.
Volume Profile and POC
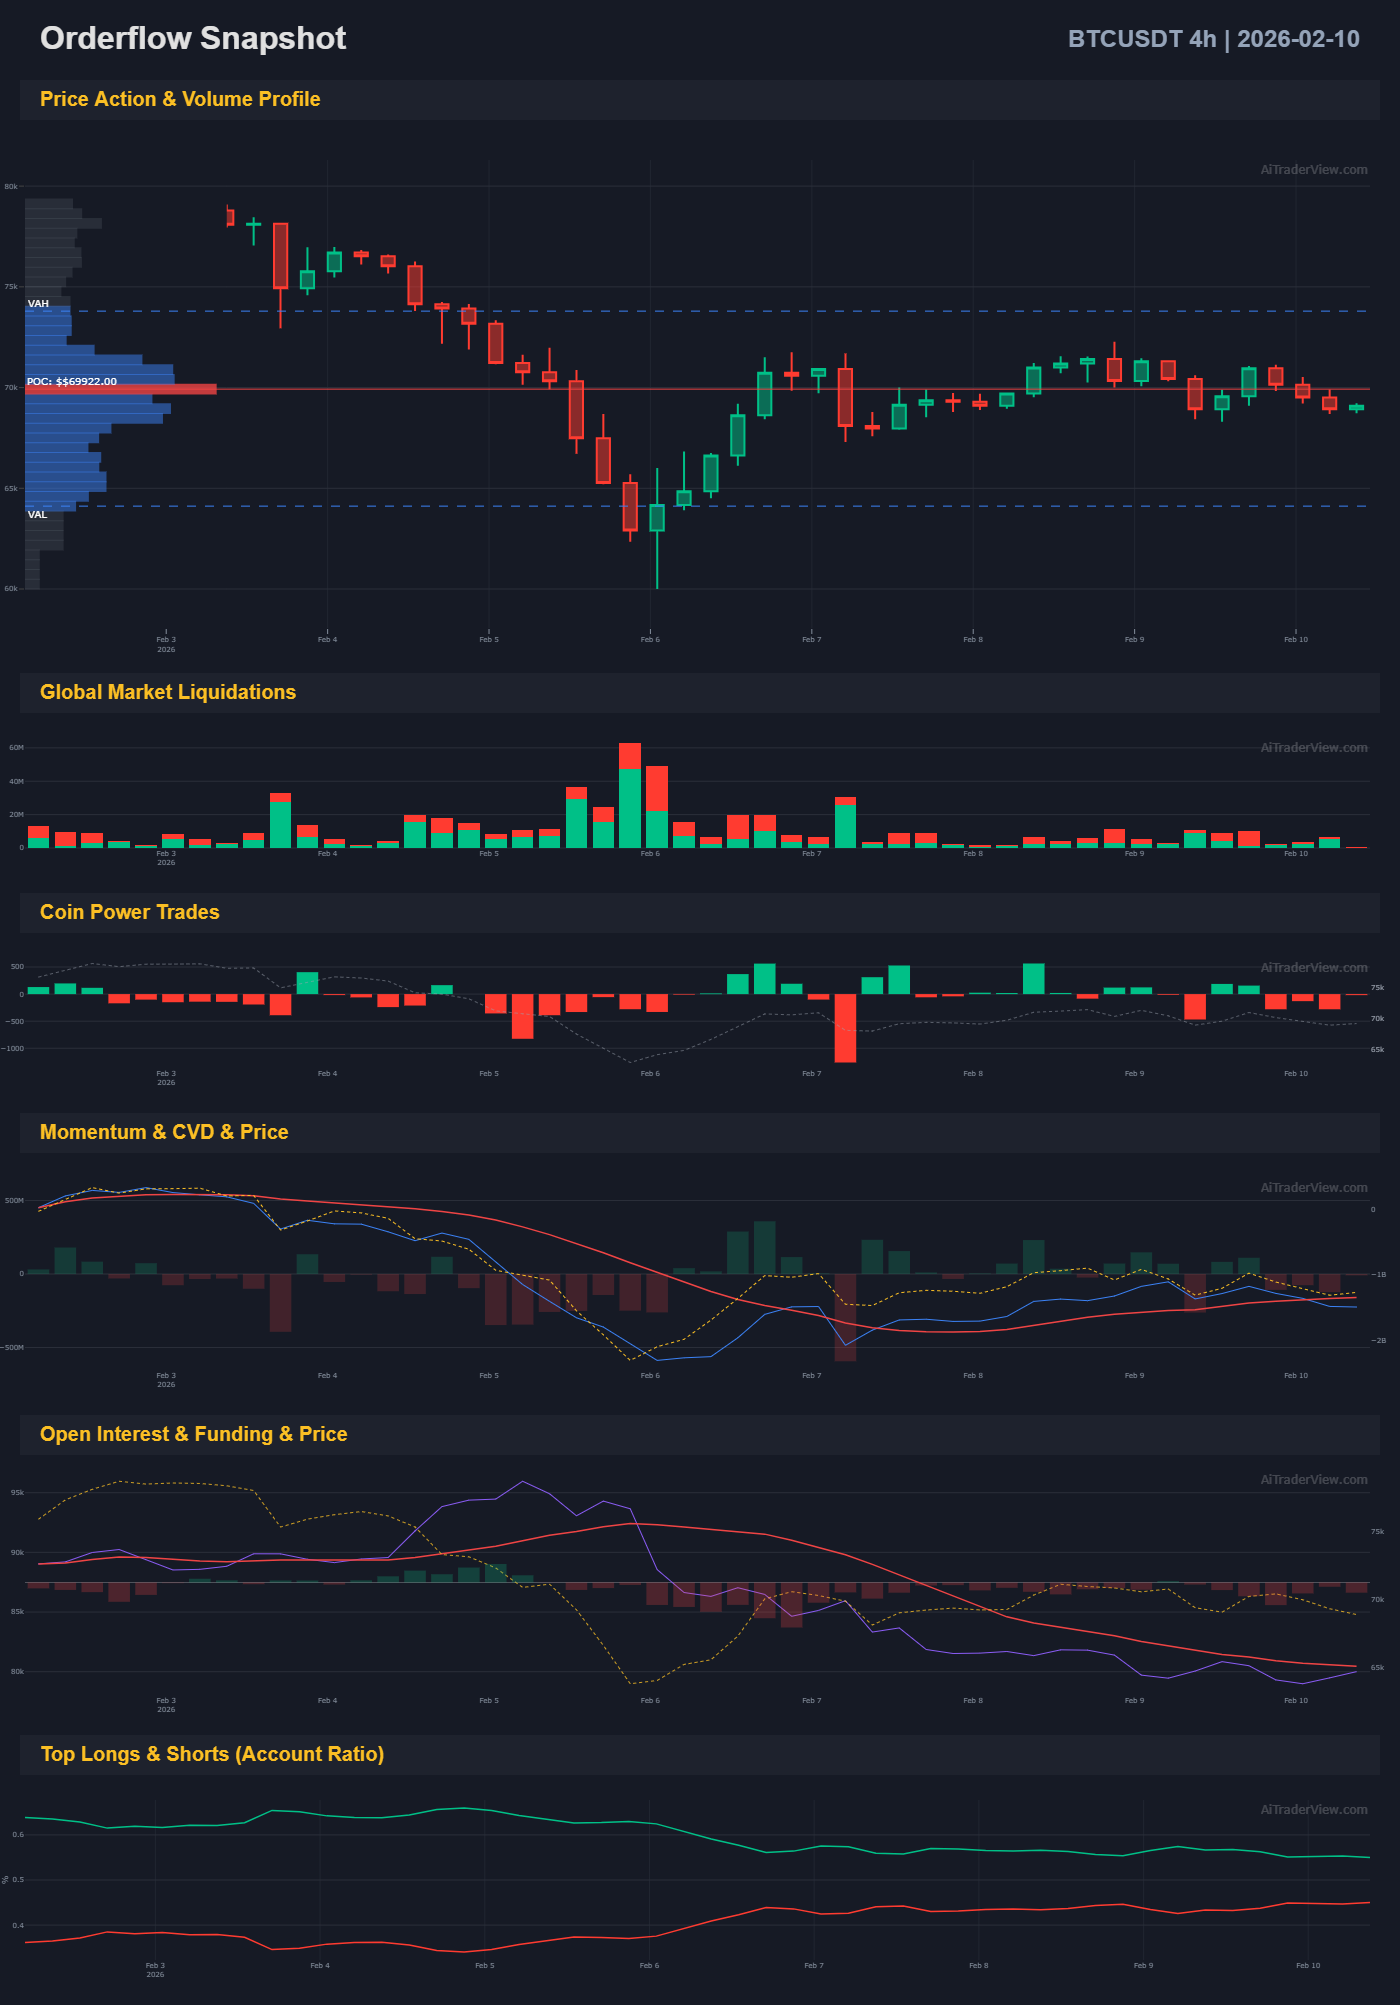
The Volume Profile reveals a dense cluster of trading activity around the current levels. The Point of Control (POC)—the price level with the highest traded volume—is situated near $69,922. This level currently acts as a magnet for price, serving as a critical zone for short-term negotiation.
Open Interest and Funding
Following the drop to $60,000, Open Interest (the total number of outstanding derivative contracts) saw a significant decline, indicating a “flush” of leveraged positions. It has since begun to stabilize. Funding rates have also largely reset, reflecting a more neutral leverage environment compared to the speculative froth seen at higher prices.
CVD and Power Trades
Cumulative Volume Delta (CVD) analysis shows the aggregate difference between buying and selling volume. The current CVD trend appears to be flattening, which, when juxtaposed with stabilizing price action, can indicate absorption of selling pressure. Additionally, Coin Power Trades highlight distinct blocks of buying and selling interest, with Liquidations on both the long and short sides contributing to the recent choppy price action.
Conclusion
Bitcoin is currently trading within a high-volatility Broadening Formation, anchored by a Volume Profile Point of Control near $69,900. While the daily trend remains weighed down by high ADX readings, short-term momentum indicators and the 4h Squeeze metrics suggest a pause in the immediate downward pressure. As Open Interest stabilizes, the market enters a phase of discovery within this expanding range.
⚠️ RISK WARNING & AI DISCLOSURE
- This information is generated by Artificial Intelligence (AI) and complex algorithms. While advanced, these systems can contain errors or inaccuracies and are for educational purposes only.
- Technical analysis provides no guarantees; this information is purely informative.
- All discussed scenarios are hypothetical and do not constitute predictions or expectations.
- Past performance is not an indicator of future results.
- This is not financial advice and is not intended as a call-to-action for the reader.
- No implicit direction is claimed, and no specific behavior of market participants is suggested.