
How to Read a Crypto Liquidation Heatmap (and How Traders Use It)
A crypto liquidation heatmap shows the price levels where leveraged positions are likely to be force-closed. Those levels matter because liquidations are forced market orders: when many of them are triggered at once, they can accelerate a move, create a sudden wick and sometimes mark the exact spot where a trend pauses or reverses. This guide explains what the colors mean, why price is often drawn toward bright clusters, and how to use them in practice, using a real ETH/USDT example from October 2026.
What Is a Liquidation Heatmap?
Traders who use leverage on futures exchanges post collateral (margin). If the price moves against them far enough, the exchange closes the position automatically. That closing price is the liquidation level.
Indicator Settings in Crypto Cockpit
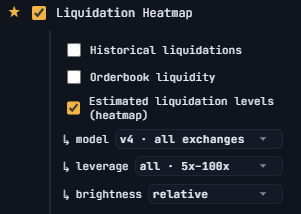
A liquidation heatmap estimates how many positions would be liquidated at each price level and draws the result as a heat scale next to the price axis. It is an estimate, not a list of real positions: the data is modeled from open interest, typical leverage tiers and where positions were likely opened.
How to Read the Colors
The vertical axis is price, the horizontal bars show how much leverage is estimated to sit at that level, and the color shows the intensity.
- Dark blue or purple: little estimated liquidation volume. Price can move through these zones easily.
- Green and teal: a moderate amount of leverage.
- Bright yellow: the densest clusters. These are the levels the market is most likely to react to.
Levels above the current price are mostly short positions that would be liquidated by a rally. Levels below are mostly long positions that would be liquidated by a drop. Many heatmaps, including the AiTraderView version, also add a liquidations bar chart under the price chart, so you can see when real liquidations actually happened.
Why Price Is Drawn Toward Liquidation Clusters
A cluster is a pool of liquidity. Large players need counterparties to fill big orders, and forced liquidations provide exactly that: a stack of market orders at a predictable price. Price often travels to these zones, triggers the liquidations, and then either stalls or reverses once the forced orders are absorbed.
That is why a heatmap is best used as a map of likely reaction zones, not as a forecast. A cluster tells you where something may happen. It does not tell you which way price goes afterwards.
Real Example: ETH/USDT, October 2026
The two charts below are ETH/USDT on the 4-hour timeframe with the liquidation heatmap and the liquidations bars on the Crypto Cockpit.
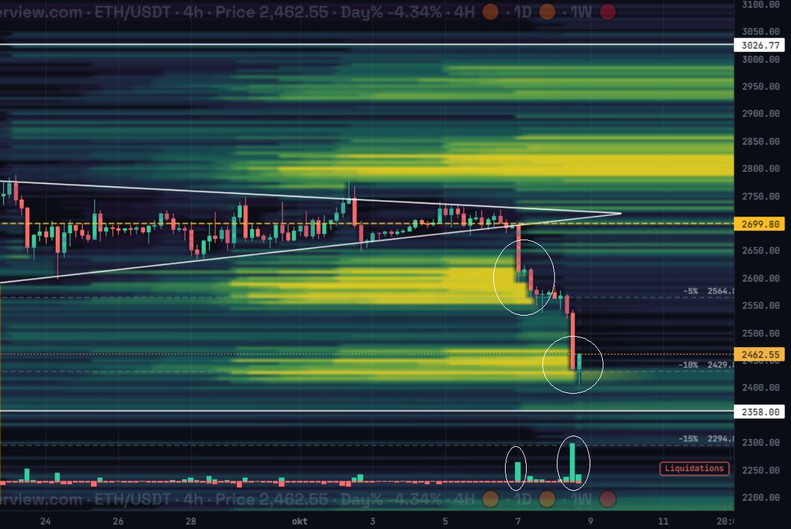
Caption: ETH/USDT, 4h, on October 8. Price breaks out of a symmetrical triangle and drops into the bright liquidation clusters below.
Step 1: The setup. For days ETH traded in a tightening triangle around $2,700. The heatmap already showed two bright yellow clusters below price, one around $2,560 to $2,620 and another around $2,430 to $2,480. A third large cluster sat above price near $2,800.
Step 2: The breakdown. On October 7 price lost the lower triangle line near $2,700 and fell into the first cluster. The first circled area on the chart shows the candles running into the $2,600 zone, and the liquidations bar below it shows a clear spike as long positions were closed.
Step 3: The second cluster. After a short pause price continued down into the next yellow band around $2,430 to $2,480. The second circled area shows the largest liquidations bar of the move. The wick printed a low near $2,410 and price bounced straight away. The dashed levels at -5%, -10% and -15% from the earlier price helped to measure how far the move had gone.
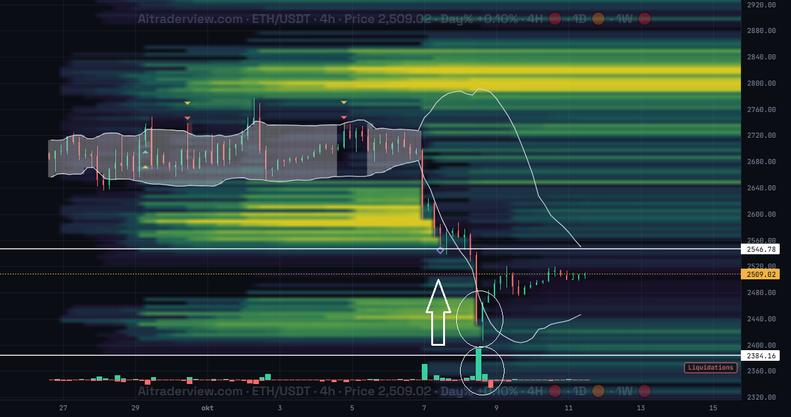
Caption: The same area a few days later (October 11). After the sweep of the lower cluster, ETH recovered to about $2,510.
Step 4: The reaction. The later chart shows what happened next. Once the lower cluster had been swept and the liquidation spike was over, selling pressure faded and ETH recovered to around $2,510. The arrow marks that bounce. The large cluster above, around $2,800, is still bright, so it remains a level to watch if the recovery continues.
The lesson is not that every cluster produces a bounce. It is that the heatmap told traders in advance where the highest density of forced orders sat, and the liquidations bars confirmed when those orders were actually executed.
How Traders Use a Liquidation Heatmap
Finding likely targets. In a trending move, the nearest bright cluster in the direction of the trend is a natural target. Traders use it to place take-profit levels or to decide where not to expect a quick extension.
Spotting possible reversals. When price reaches a big cluster and the liquidations bar spikes, the forced selling (or buying) may be exhausted. If price then stops making new lows or highs, that can be an early reversal signal. Confirmation from price action matters here, such as a reclaim of a level or a strong reaction candle.
Setting smarter stops. Stops placed just beyond a bright cluster are more likely to be swept. Placing them with enough room, or waiting for the sweep to finish, can help you avoid being taken out by a wick.
Combining it with other data. A heatmap becomes more reliable with context: open interest (is leverage building or being flushed?), funding rate (which side is crowded?), cumulative volume delta and key support or resistance levels. When a cluster lines up with another level, it deserves more attention.
Common Mistakes
- Treating the heatmap as a prediction. Clusters are not guaranteed to be hit. Price can reverse before it gets there.
- Trading every cluster. The brightest bands on the higher timeframes matter more than small ones on a 15-minute chart.
- Ignoring the trend. In a strong trend price can run through several clusters in a row.
- Forgetting that it is an estimate. Different tools use different models, so the exact levels can differ slightly between platforms.
- No risk management. A cluster is not a reason to skip a stop-loss or to over-leverage yourself.
Frequently Asked Questions
What does a liquidation heatmap show?
It shows the price levels where leveraged long and short positions are estimated to be liquidated, with brighter colors meaning more estimated liquidation volume.
Do liquidation clusters always get hit?
No. They act as magnets and reaction zones, but price can turn before reaching them or ignore them completely.
What is the difference between a liquidation heatmap and the liquidations bars?
The heatmap estimates where liquidations could happen in the future. The bars show the liquidations that actually took place in each period.
Can I use a liquidation heatmap on any timeframe?
Yes, but the signal is usually stronger on the 4-hour, daily and weekly timeframes than on very short ones.
Is a liquidation heatmap enough to trade on its own?
No. Use it as one input next to price action, open interest, funding and volume, and always manage your risk.
Try It Yourself
You can view the liquidation heatmap for Bitcoin and Ethereum next to 75+ free indicators in the AiTraderView Crypto Cockpit: Open the Crypto Cockpit.
This article is for educational purposes only and is not financial advice. Trading leveraged crypto products involves a high risk of loss.
⚠️ RISK WARNING & AI DISCLOSURE
- This information is generated by Artificial Intelligence (AI) and complex algorithms. While advanced, these systems can contain errors or inaccuracies and are for educational purposes only.
- Technical analysis provides no guarantees; this information is purely informative.
- All discussed scenarios are hypothetical and do not constitute predictions or expectations.
- Past performance is not an indicator of future results.
- This is not financial advice and is not intended as a call-to-action for the reader.
- No implicit direction is claimed, and no specific behavior of market participants is suggested.