
Here is my objective, data-driven market analysis of the provided BTC/USDT charts in English. As a senior analyst, I base these conclusions solely on the visible orderflow, market structure, and volume profiling.
Technical Analysis & Observations
1. Orderflow, Volume Profile & CVD (1D Chart)
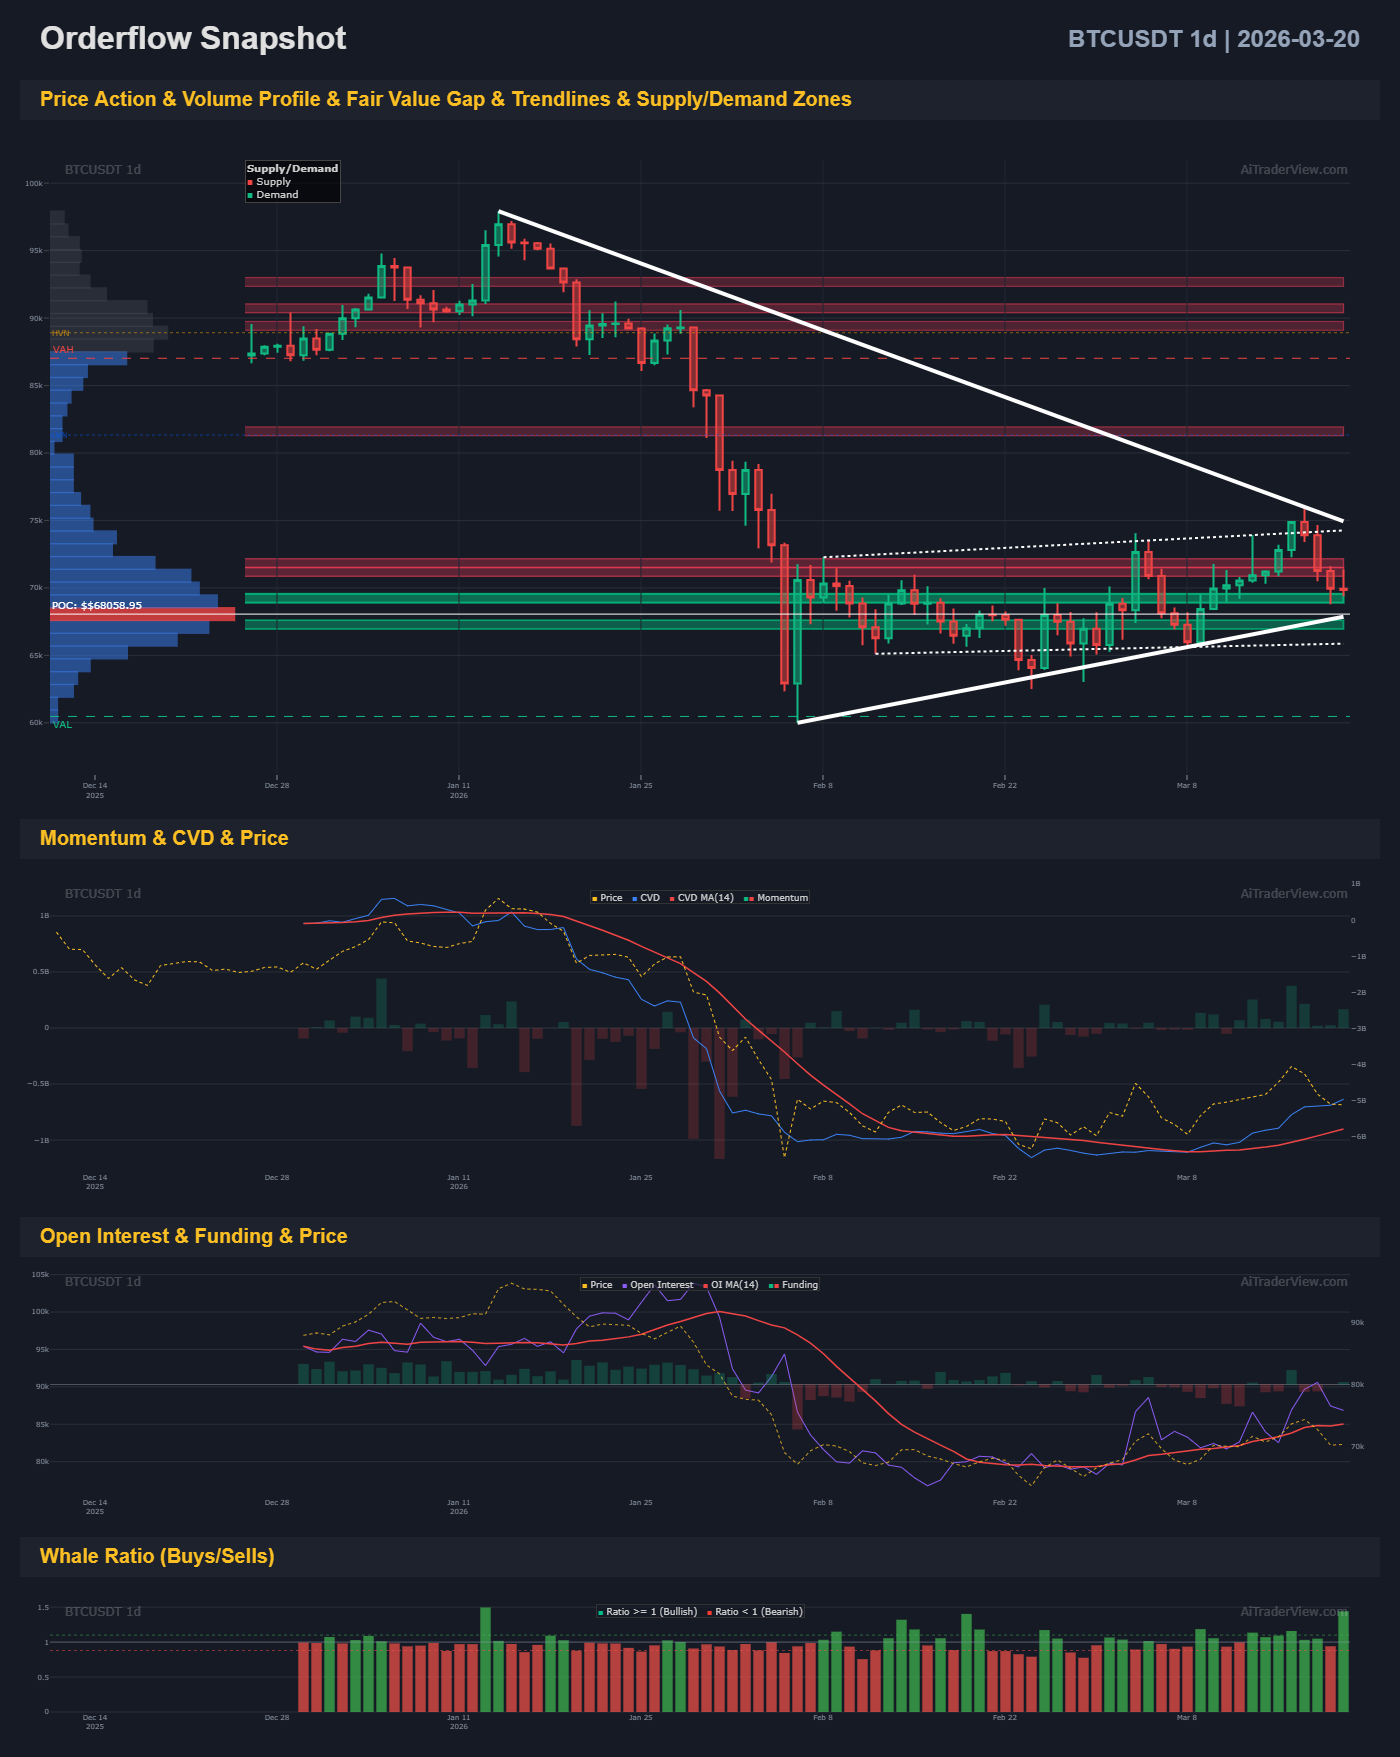
The price has experienced a significant correction within a descending channel but recently bounced off a strong Demand Zone and the Point of Control (POC) around the $65k-$66k level. This is an area of high historical liquidity where buyers have stepped in.
- CVD & Momentum: Cumulative Volume Delta (CVD) dropped deeply into the red, and momentum is weak. This points to aggressive market selling over the measured period.
- Power Trades: Following a period of heavy selling pressure (large red spikes), we see small green spikes (Power Buy) in both the Coin and Global Market Power Trades over recent days. This suggests that the heavy selling pressure is waning and passive buyers are absorbing the supply.
- Open Interest & Funding: Open Interest (OI) had a massive flush and is now flattening out. Funding rates appear to be stabilizing toward the baseline. There is currently no extreme over-leverage on either side.
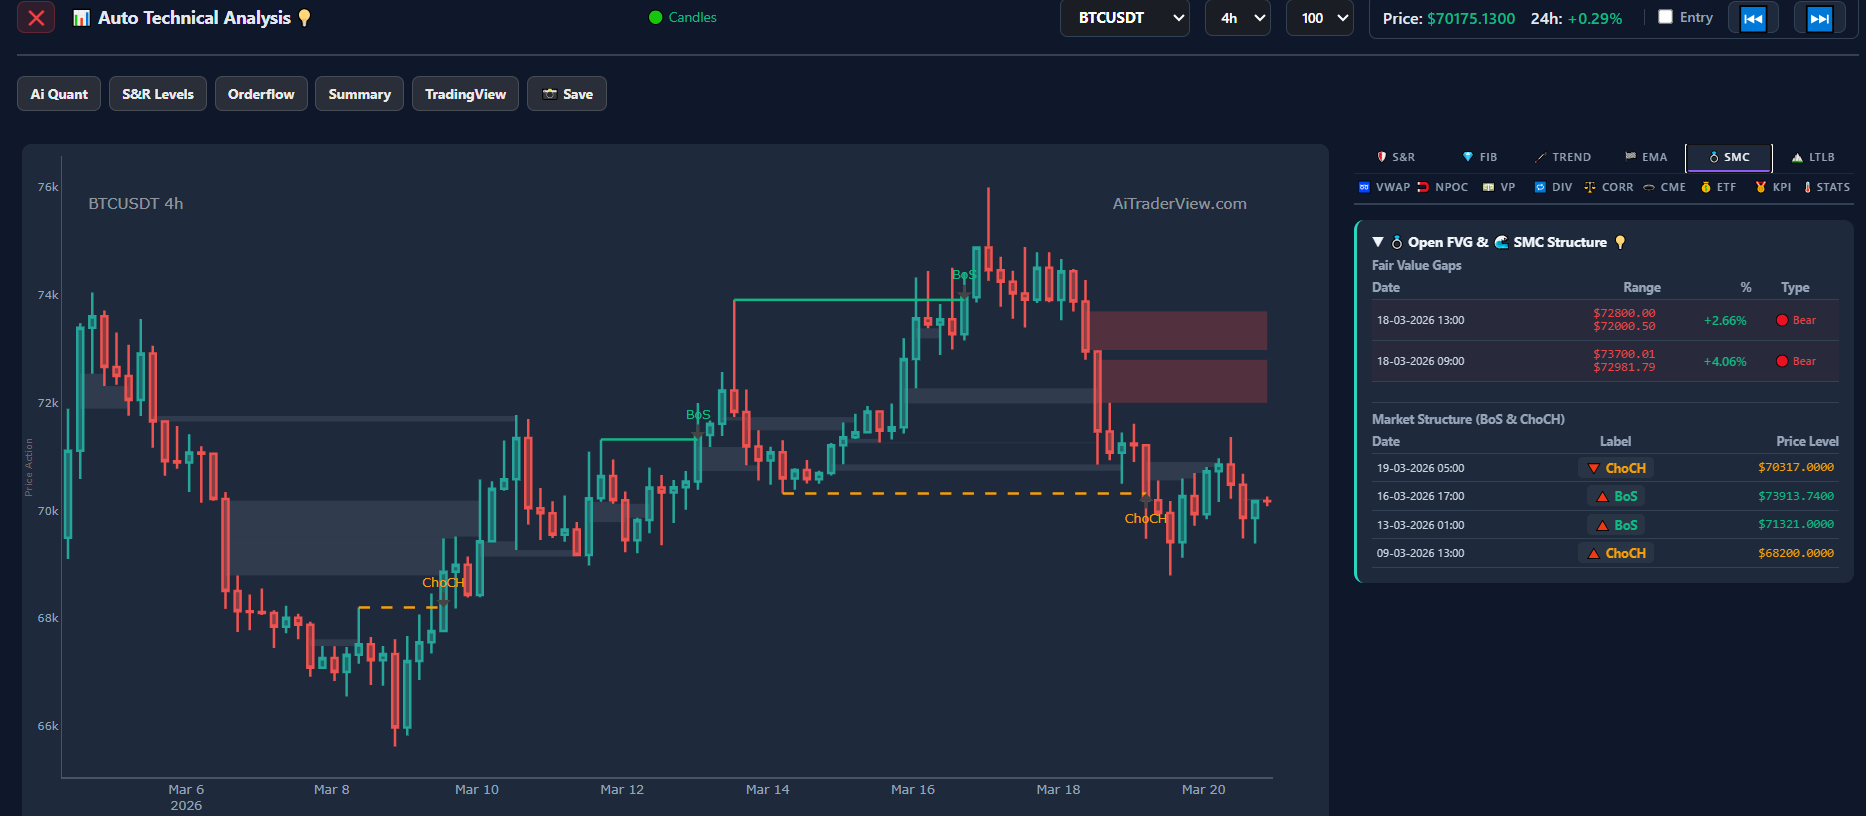
2. Smart Money Concepts (SMC) & Trend (4H & 1D Charts)
The short-term structure is currently bearish, while the daily structure provides mixed signals.
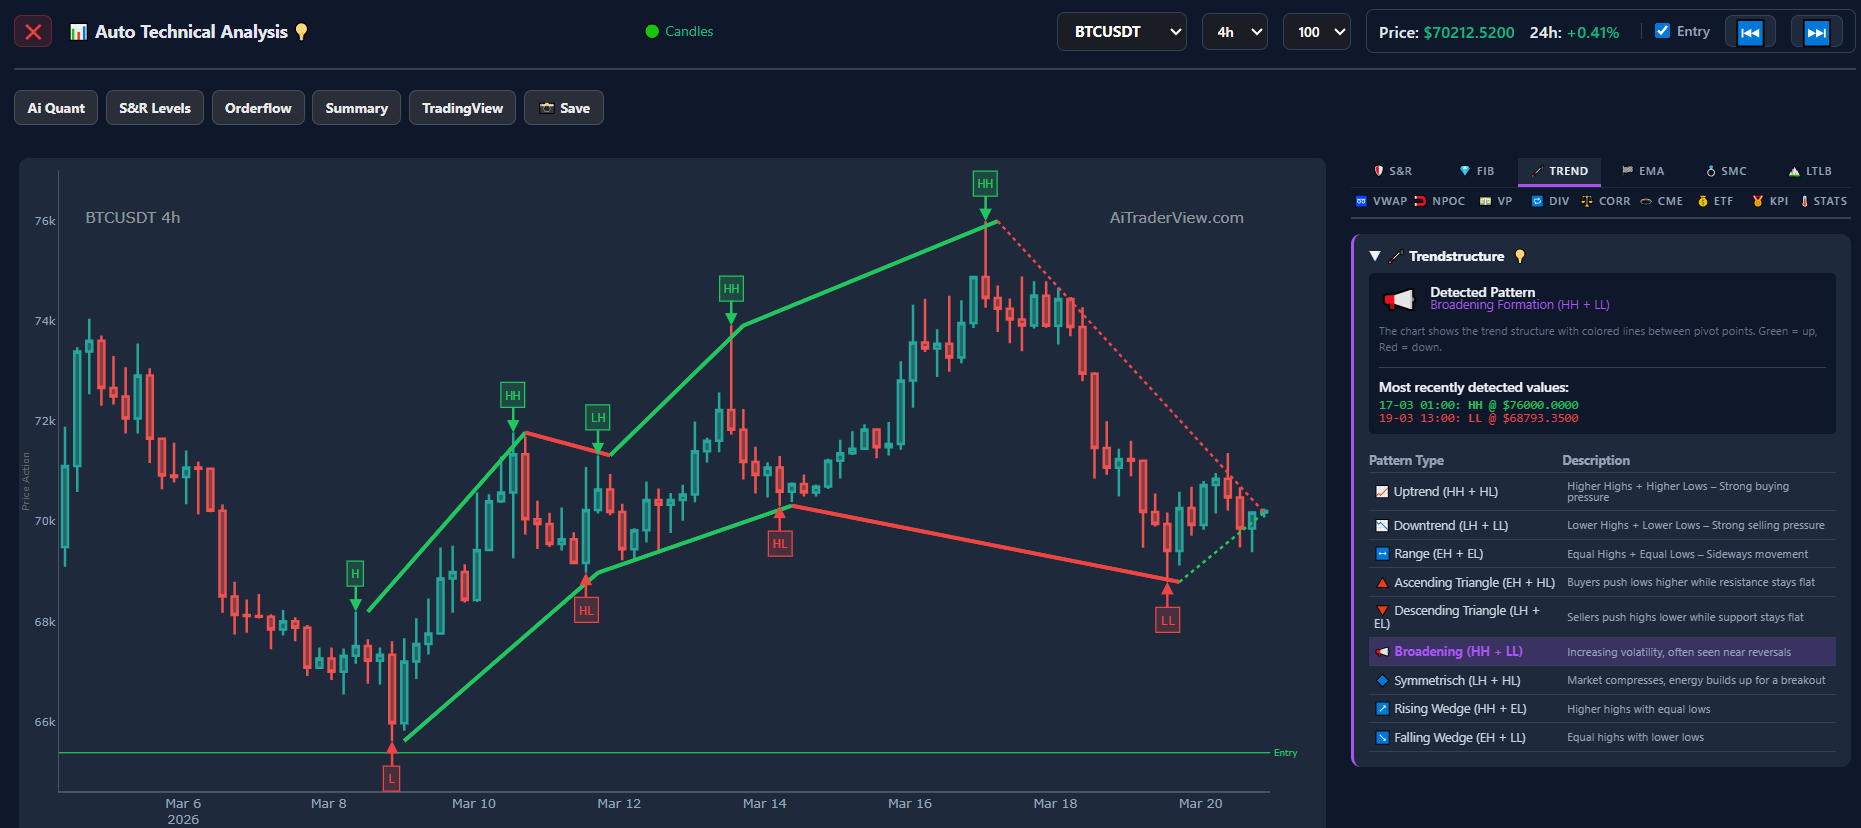
- SMC (4H): We observe a clear Bearish Change of Character (ChoCH) at $70,317. Above the current price, there are two unfilled Bearish Fair Value Gaps (FVGs) in the $72,000-$72,800 and $72,981-$73,700 zones. These zones will act as heavy resistance (supply) on any upward move.
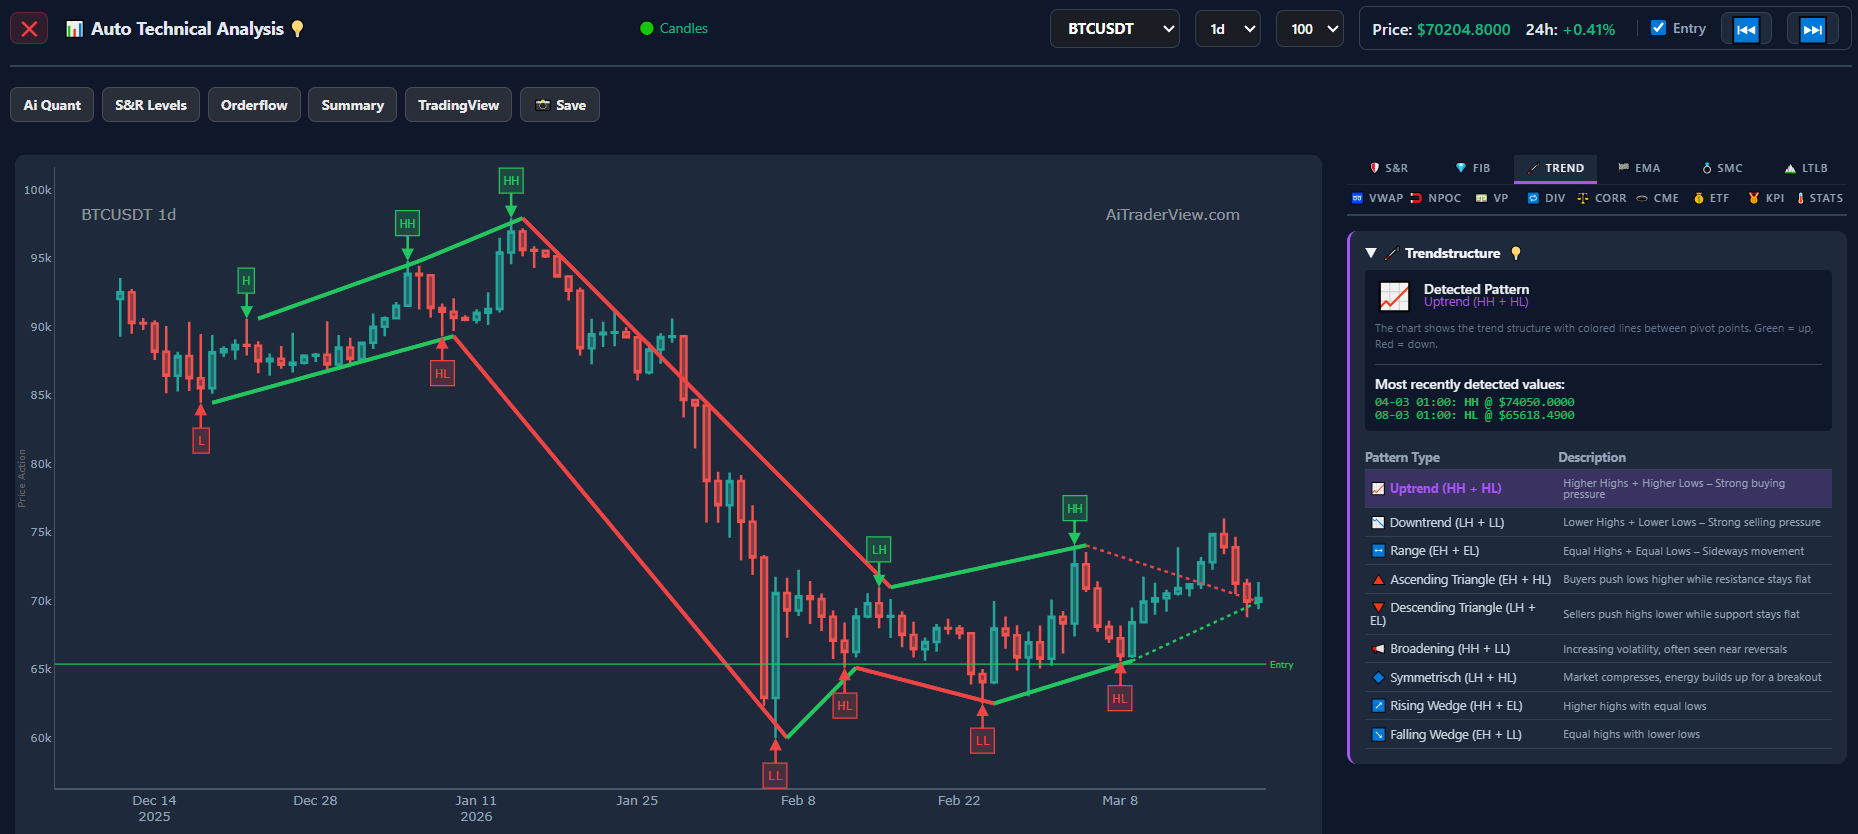
- Trend: The 4H chart shows a Broadening Formation (HH + LL), which indicates increasing volatility and indecision (often seen near reversals). Conversely, the 1D Trend indicator is more constructive, detecting an Uptrend (HH + HL), pointing to underlying buying pressure on a higher timeframe.
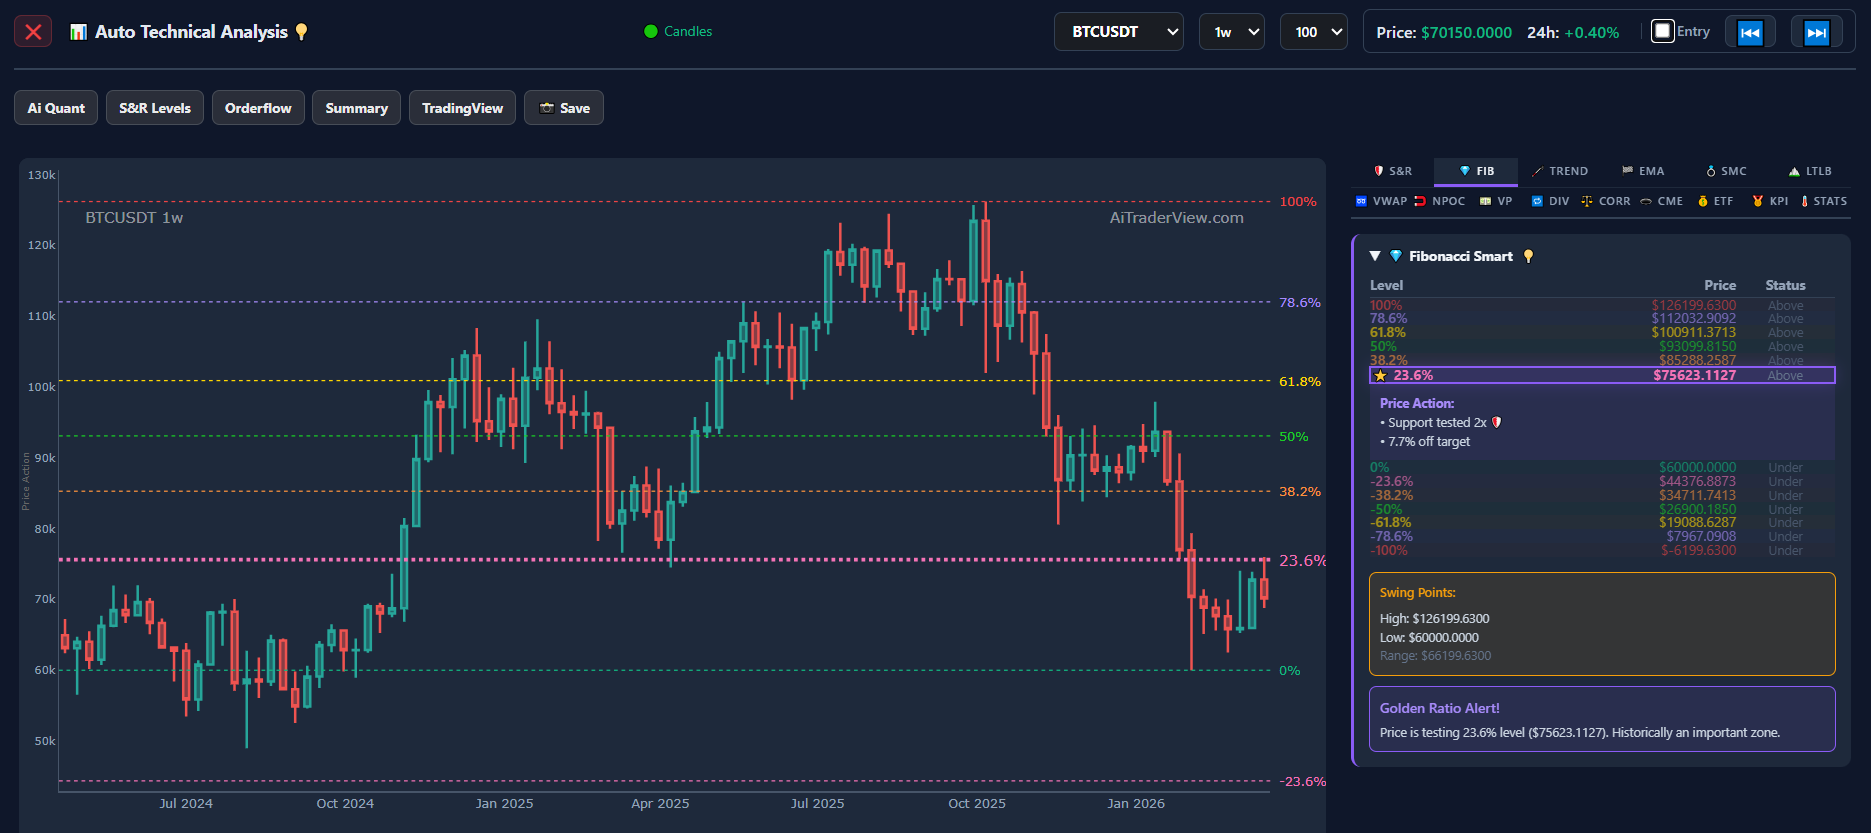
3. Moving Averages (EMA) & Fibonacci (1W Charts)
On a macro level, the trend has severely weakened.
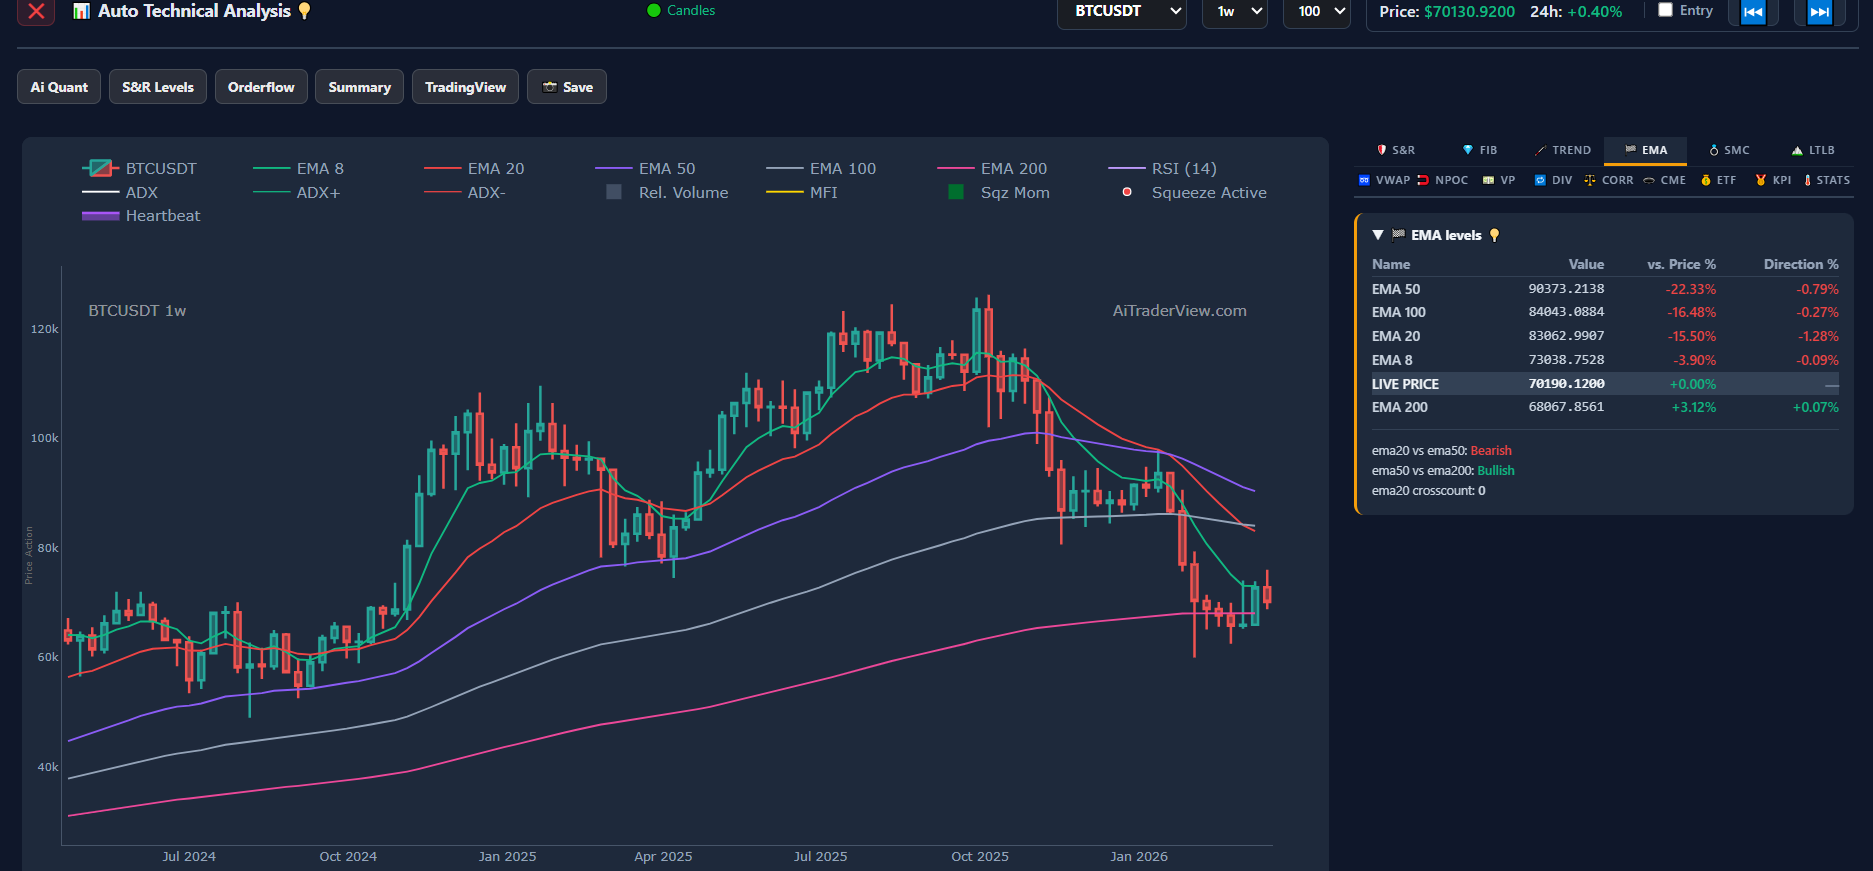
- EMAs: Price is trading below the short and mid-term EMAs (8, 20, 50, 100). The status indicator explicitly states that the EMA 20 vs EMA 50 cross is bearish. The price is currently only being supported by the long-term EMA 200 ($68,067).
- Fibonacci: In the swing from the top ($126,199) to the bottom ($60,000), the price is sitting in the lowest quartile. The critical 23.6% retracement level at $75,623 is currently acting as strong resistance (price is ‘Under’ the higher levels and stalling).
Data-Driven Point System
Based on your rules, I objectively score the categories as Bullish (1), Bearish (1), or Neutral (0).
| Component | Bullish | Bearish | Neutral | Justification |
| 1. Price & volume profile & FVG | 0 | 0 | 1 | Price bounce from 1D POC (bullish), but 4H has open bearish FVGs (bearish). They cancel out. |
| 2. Liquidations (Coin & Global) | 0 | 0 | 1 | No explicit liquidation chart is visible showing an extreme tilt. |
| 3. Power trades (Coin & Global) | 1 | 0 | 0 | Visible shift from large red (sell) spikes to recent green (buy) spikes. |
| 4. Supply & demand zones | 1 | 0 | 0 | Price successfully bounced from the green 1D Demand Zone. |
| 5. CVD & momentum | 0 | 1 | 0 | CVD is trending down and momentum is below the zero line. |
| 6. Open interest & funding | 0 | 0 | 1 | OI flushed and is now neutral/flat. No clear directional bias left. |
| 7. Trend | 1 | 0 | 0 | The 1D indicator explicitly detects an “Uptrend (HH + HL) – Strong buying pressure”. |
| 8. EMA | 0 | 1 | 0 | Price is trading below EMA 8, 20, 50, 100, and the EMA 20/50 cross is bearish. |
| 9. Fibonacci | 0 | 1 | 0 | Price is currently below the critical 23.6% level ($75k). |
| 10. SMC | 0 | 1 | 0 | Recent bearish ChoCH on the 4H with lower highs. |
| Total | 3 | 4 | 3 |
Final Conclusion & Calculation
There are a total of 7 data points with a clear directional bias out of the 10 categories.
- Bullish %: 3 ÷ 7 = 42.8%
- Bearish %: 4 ÷ 7 = 57.2%
Trader’s Verdict: The market is currently slightly Bearish (57.2%). While we are under heavy macro pressure (1W) below the EMAs and Fibonacci resistance, and the 4H market structure has recently broken bearish (ChoCH), we are seeing the first signs of bottoming on the 1D chart. The price has swept liquidity at the POC and Demand Zone, with early buyers (Power Trades) stepping in.
Action Plan: This is a classic ‘no-trade zone’ for swing traders. A confirmed long-term entry requires the price to reclaim the 4H FVGs ($72.8k) and the 23.6% Fib ($75.6k). Conversely, a short setup is risky here given the recent bounce off macro demand and the POC.
⚠️ RISK WARNING & AI DISCLOSURE
- This information is generated by Artificial Intelligence (AI) and complex algorithms. While advanced, these systems can contain errors or inaccuracies and are for educational purposes only.
- Technical analysis provides no guarantees; this information is purely informative.
- All discussed scenarios are hypothetical and do not constitute predictions or expectations.
- Past performance is not an indicator of future results.
- This is not financial advice and is not intended as a call-to-action for the reader.
- No implicit direction is claimed, and no specific behavior of market participants is suggested.