
Macro Overview & Market Structure
Here is my objective, data-driven technical analysis based on the provided order flow, momentum, and price action data for BTCUSDT on the 1D chart.
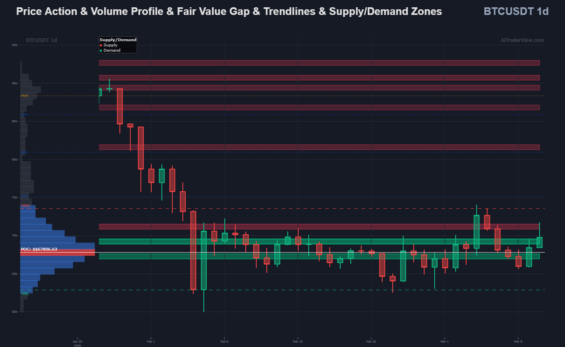
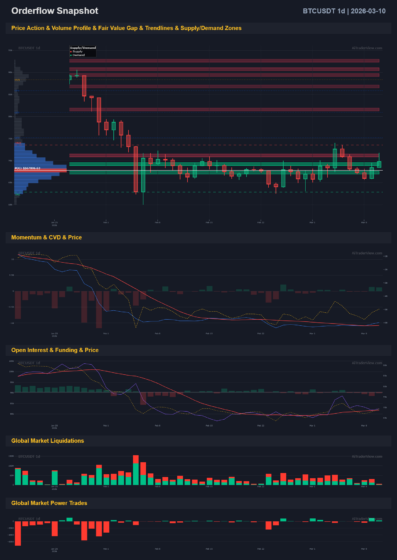
We are looking at a market that has recently gone through a significant distribution phase. From the peaks around $95k, there has been an aggressive sell-off, characterized by strong selling pressure and the liquidation of long positions. Currently, the price is in a consolidation phase around $67.8k, right at the daily Point of Control (POC). The overall market structure (SMC) is bearish with a clear series of Lower Highs (LH) and Lower Lows (LL).
Order Flow & Liquidity
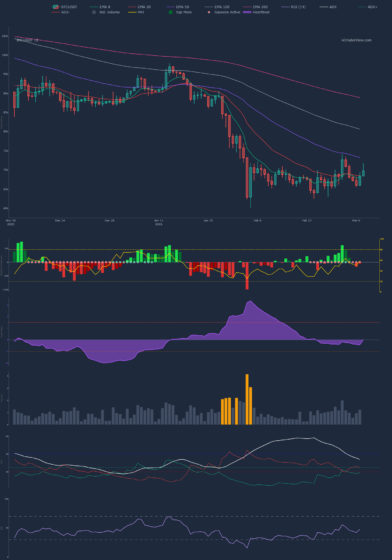
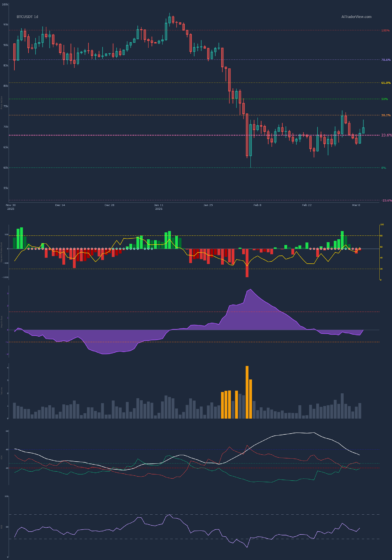
The order flow shows that sellers are still dominating the market. The Cumulative Volume Delta (CVD) prints a tight downward trend, indicating sustained aggressive market selling. This is confirmed by the negative Power Trades, where we only see heavy red (sell) spikes.
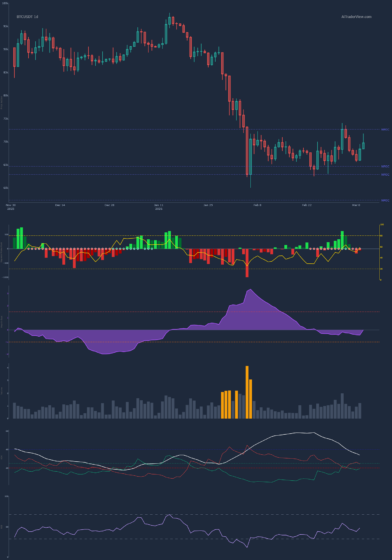
On the positive side, the large cascading long liquidations seem to have paused for now. Open Interest (OI) has been heavily flushed and is now consolidating, meaning the market is ‘clean’. Price is currently reacting to a local demand zone but immediately faces the 23.6% Fibonacci retracement as heavy resistance.
Data-Driven Point System (Scorecard)
Below is the objective assessment of the 12 criteria. I assign 1 point to Bullish, 1 point to Bearish, or 0 points if the data is Mixed/Neutral.
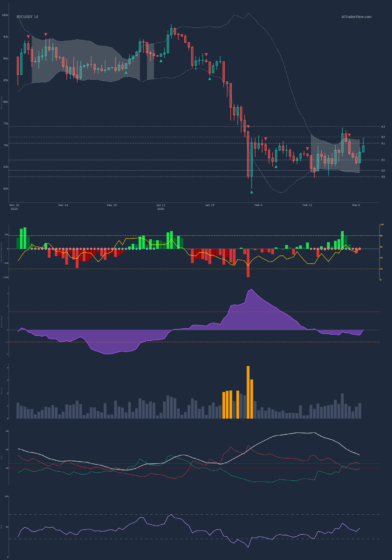
- 1. Price, Volume Profile & FVG: 0 (Mixed) Price is balancing exactly on the highest volume node (POC around $67.8k) within the Value Area. There is no clear rejection or breakout visible.
- 2. Liquidations (Coin & Global): 1 (Bullish) The massive cascade of long liquidations (red bars) has subsided. Such capitulation often marks a local bottom.
- 3. Power Trades (Coin & Global): 1 (Bearish) There is a significant dominance of aggressive sell-power trades. Large players are selling into the market.
- 4. Supply & Demand Zones: 1 (Bullish) Price has halted its descent and is currently consolidating within a green demand zone, showing buyer interest at this level.
- 5. CVD & Momentum: 1 (Bearish) The CVD line shows a sustained and unbroken downward trend. Momentum (RSI below 50, ADX bearish divergence) supports the sellers.
- 6. Open Interest & Funding: 1 (Bullish) Open Interest was flushed after the drop, resetting the market. This reduces the chance of another immediate long squeeze and opens the door for a corrective bounce.
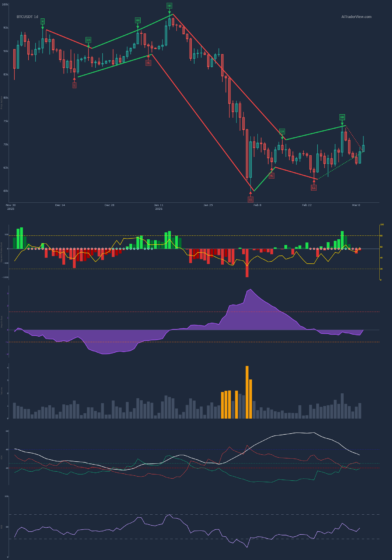
- 7. Trend: 1 (Bearish) The macro trend is clear: we see a formation of Lower Highs and Lower Lows on the daily chart.
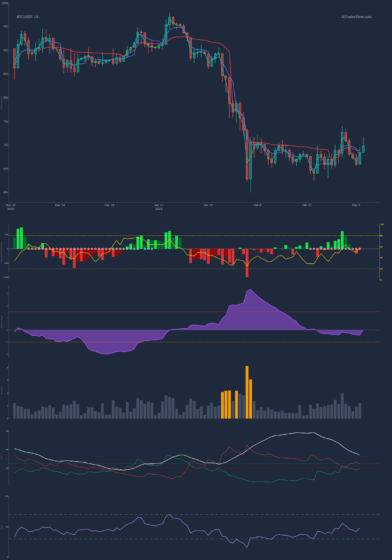
- 8. EMA: 1 (Bearish) The price is trading clearly below the key long-term EMAs (50, 100, 200). These now act as heavy dynamic resistance.
- 9. Fibonacci: 1 (Bearish) The current bounce is extremely weak and gets immediately rejected at the very first resistance: the 23.6% Fibonacci level.
- 10. nPOC: 1 (Bullish) There are still several untouched ‘naked’ POCs above the current price (including around $72.5k). These inefficiencies often act as magnets for price.
- 11. SMC (Smart Money Concepts): 1 (Bearish) The Bearish Market Structure is fully intact. There is no Change of Character (ChoCh) or strong upward impulse indicating a structural shift.
- 12. VWAP: 1 (Bearish) The price is at the lower end of the anchored VWAP bands, confirming sellers’ control over the volume-weighted average price.
Final Conclusion & Ratios
- Total points awarded: 11 (1 indicator was neutral/mixed)
- Bullish points: 4
- Bearish points: 7
Score Calculation:
- Bullish %: 4 ÷ 11 ≈ 36.4%
- Bearish %: 7 ÷ 11 ≈ 63.6%
Conclusion: The market is predominantly Bearish (63.6%). Although conditions exist for a corrective bounce (flushed Open Interest, liquidation capitulation behind us, and holding a demand zone), dominance still lies firmly with the sellers. Without a clear trend break or positive CVD divergence, the expectation remains that rallies will be sold (“sell the bounce”) until the market structure convincingly flips.
74-80k still on the table, and it continues to look more and more promising for $BTC
— 🐧 Pentoshi (@Pentosh1) March 10, 2026
There has even been more of an institutional bid again for the first time in weeks. https://t.co/jX9hHeYD3J pic.twitter.com/ruDiwH9133
⚠️ RISK WARNING & AI DISCLOSURE
- This information is generated by Artificial Intelligence (AI) and complex algorithms. While advanced, these systems can contain errors or inaccuracies and are for educational purposes only.
- Technical analysis provides no guarantees; this information is purely informative.
- All discussed scenarios are hypothetical and do not constitute predictions or expectations.
- Past performance is not an indicator of future results.
- This is not financial advice and is not intended as a call-to-action for the reader.
- No implicit direction is claimed, and no specific behavior of market participants is suggested.