

As a Senior Professional Crypto Trader and Technical Analyst, I have thoroughly analyzed the provided orderflow and technical charts for Bitcoin. We are looking at a market currently in a critical transitional phase: a battle between a macro-bearish trend and a micro-bullish reversal.
Here is my objective, data-driven analysis based on the visible elements in the snapshots.
Market Structure & Price Action (SMC, Trend, S/D)
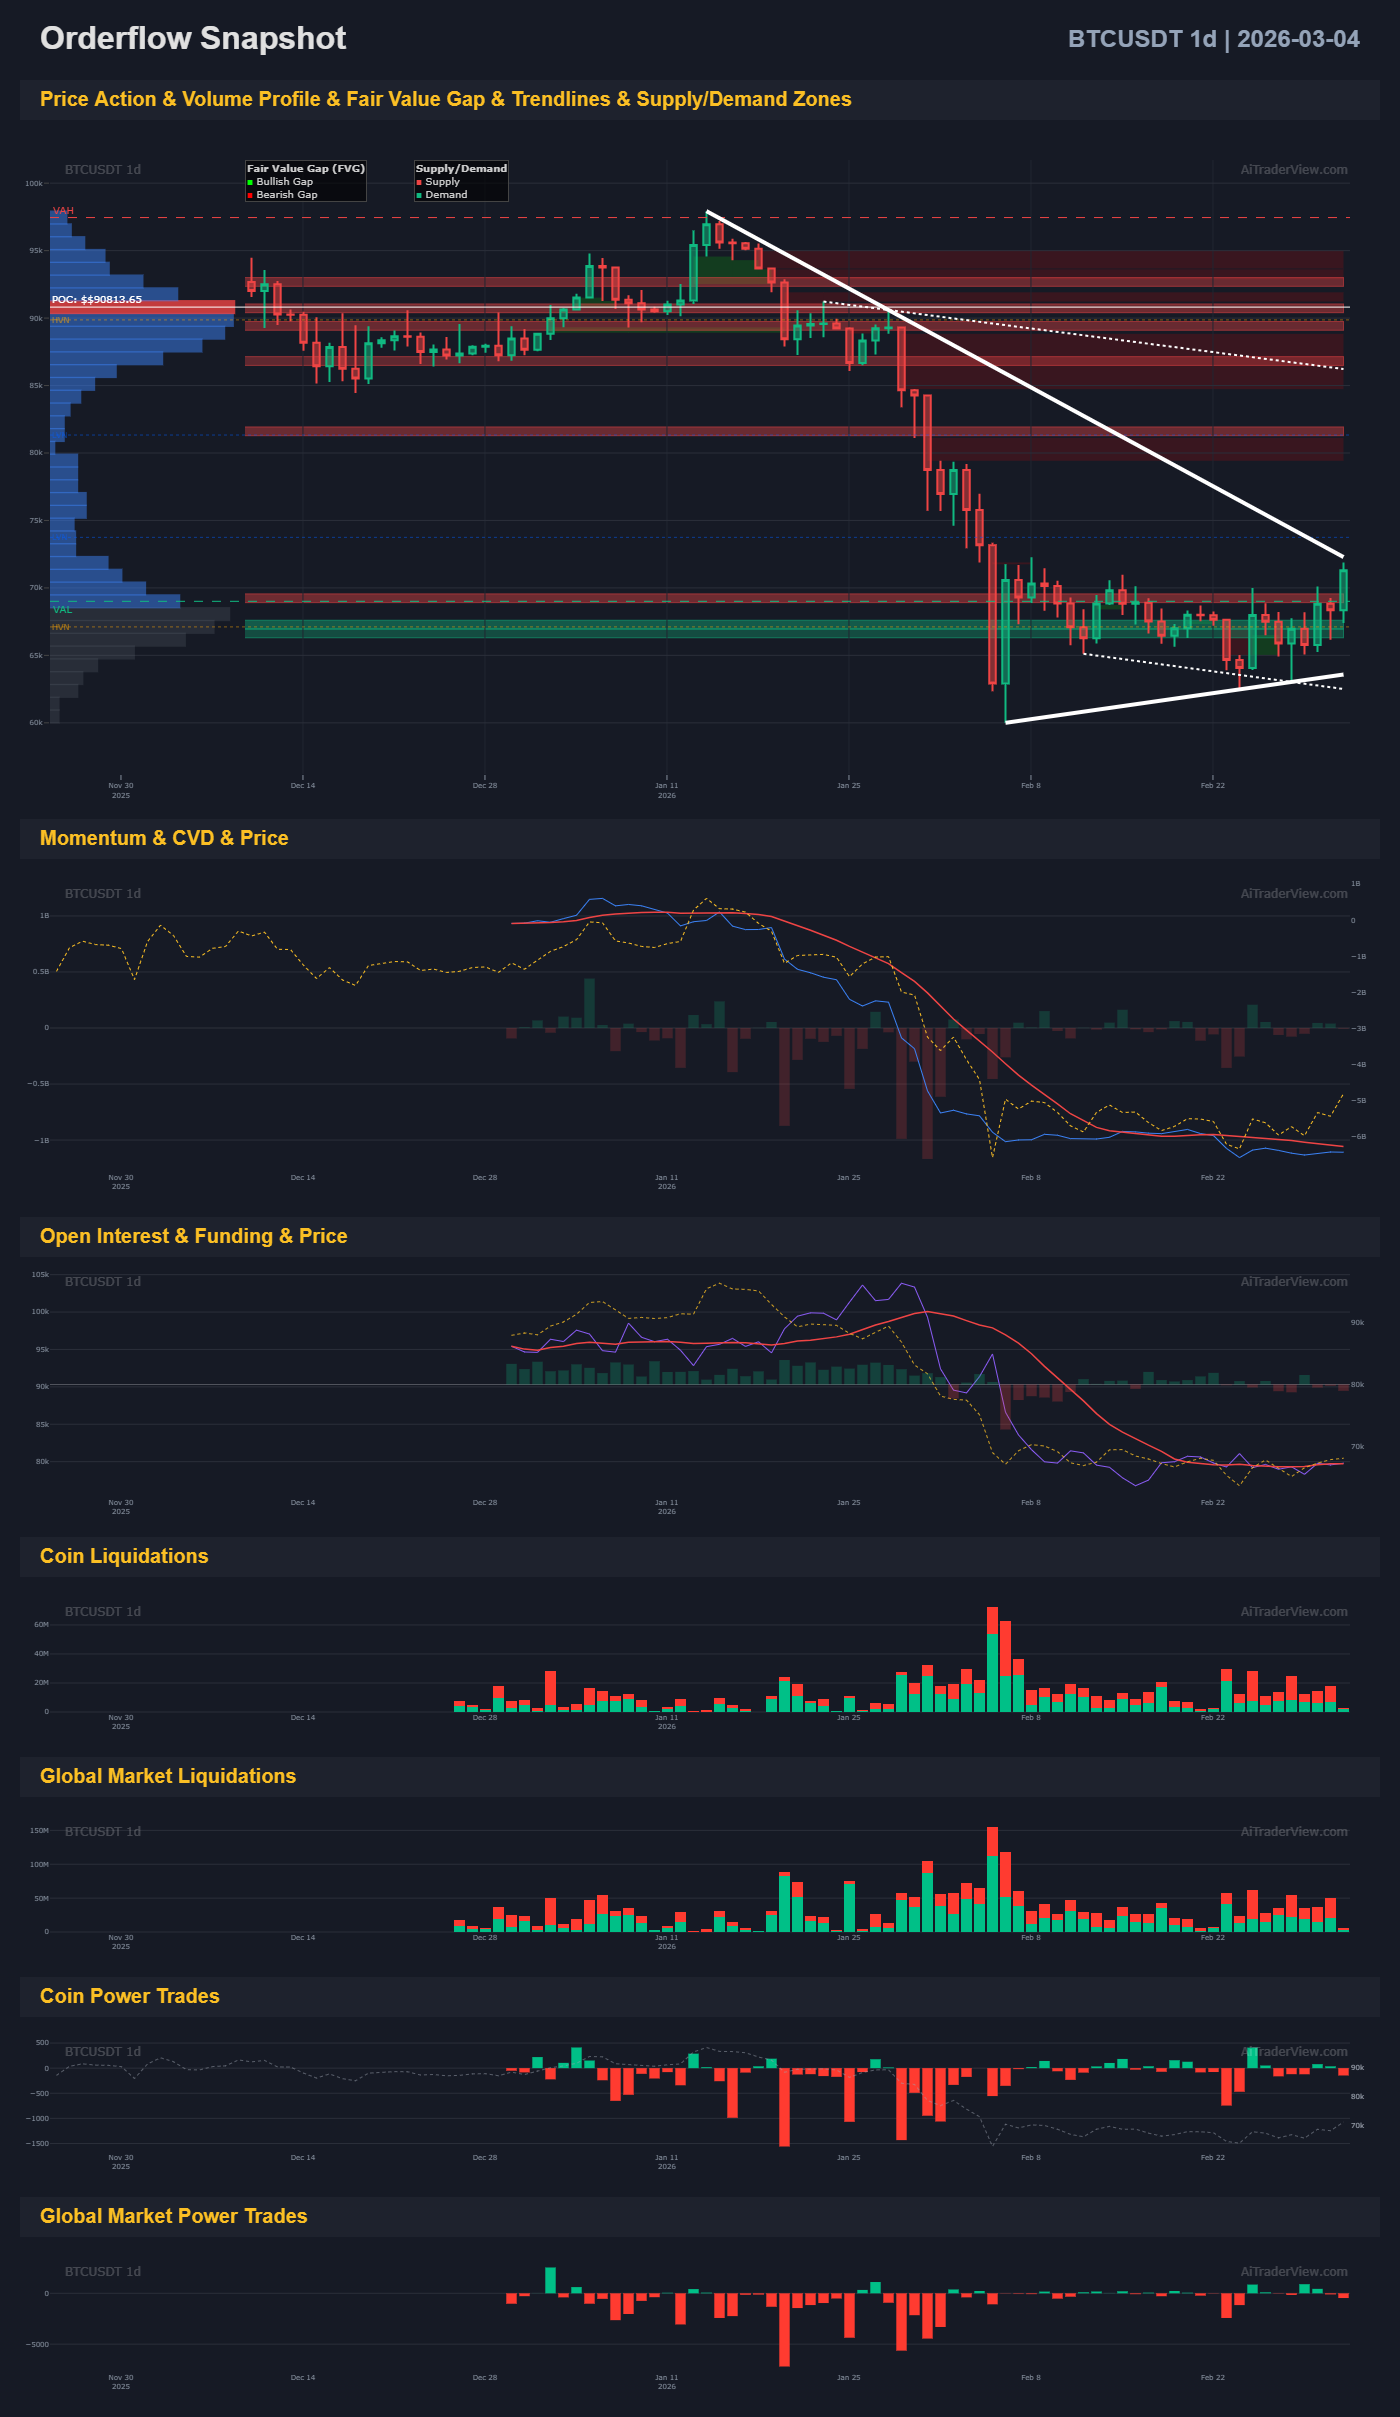
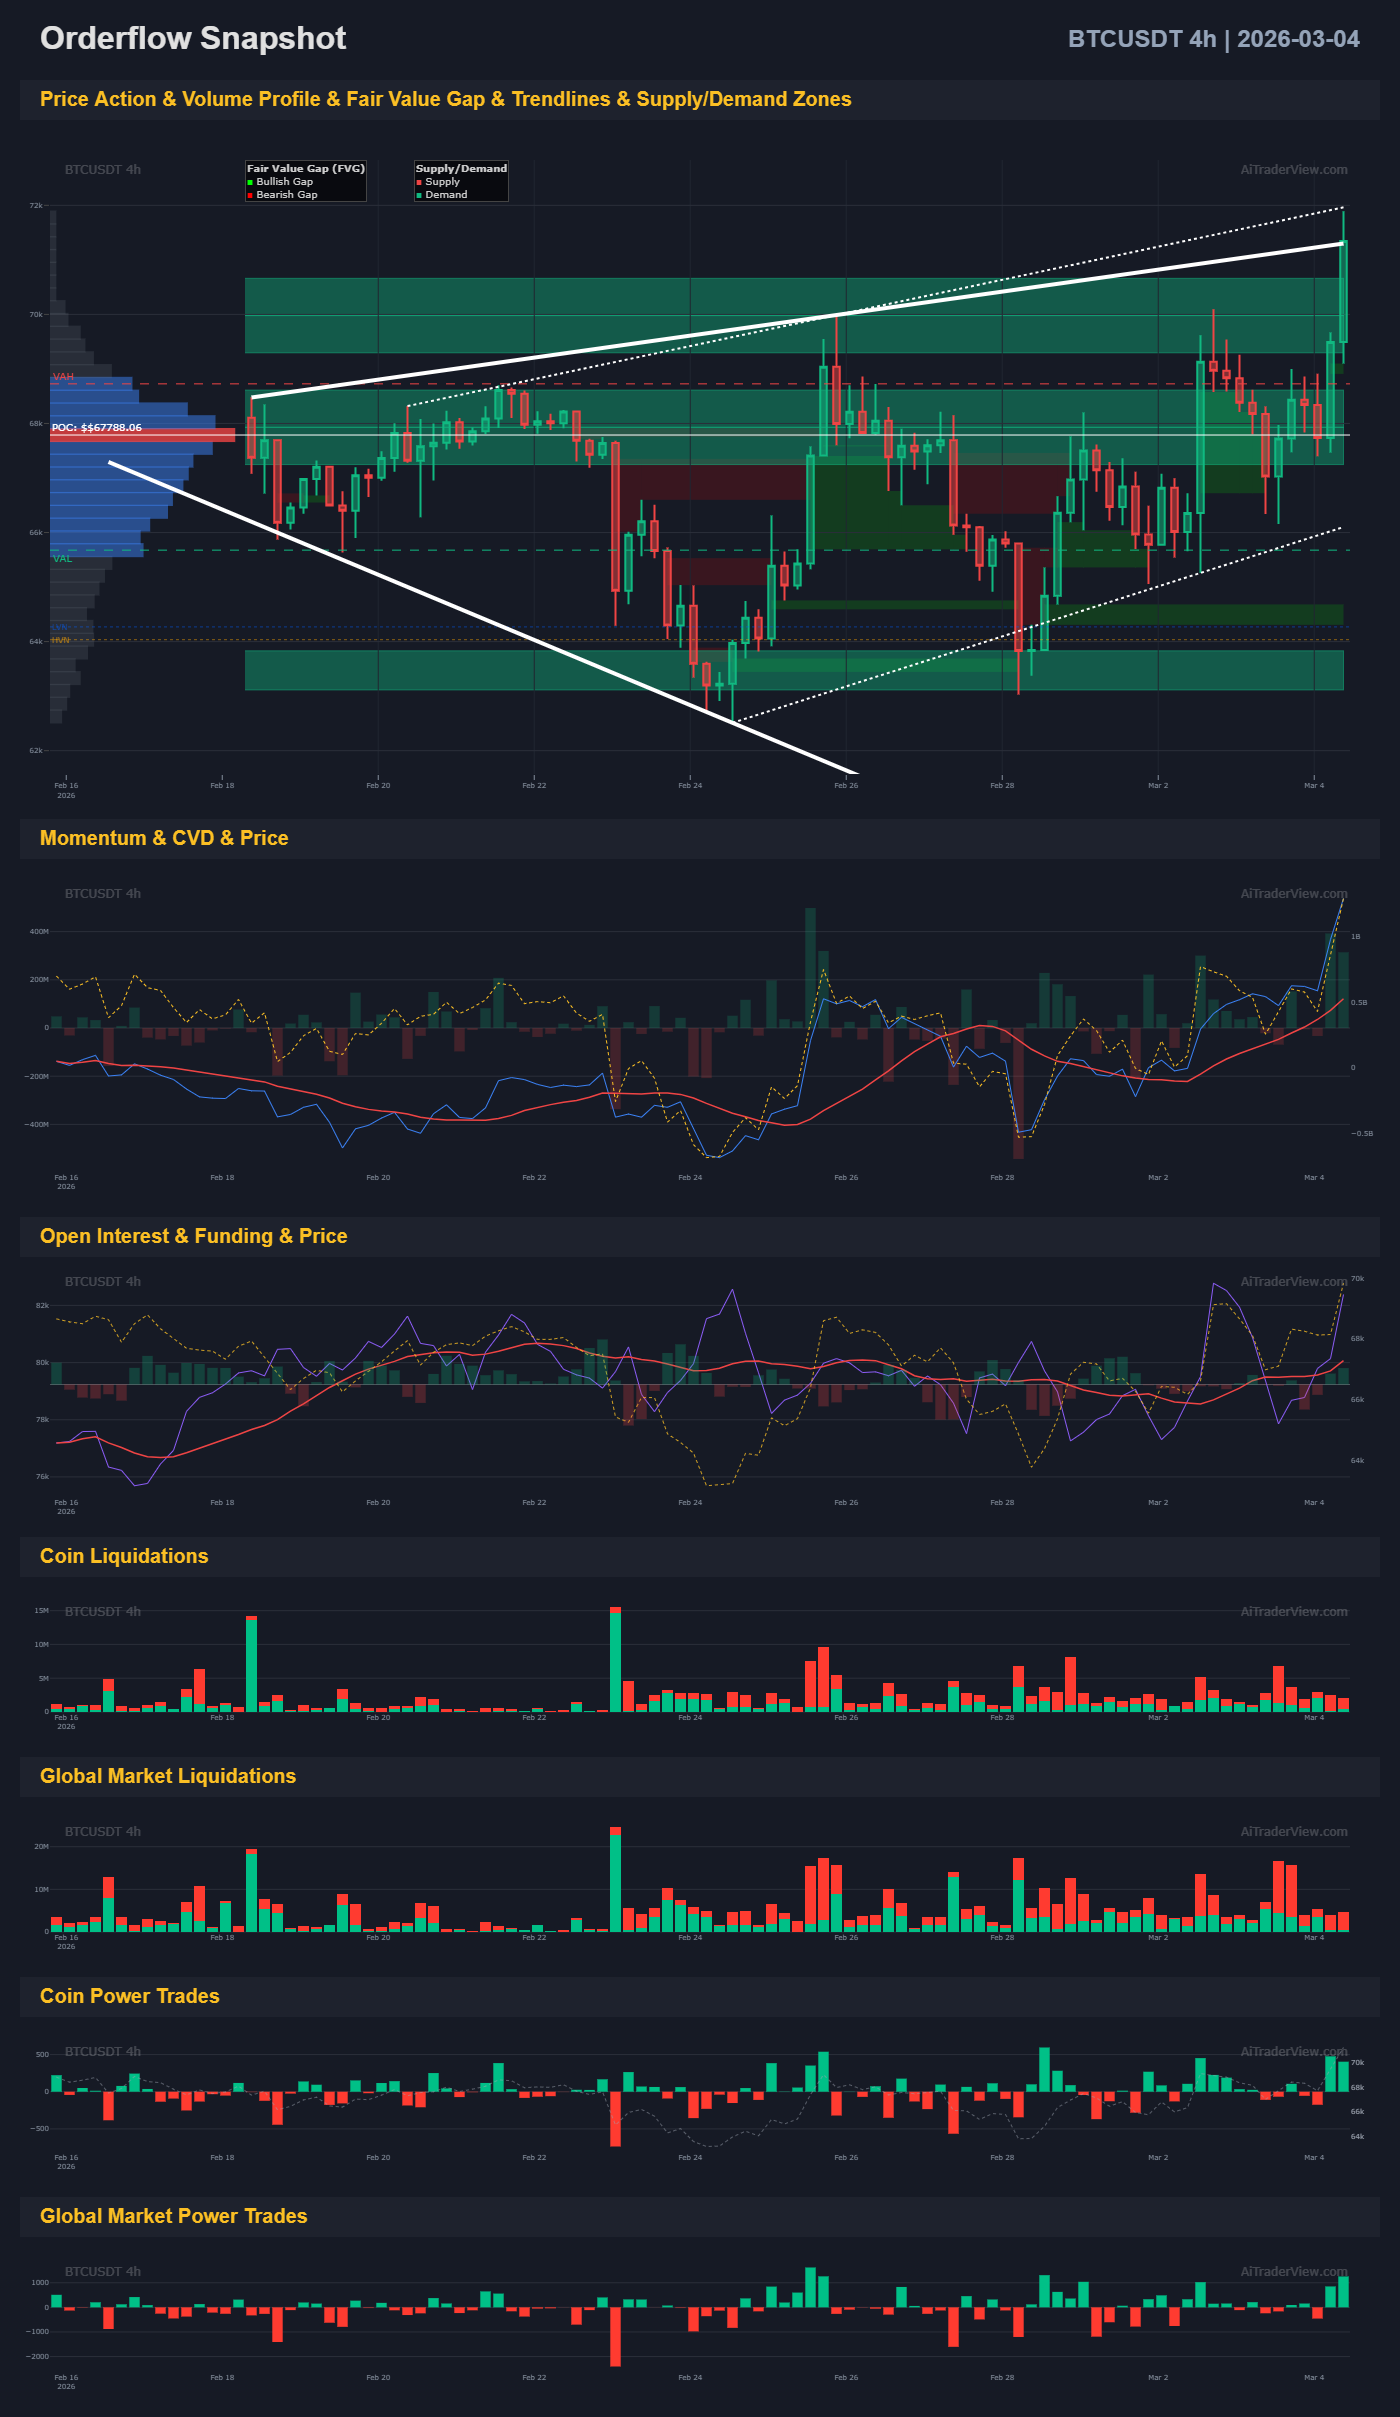
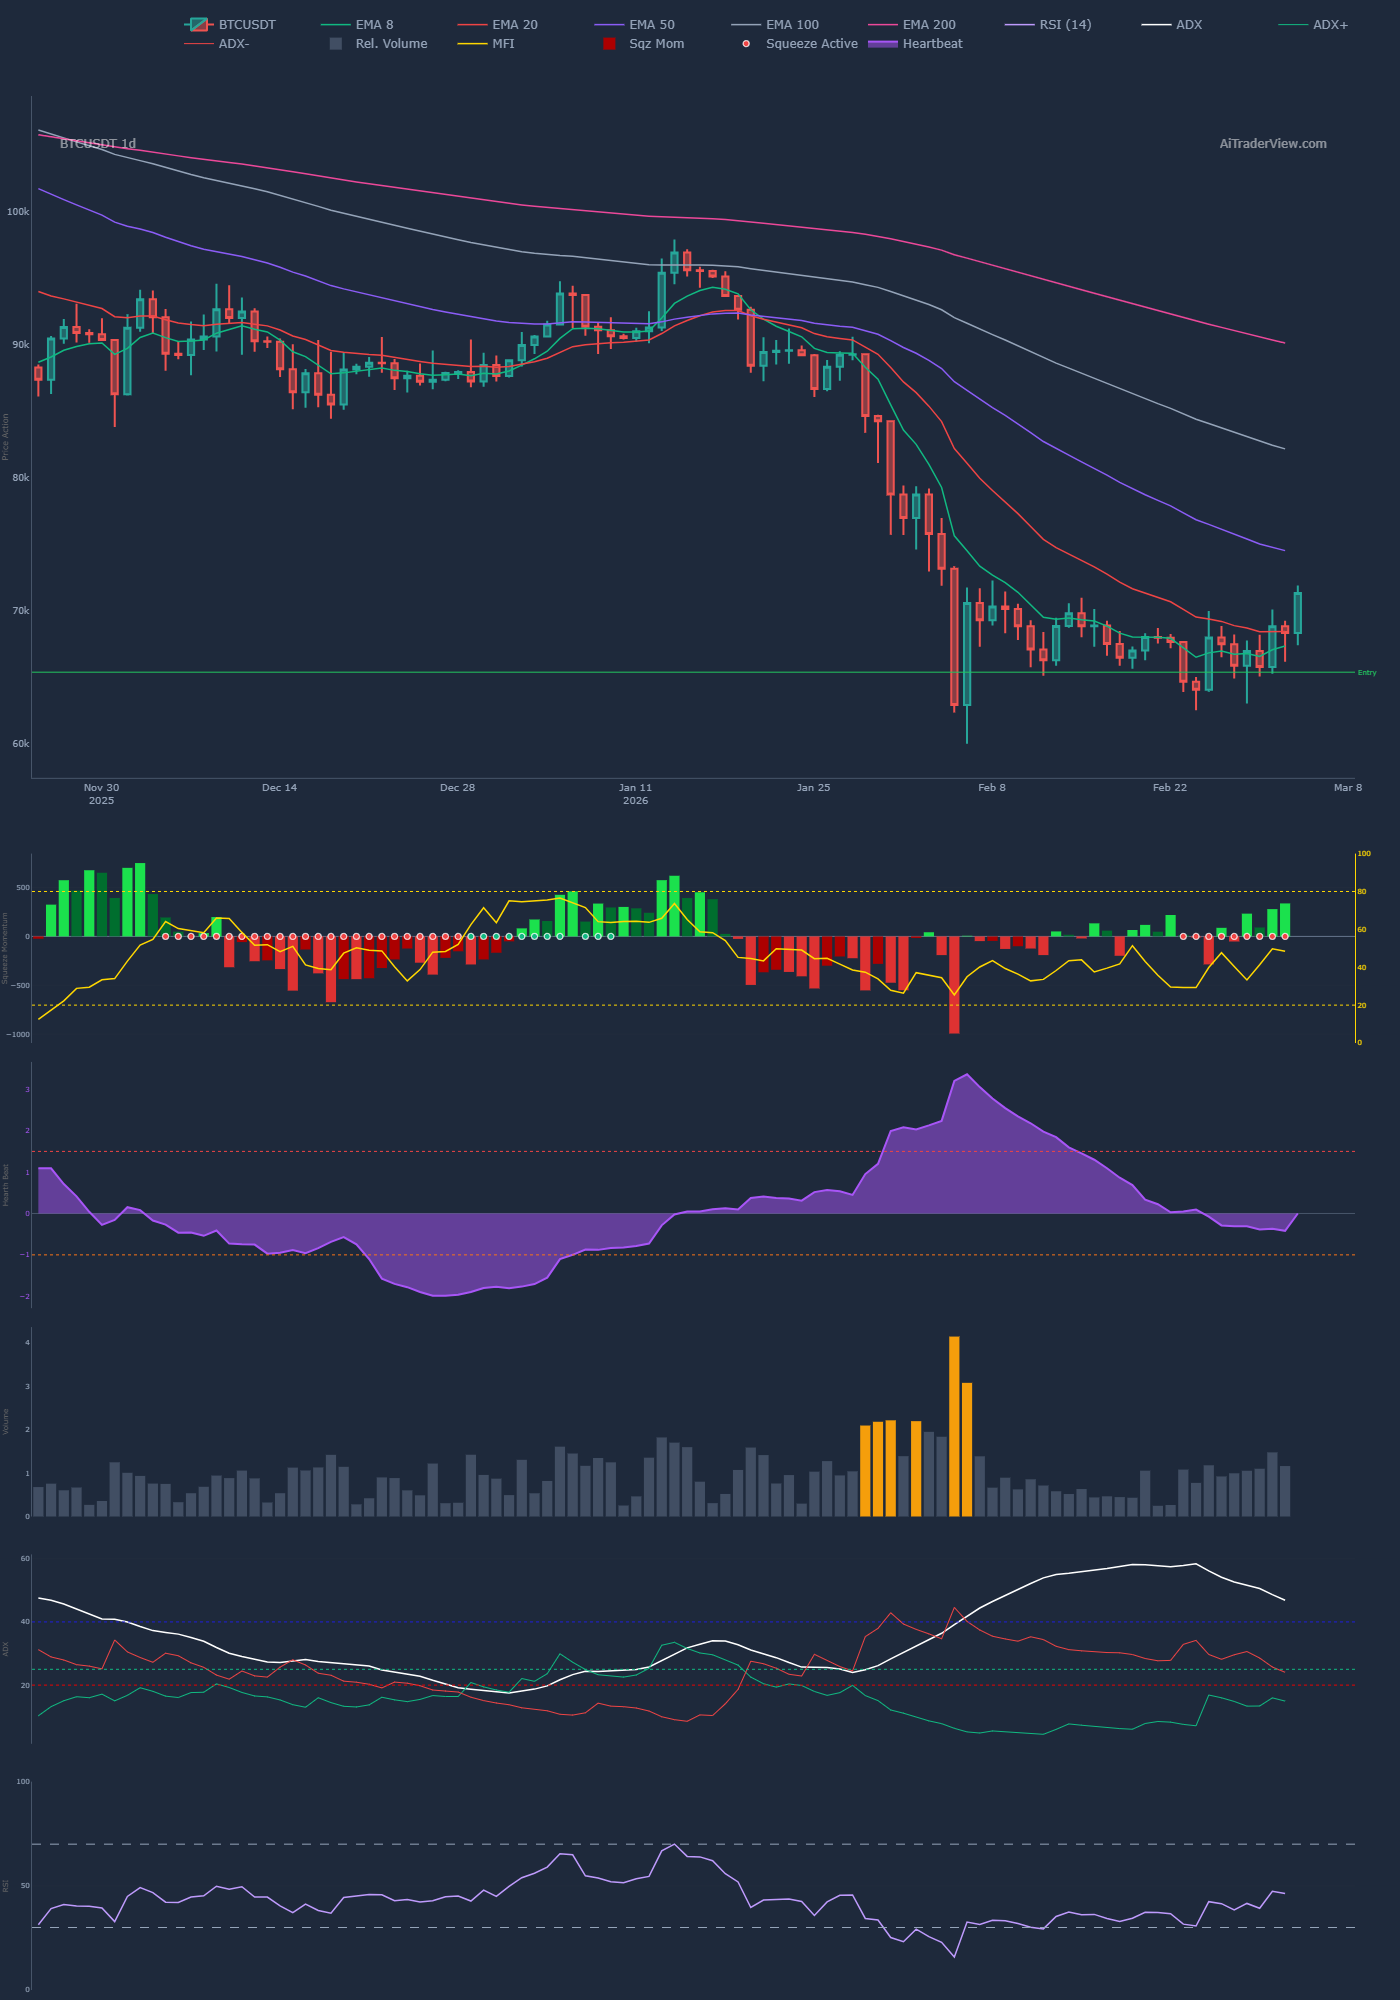
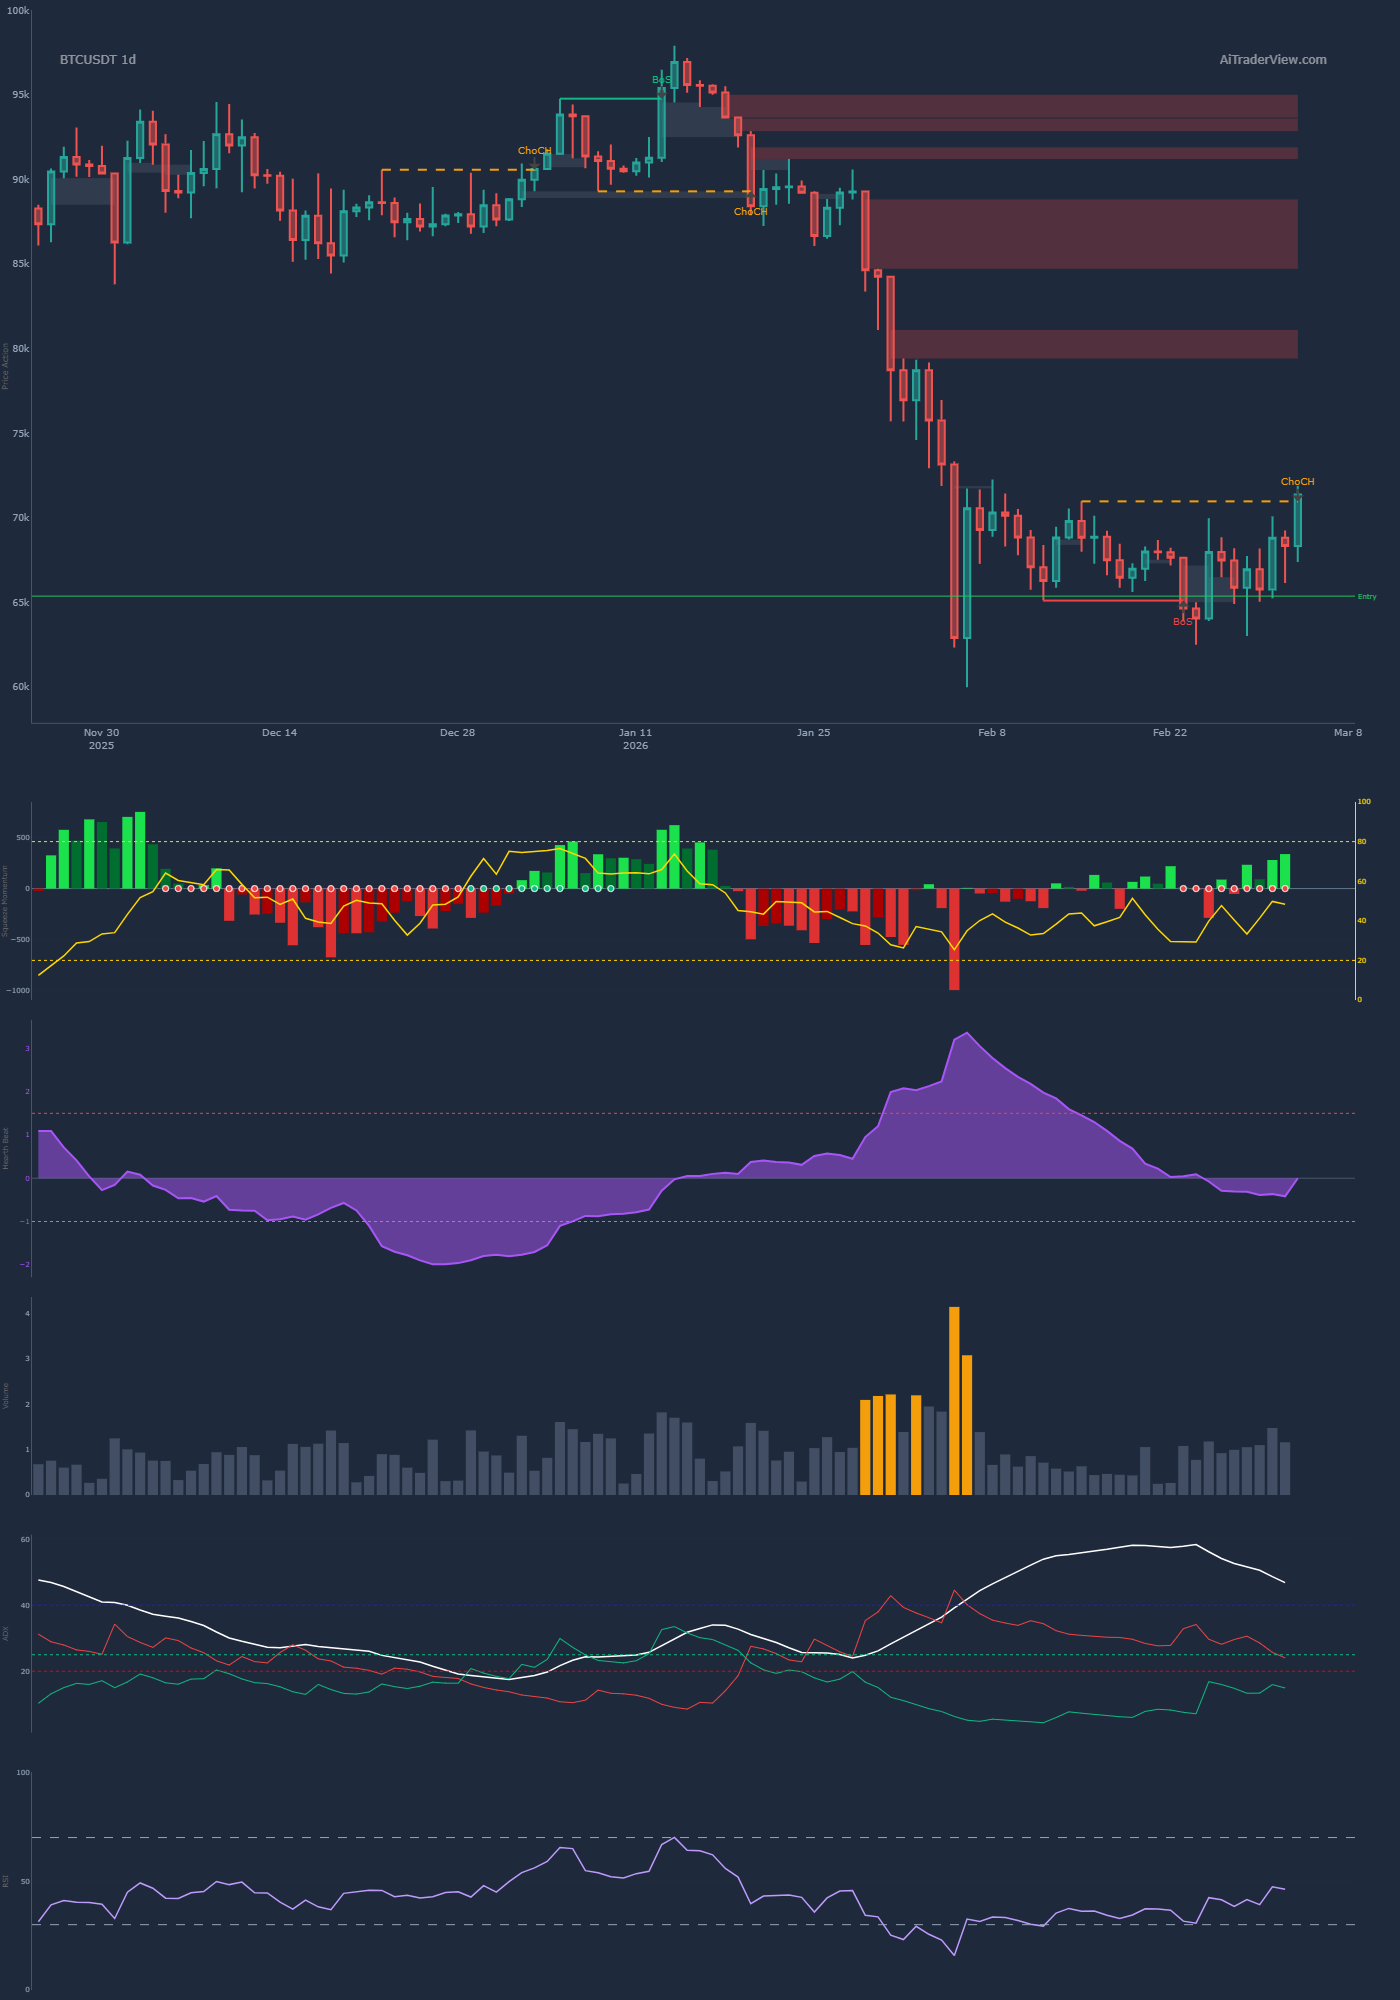
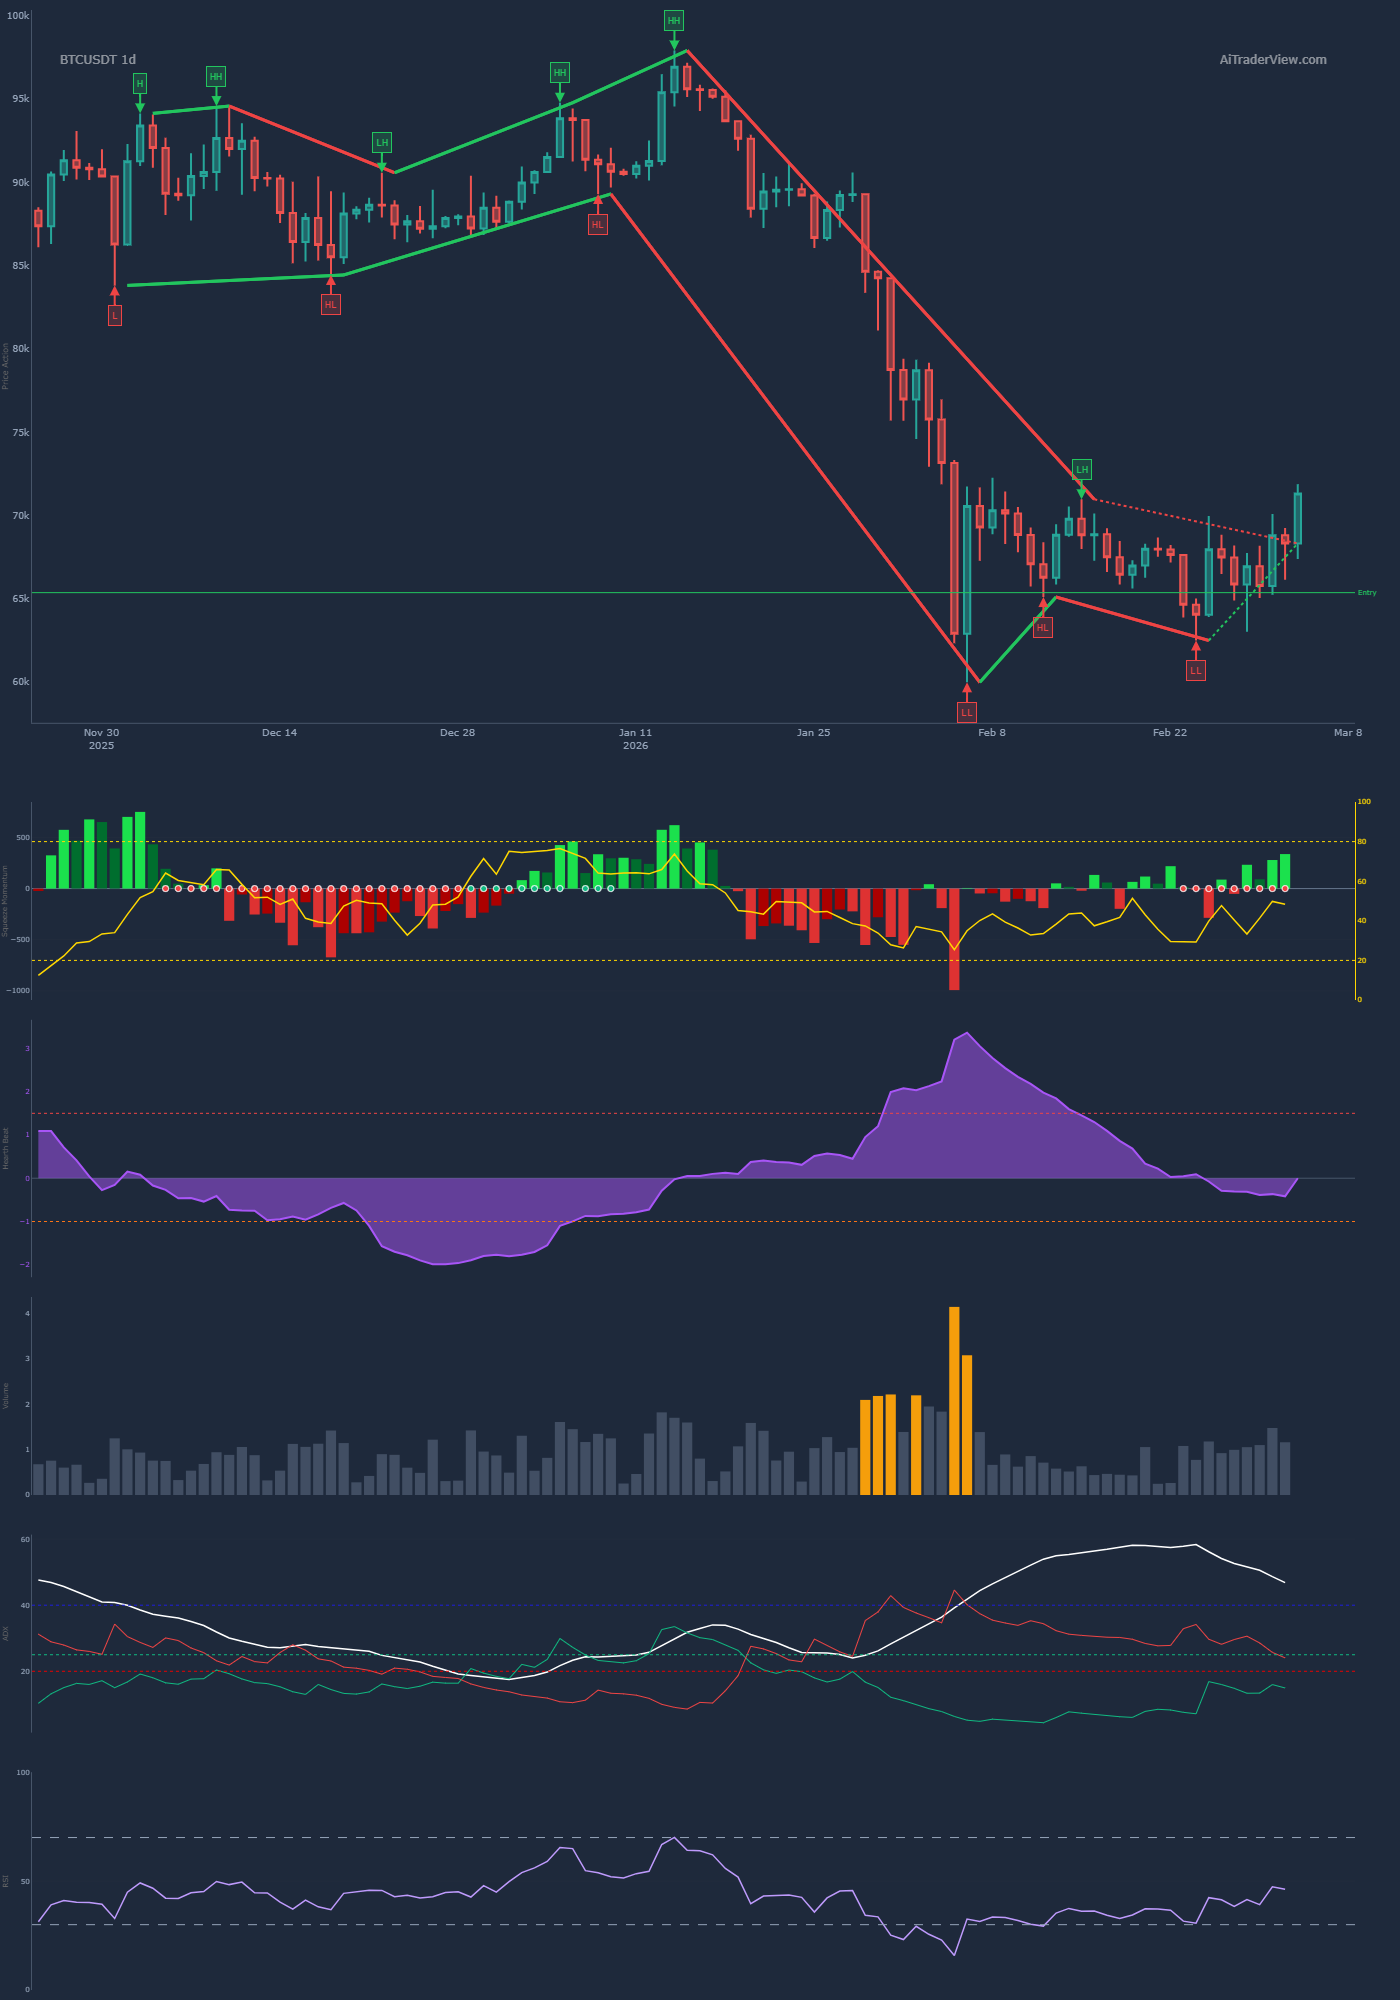
The macro trend on the daily chart is still decidedly bearish, characterized by a clear sequence of Lower Lows (LL) and Lower Highs (LH). However, we are currently seeing an aggressive reaction from a strong demand zone (the green box around the $60k-$65k level). This bounce has led to a breakout from a descending wedge pattern on both the 1D and 4H charts. Highly notable is the recent ChoCH (Change of Character) to the upside on the SMC chart, which serves as an early signal that the local market structure is shifting bullish.
Volume Profile, Orderflow & Liquidity
Looking at the Volume Profile, the price is currently navigating through a Low Volume Node. The 4H POC (Point of Control) at $67,786 is currently acting as local support, but the massive daily POC up around $90k hangs over the market as a heavy magnet and macro resistance. The recent upward impulse has been heavily fueled by short liquidations (visible as the green spikes in the Coin & Global Liquidations). This is classic squeeze fuel. However, the Power Trades (especially on the Global Market) still show significant red (sell) activity in the recent buildup, suggesting that larger players are either still distributing or actively defending their shorts. Open Interest (OI) is consolidating, indicating a wait-and-see approach among derivatives traders following the recent volatility.
Momentum & Technical Indicators (EMA, Fib, VWAP)
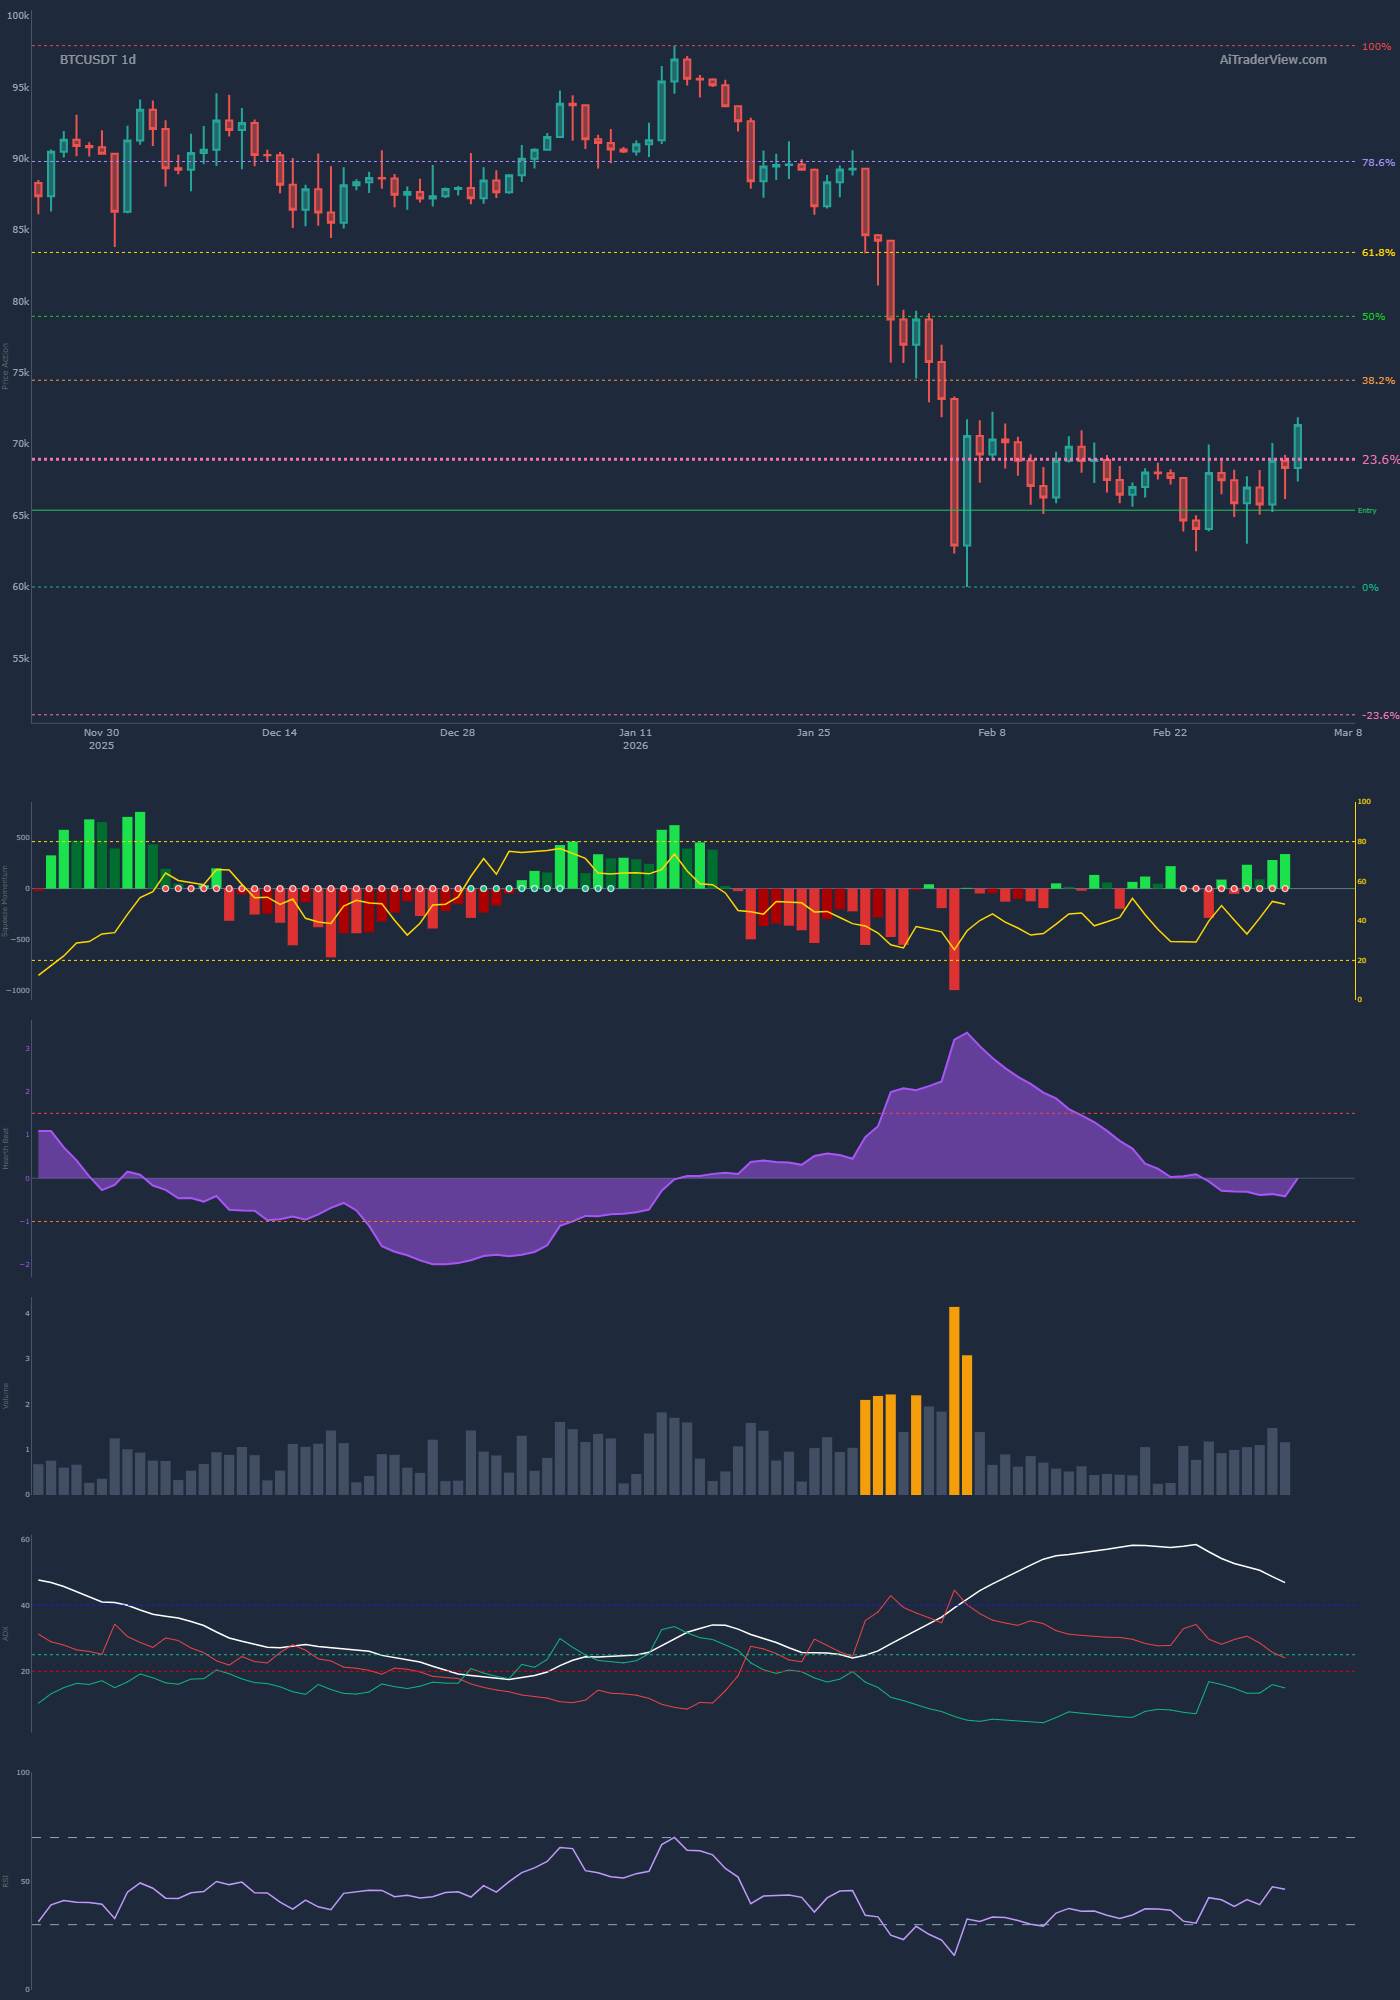
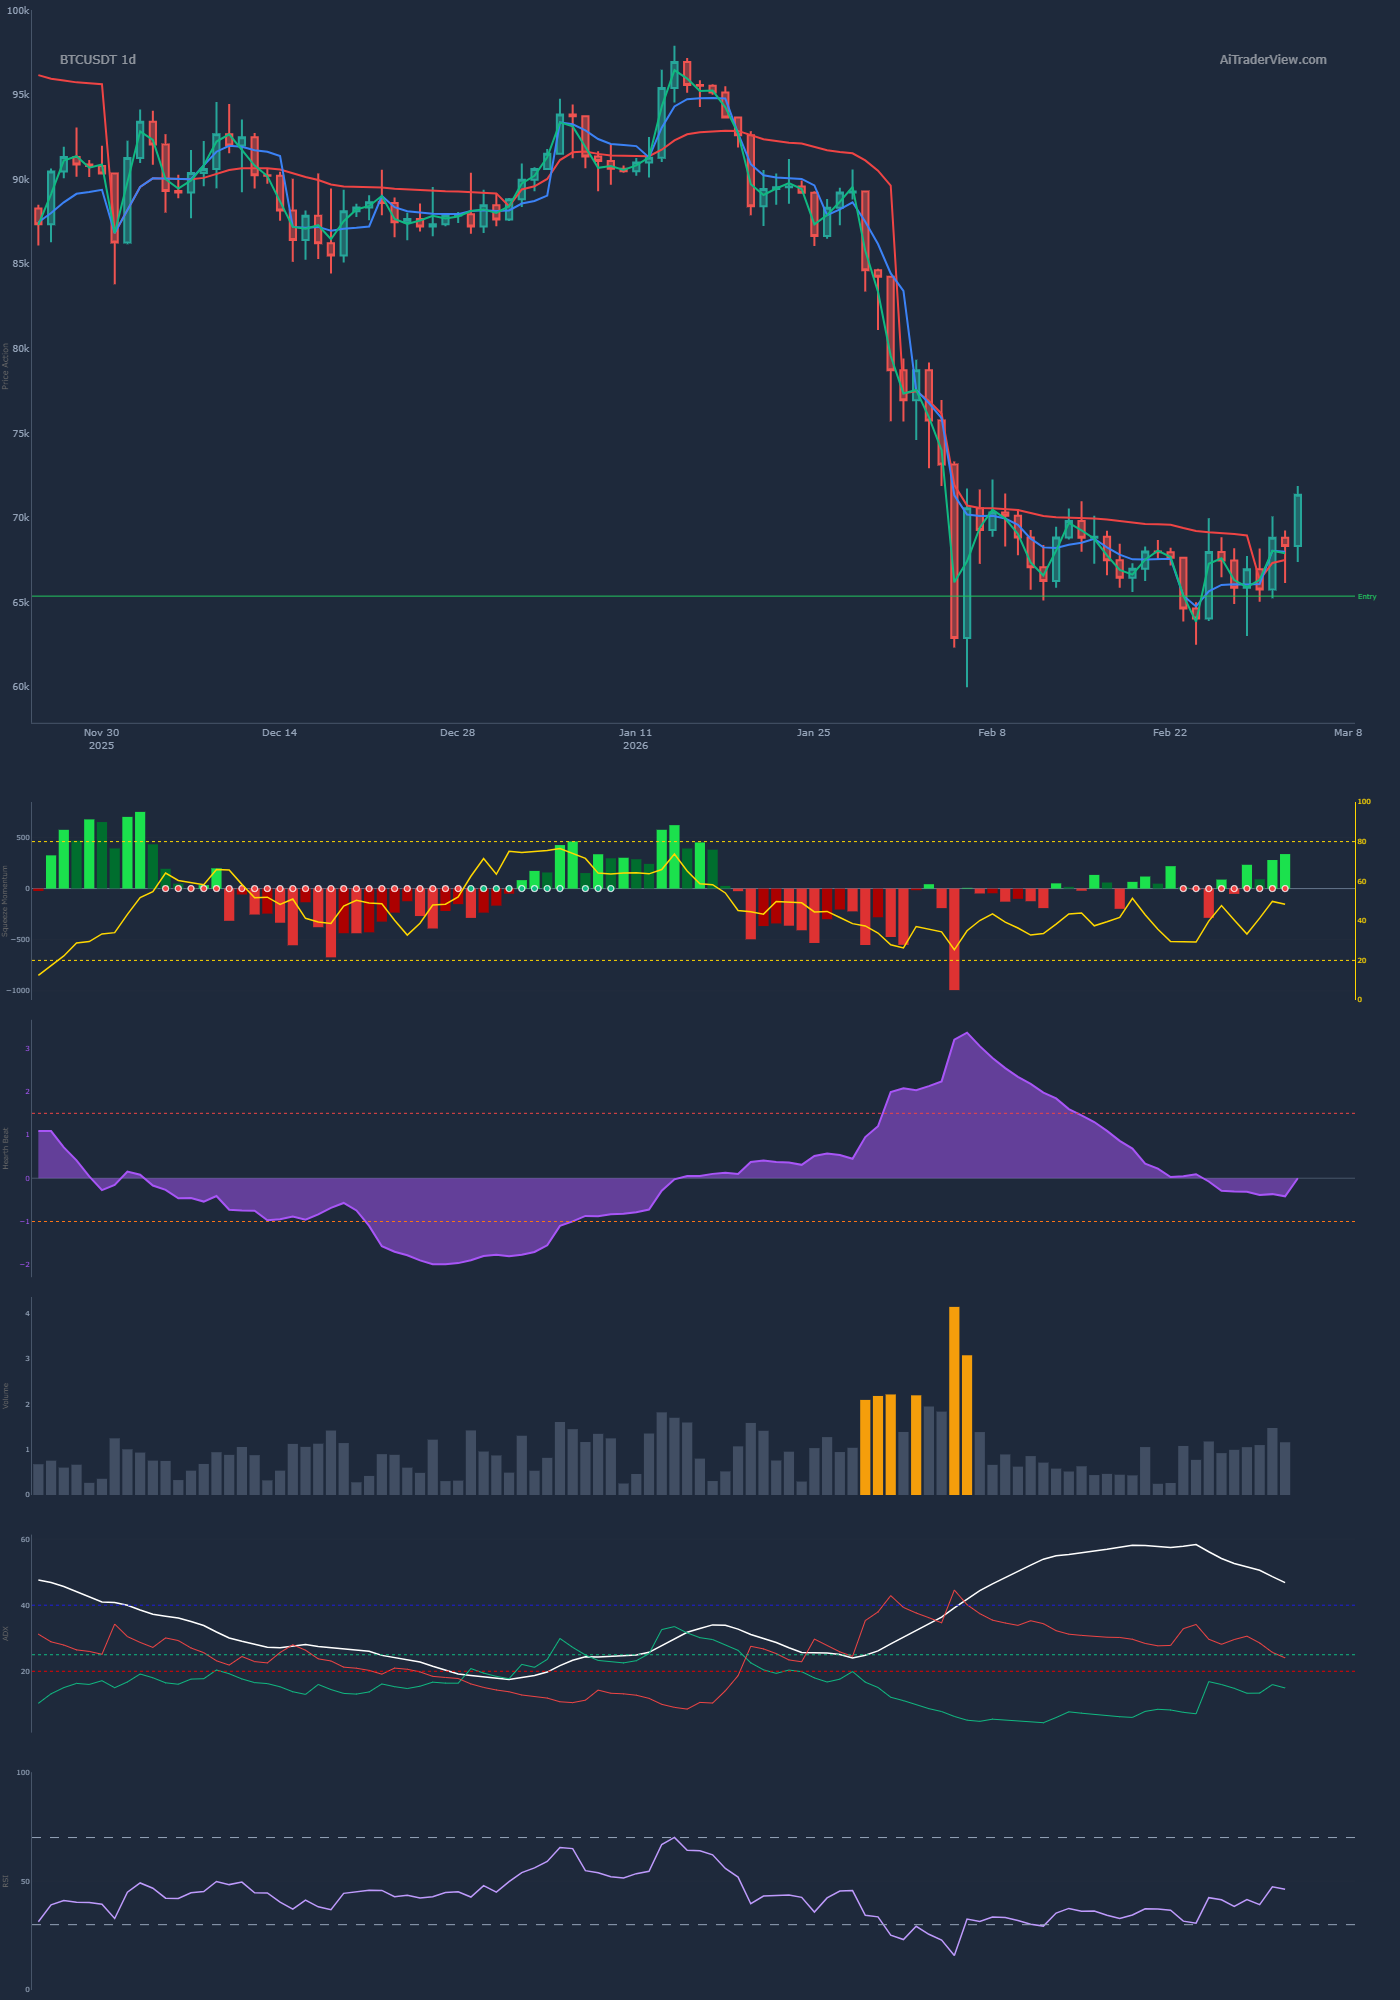
The CVD (Cumulative Volume Delta) on the 4H is rising alongside the price, and the Squeeze Momentum indicator on the daily is printing light red histogram bars. This signifies a clear loss of bearish momentum. That being said, traditional trend followers are not convinced yet: the price is still trading below the heavy 50, 100, and 200 EMAs, confirming the macro-bearish bias. Additionally, the price is currently wrestling with the 23.6% Fibonacci retracement and the midline of the VWAP; both are acting as dynamic resistance at this moment.
Data-Driven Scoring System & Conclusion
Based on your scoring model, I assign the following points (1 point for the dominant direction, 0 for no clear direction/mixed):
- Price & volume profile & FVG: 1 (Bullish) – Breakout from the wedge, price trading above 4H POC.
- Liquidations (Coin & Global): 1 (Bullish) – Strong short liquidations driving the current bounce.
- Power trades (Coin & Global): 1 (Bearish) – Predominantly negative (red) delta in recent global power trades.
- Supply & demand zones: 1 (Bullish) – Powerful and successful bounce from the macro demand zone.
- CVD & momentum: 1 (Bullish) – Bearish momentum is fading (Squeeze), 4H CVD is rising.
- Open interest & funding: 0 (Neutral) – OI is relatively flat/sideways, no strong positioning.
- Trend: 1 (Bearish) – Daily structure is still printing Lower Lows (LL) and Lower Highs (LH).
- EMA: 1 (Bearish) – Price is acting below the macro EMAs (50, 100, 200).
- Fibonacci: 1 (Bearish) – Price is being rejected by / struggling with the 23.6% retracement.
- nPOC: 0 (Neutral) – Price is above the 4H POC, but far below the massive 1D POC.
- SMC: 1 (Bullish) – Clear bullish ChoCH printed on the daily chart.
- VWAP: 1 (Bearish) – Price is facing resistance at the VWAP midline.
Calculation:
- Total assigned points: 10 (2 categories remained neutral/0)
- Bullish points: 5
- Bearish points: 5
Final Score:
- Bullish %: 5 / 10 = 50%
- Bearish %: 5 / 10 = 50%
Conclusion: The market is in an exact state of equilibrium (50/50). We are witnessing a strong, liquidation-driven mean-reversion bounce from demand, paired with early structural signs of a bottom (ChoCH). However, all macro-technical resistances (Trend, EMAs, VWAP, Fib) remain fully intact. As a trader, you are waiting here for a definitive break and hold above the 23.6% Fib and VWAP for further long confluence, or a clear rejection here to trigger a continuation short toward a new Lower Low.
⚠️ RISK WARNING & AI DISCLOSURE
- This information is generated by Artificial Intelligence (AI) and complex algorithms. While advanced, these systems can contain errors or inaccuracies and are for educational purposes only.
- Technical analysis provides no guarantees; this information is purely informative.
- All discussed scenarios are hypothetical and do not constitute predictions or expectations.
- Past performance is not an indicator of future results.
- This is not financial advice and is not intended as a call-to-action for the reader.
- No implicit direction is claimed, and no specific behavior of market participants is suggested.