
Here is the the objective, data-driven technical analysis of Bitcoin BTCUSDT, based strictly on the provided visualizations of the orderflow, market structure, and volume profiling.
Market Context & Orderflow Analysis
The overall market structure is in a heavy macro downtrend, with the price currently consolidating at the bottom following a significant capitulation event.
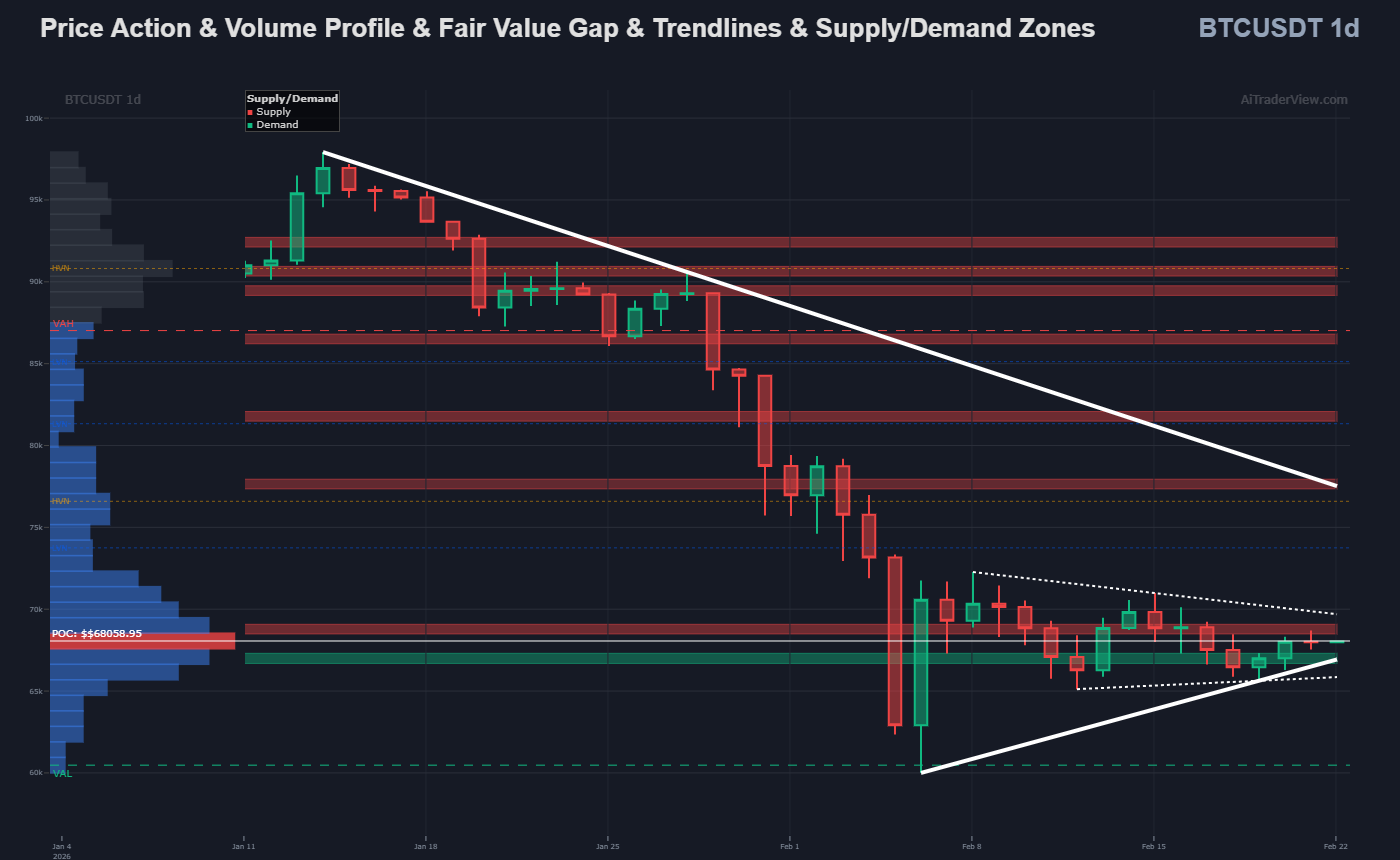
- Volume Profile & Price Action: The price is consolidating exactly around the daily Point of Control (POC) at $68,058. The vast majority of the volume (Value Area) is located significantly higher, with a Value Area High (VAH) around $87k. This indicates a massive distribution zone above the current price.
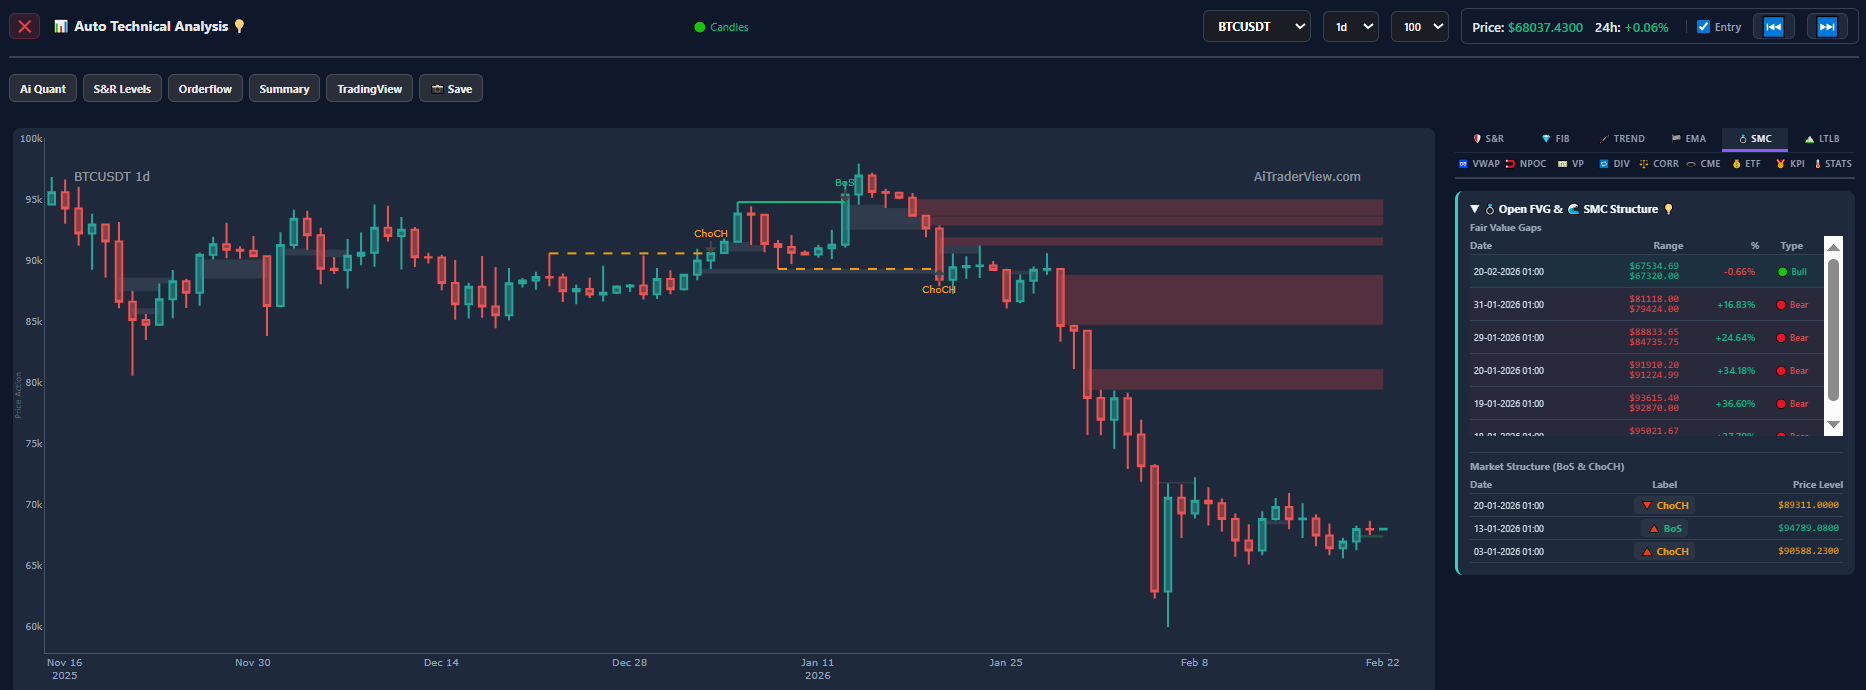
- SMC & Market Structure: The structure is undeniably bearish. Recent Break of Structure (BoS) and Change of Character (ChoCH) signals point downward. There are massive bearish Fair Value Gaps (FVGs) above the current price (e.g., around $81k and $88k), which will act as heavy resistance.
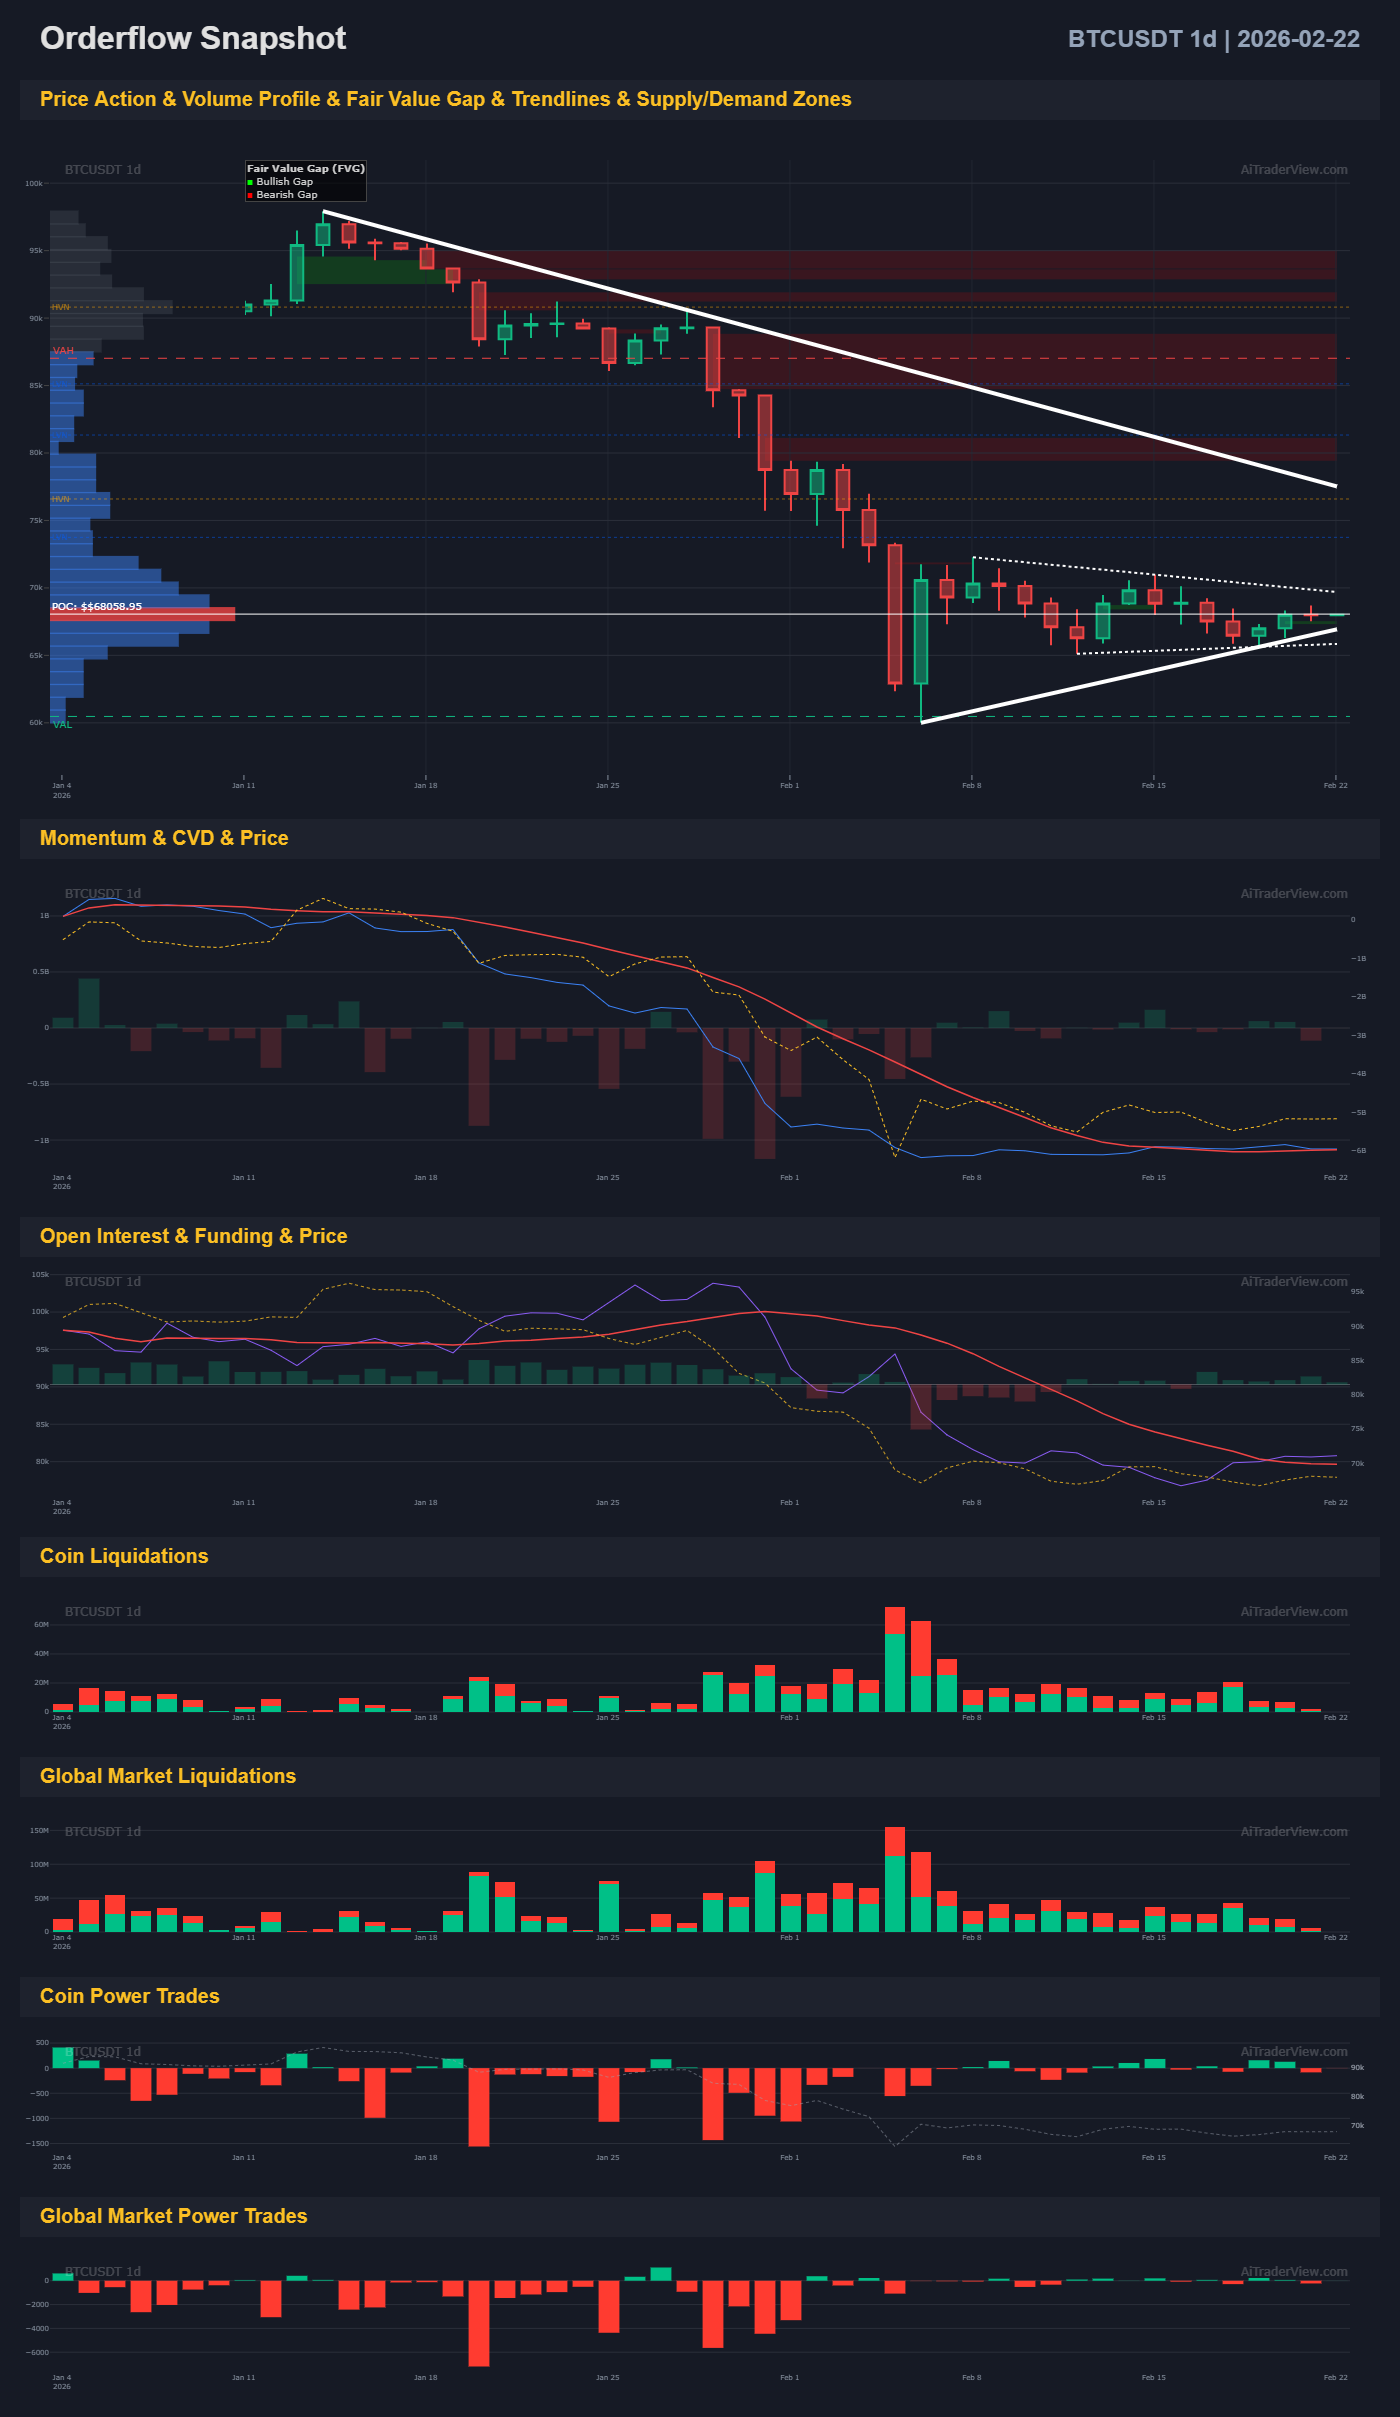
- Orderflow & CVD: The Cumulative Volume Delta (CVD) shows a sustained downward trend, confirming that market sells (selling pressure) are dominating. Open Interest is simultaneously declining, indicating the closing of positions and a distinct lack of new buyers entering the market (long leverage).
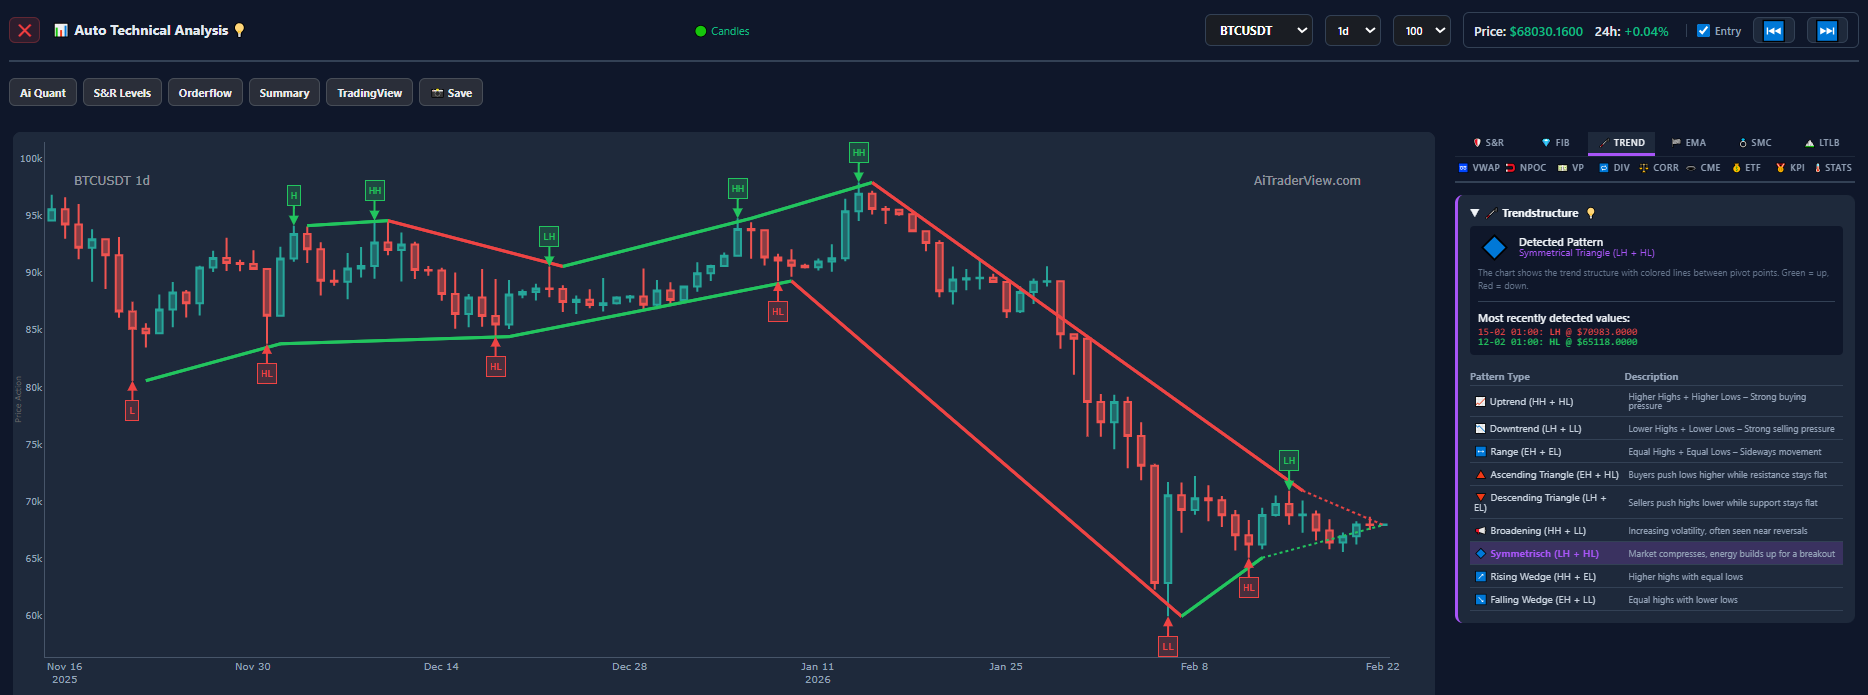
- Trend & Compression: Locally, a Symmetrical Triangle is forming (Lower Highs and Higher Lows). The market is compressing and building energy for the next impulse move.
Data-Driven Point System
Below is the objective assessment of the 13 criteria based on the current data.
(Score: 1 point for Bullish, 1 point for Bearish, 0 for Neutral/Mixed)
| # | Indicator | Status | Bearish | Bullish | Explanation |
| 1. | Price & volume profile & FVG | Bearish | 1 | 0 | Price is stagnating at the bottom of the profile with massive Bearish FVGs above it. |
| 2. | Liquidations (Coin & Global) | Bullish | 0 | 1 | After a heavy long flush, we are now mainly seeing small short liquidations (green bars). |
| 3. | Power trades (Coin & Global) | Bearish | 1 | 0 | Historically heavy selling pressure (red bars) still dominates the chart. |
| 4. | Supply & demand zones | Neutral | 0 | 0 | Price is trapped between the $67k demand zone and the $69k supply zone. |
| 5. | CVD & momentum | Bearish | 1 | 0 | The CVD line exhibits a strong and continuous downward trend. |
| 6. | Open interest & funding | Bearish | 1 | 0 | Declining Open Interest combined with price weakness indicates a lack of underlying support. |
| 7. | Trend 1 | Neutral | 0 | 0 | Symmetrical Triangle is a neutral compression pattern (LH + HL). |
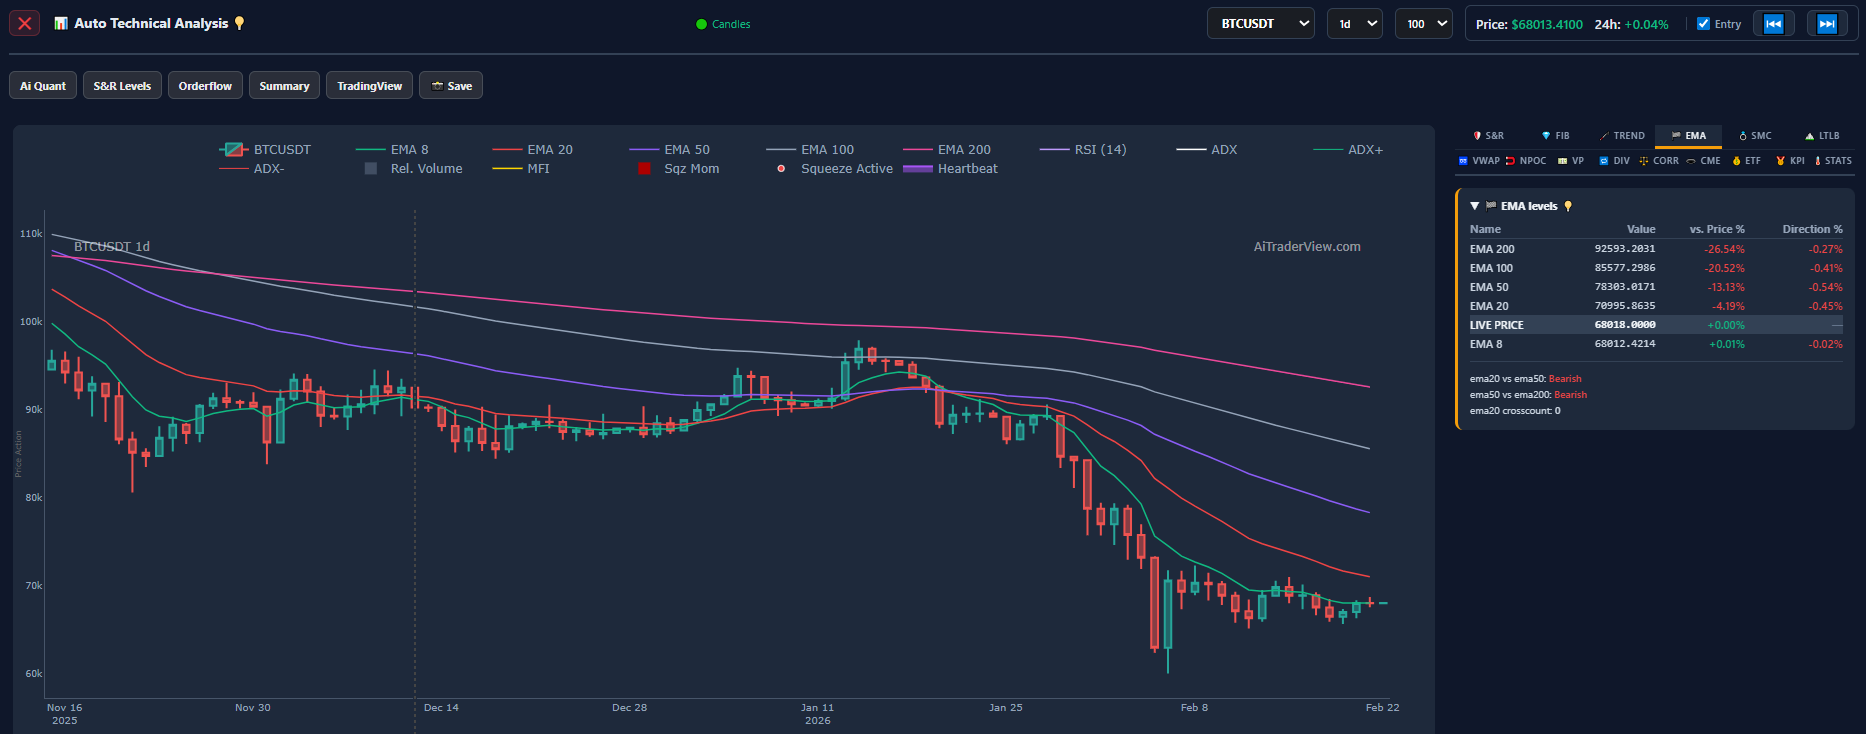
| 8. | EMA | Bearish | 1 | 0 | Price is trading below the 20, 50, 100, and 200 EMAs with bearish crosses. |
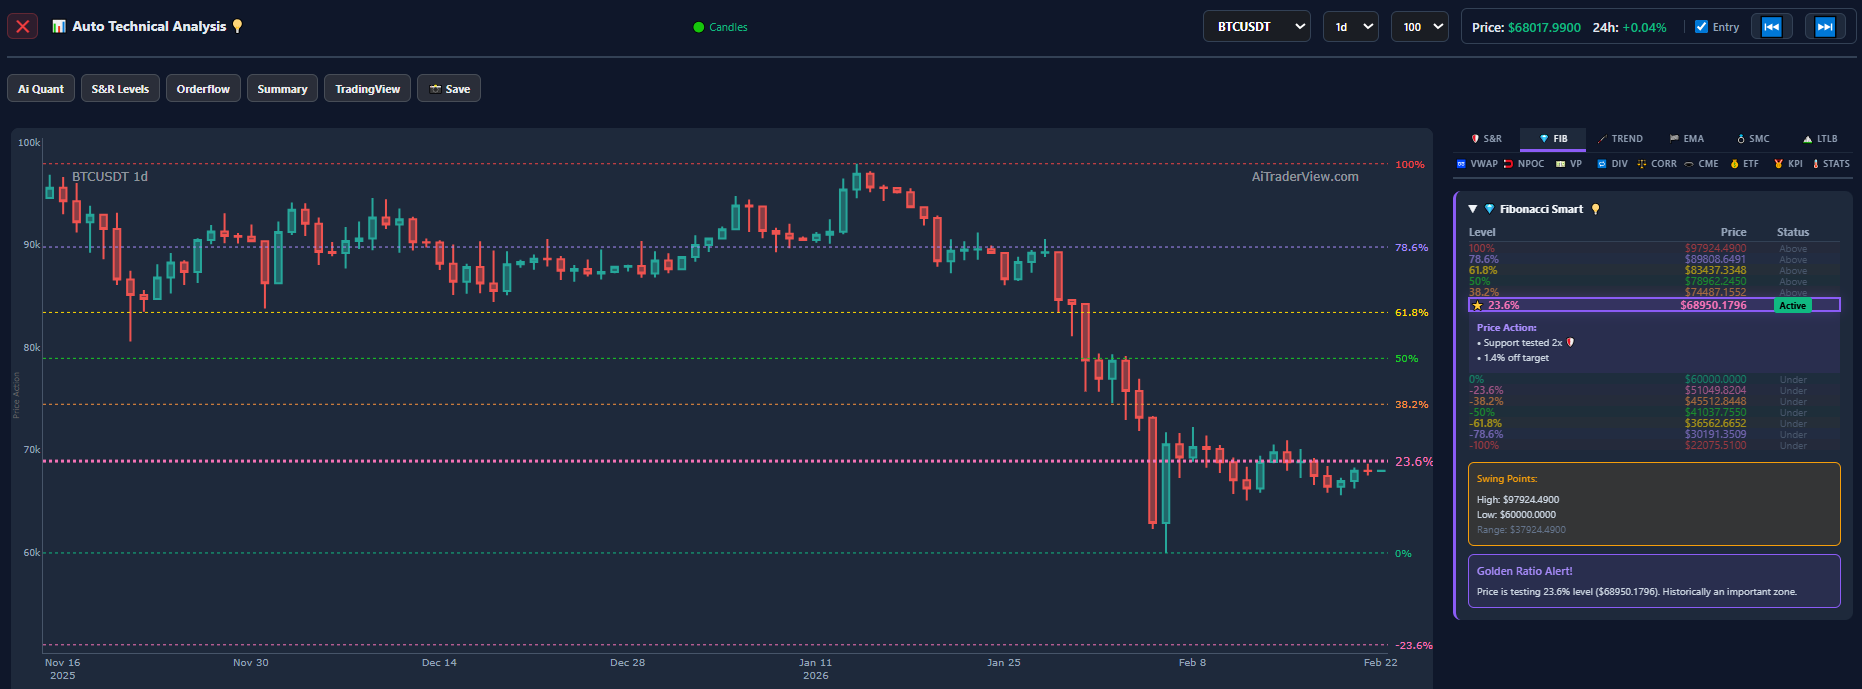
| 9. | Fibonacci | Bearish | 1 | 0 | Price ($68,017) is currently failing below the 23.6% retracement level ($68,950). |
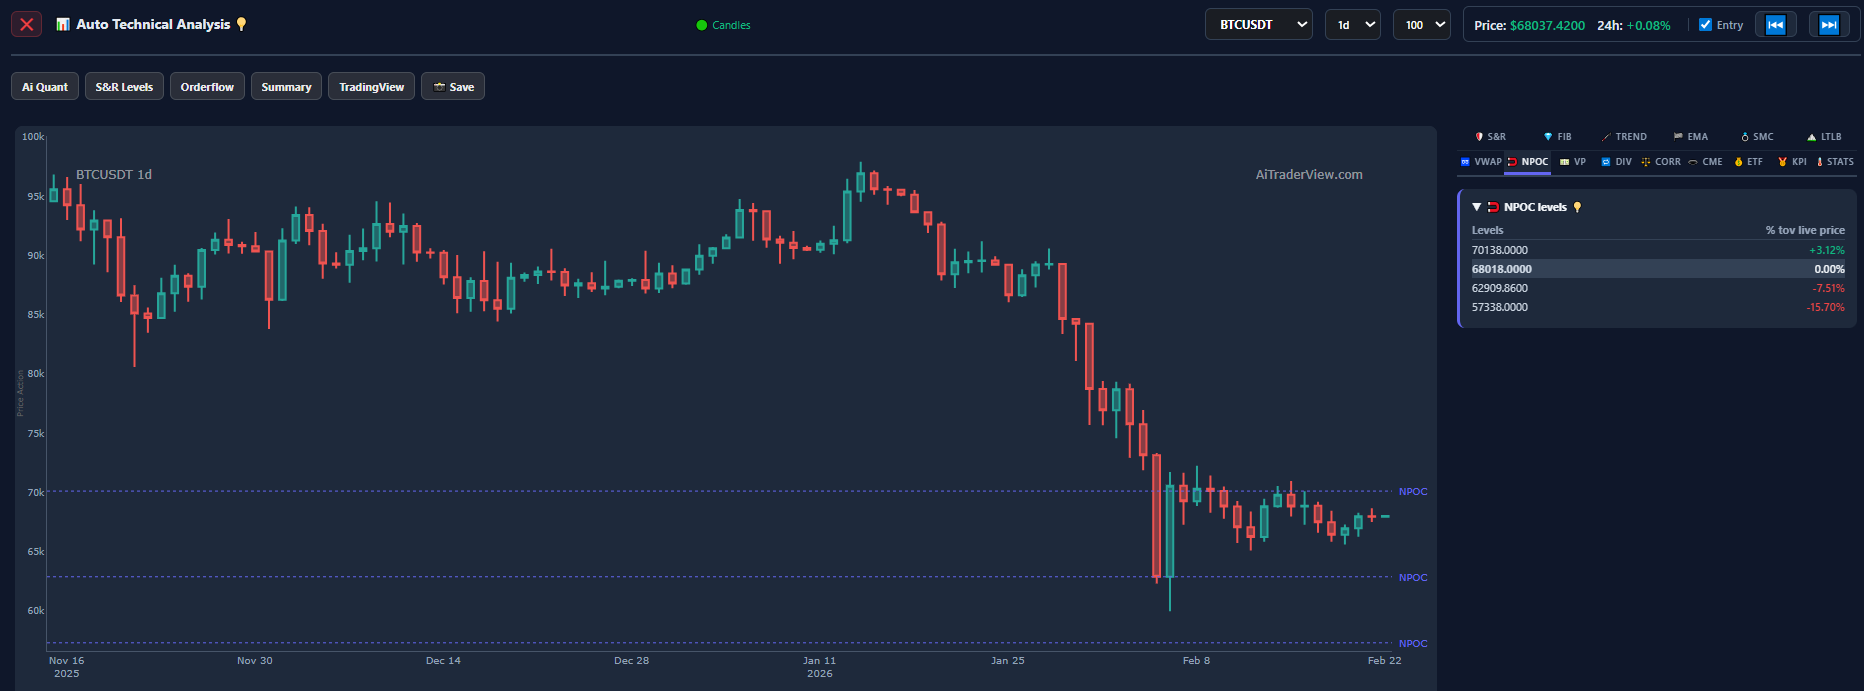
| 10. | npoc | Neutral | 0 | 0 | The live price is balancing exactly on the Naked Point of Control (NPOC) at $68,018. |
| 11. | smc | Bearish | 1 | 0 | Macro structure has been taken over by bears (ChoCH to the downside). |
| 12. | trend (duplicate) | Neutral | 0 | 0 | Same pattern as point 7. Compression without a clear breakout direction. |
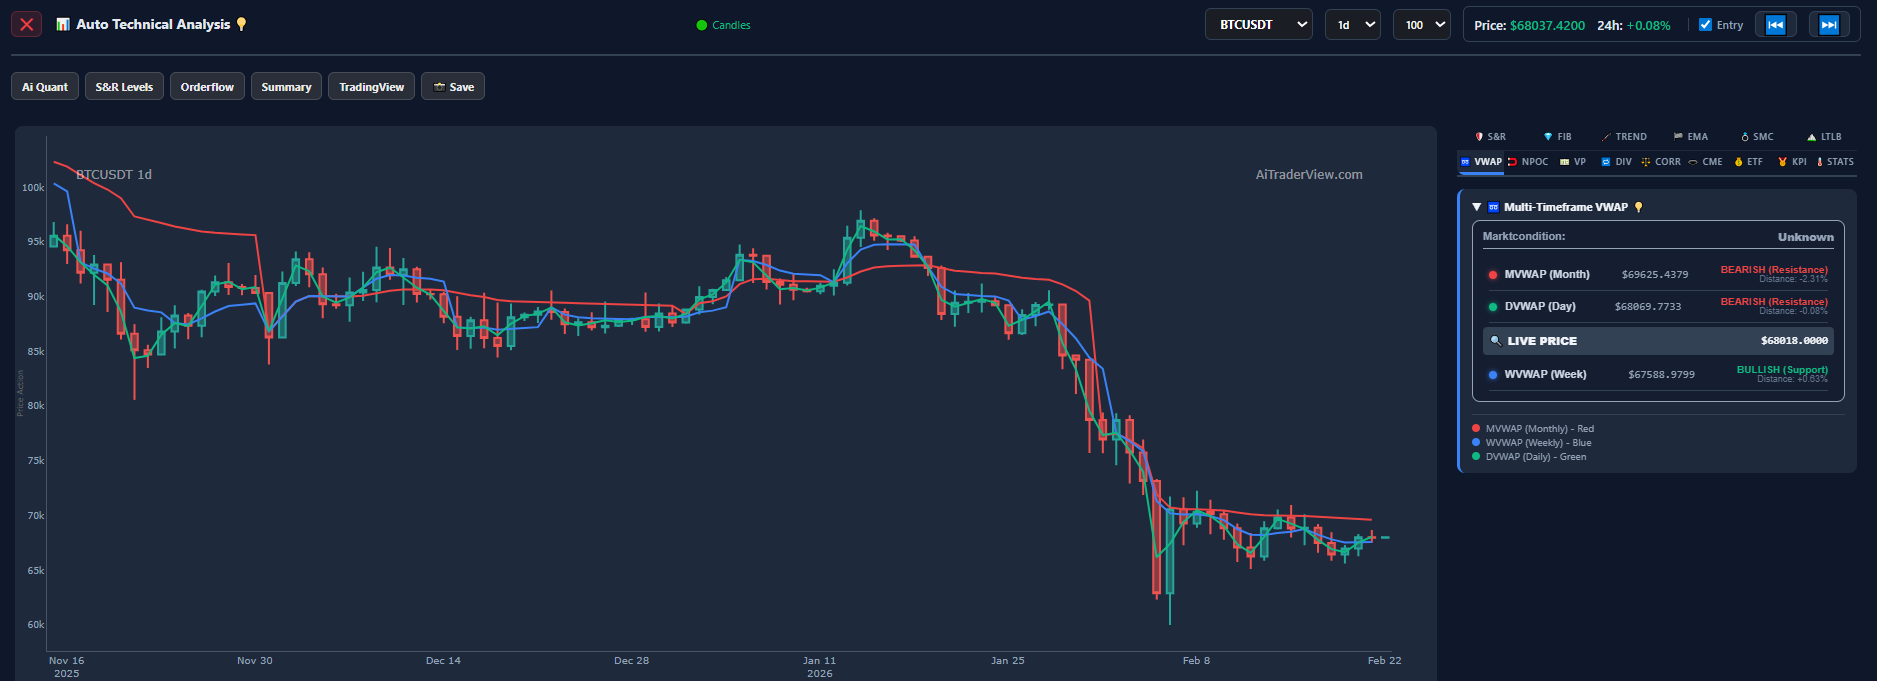
| 13. | vwap | Neutral | 0 | 0 | Trapped between Monthly/Daily VWAP (Resistance) and Weekly VWAP (Support). |
Final Conclusion & Calculation
- Total directional points: 8 (5 criteria are neutral/0 points)
- Bullish points: 1
- Bearish points: 7
Result:
- Bullish %: 1 / 8 ≈ 12.5%
- Bearish %: 7 / 8 ≈ 87.5%
The data paints an overwhelmingly bearish picture (87.5%). Although the price is finding local support on the Weekly VWAP and a demand zone (resulting in the current compression), the overall control clearly lies with the sellers given the rejection below the macro EMAs, the declining CVD, and the heavy overhead supply.
Based on the orderflow, volume profile, and market structure from your screenshots, the price is currently heavily compressed within a Symmetrical Triangle, wedged exactly between a demand zone ($67k) and a supply zone ($69k).
Here is the objective breakdown of what exactly needs to happen in the orderflow and price action for either the bullish or bearish scenario to play out.
📉 The Bearish Scenario (Trend Continuation)
Given our previous calculation (87.5% bearish data weighting), this is the path of least resistance. For this scenario to validate, the sellers must maintain their current control and force a breakdown of the current compression.
What needs to happen (Triggers & Confirmation):
- Support Breakdown: Price must decisively break and close below the lower trendline of the Symmetrical Triangle and the green demand zone (around $67,000).
- Loss of VWAP: The price must lose the Weekly VWAP support (blue line, currently at $67,588), turning it into overhead resistance.
- Orderflow Confirmation: We need to see a continuation of the declining CVD (Cumulative Volume Delta), indicating aggressive market-selling. Additionally, an increase in Open Interest accompanying the downward move would confirm that new short positions are entering the market to fuel the drop.
- Market Structure: Printing a new Lower Low (LL) below the recent swing low, confirming the continuation of the macro downtrend.
The Outcome: If these conditions are met, the next logical draw on liquidity will be the volume voids lower down on the profile, targeting the Value Area Low (VAL) of the broader macro range.
📈 The Bullish Scenario (Trend Reversal)
For a bullish reversal to occur, buyers need to step in with significant volume to absorb the overhead supply and break the current bearish market structure.
What needs to happen (Triggers & Confirmation):
- Resistance Breakout: Price must break out of the upper boundary of the Symmetrical Triangle and cleanly slice through the red overhead supply zone (around $69,000).
- Reclaiming Key Levels: Buyers must push the price back above the 23.6% Fibonacci level ($68,950) and flip the Daily/Monthly VWAP (currently acting as resistance) back into support. Crossing above the short-term EMAs (EMA 8 and EMA 20) is also a crucial early signal.
- Orderflow Shift: The most important catalyst will be a sharp reversal in the CVD. We need to see sustained, aggressive market-buying (positive CVD delta) coupled with rising Open Interest, indicating new long positions are opening, rather than just short-covering.
- Structural Change: A definitive Change of Character (ChoCH) to the upside on the daily timeframe, printing a new Higher High (HH).
The Outcome: If buyers achieve this, the massive bearish Fair Value Gaps (FVGs) sitting above $81,000 and $88,000 act as magnets. The price will likely gravitate toward the High Volume Node (HVN) and the Value Area High (VAH) of the volume profile to fill those inefficiencies.
If you want to make your own technical analysis, you can use our Autmated Technical Analysis software for FREE.
Pentoshi expects a retest of $74.000/80.000 in the next 2 weeks
Disclaimer: This article is strictly for informational purposes and does not constitute financial, investment, or trading advice. Digital assets are highly volatile, and regulatory frameworks (such as those outlined by the AFM, MiCA, and the SEC) are continuously evolving. Always conduct independent research and consult a licensed financial advisor before engaging with digital asset markets.
⚠️ RISK WARNING & AI DISCLOSURE
- This information is generated by Artificial Intelligence (AI) and complex algorithms. While advanced, these systems can contain errors or inaccuracies and are for educational purposes only.
- Technical analysis provides no guarantees; this information is purely informative.
- All discussed scenarios are hypothetical and do not constitute predictions or expectations.
- Past performance is not an indicator of future results.
- This is not financial advice and is not intended as a call-to-action for the reader.
- No implicit direction is claimed, and no specific behavior of market participants is suggested.