
Here is the Tecnical analysis of the orderflow and technical analysis charts for Bitcoin (BTC/USDT) (1d and 4h timeframe).
Part 1: Detailed Analysis
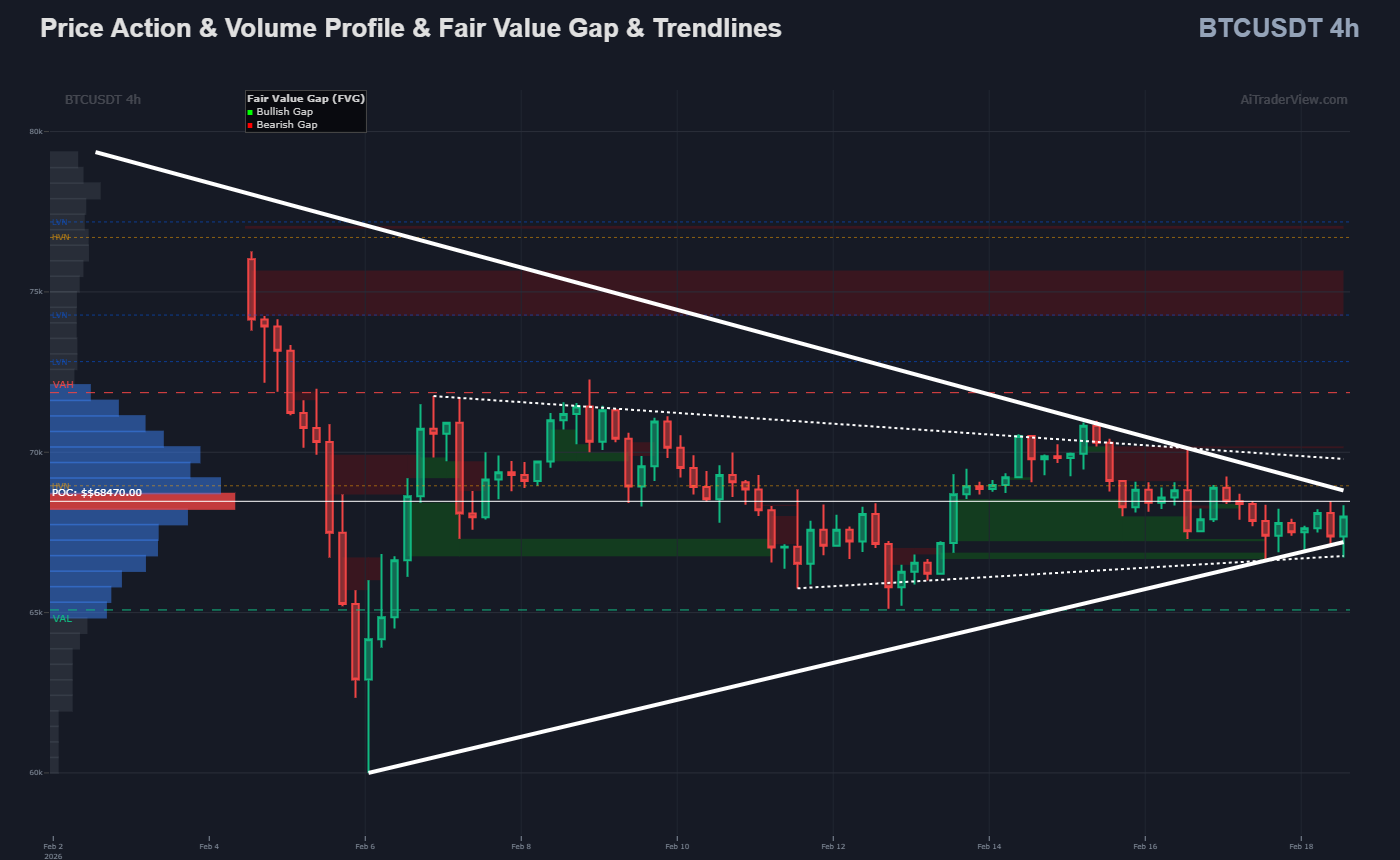
- Price & Volume Profile & FVG:
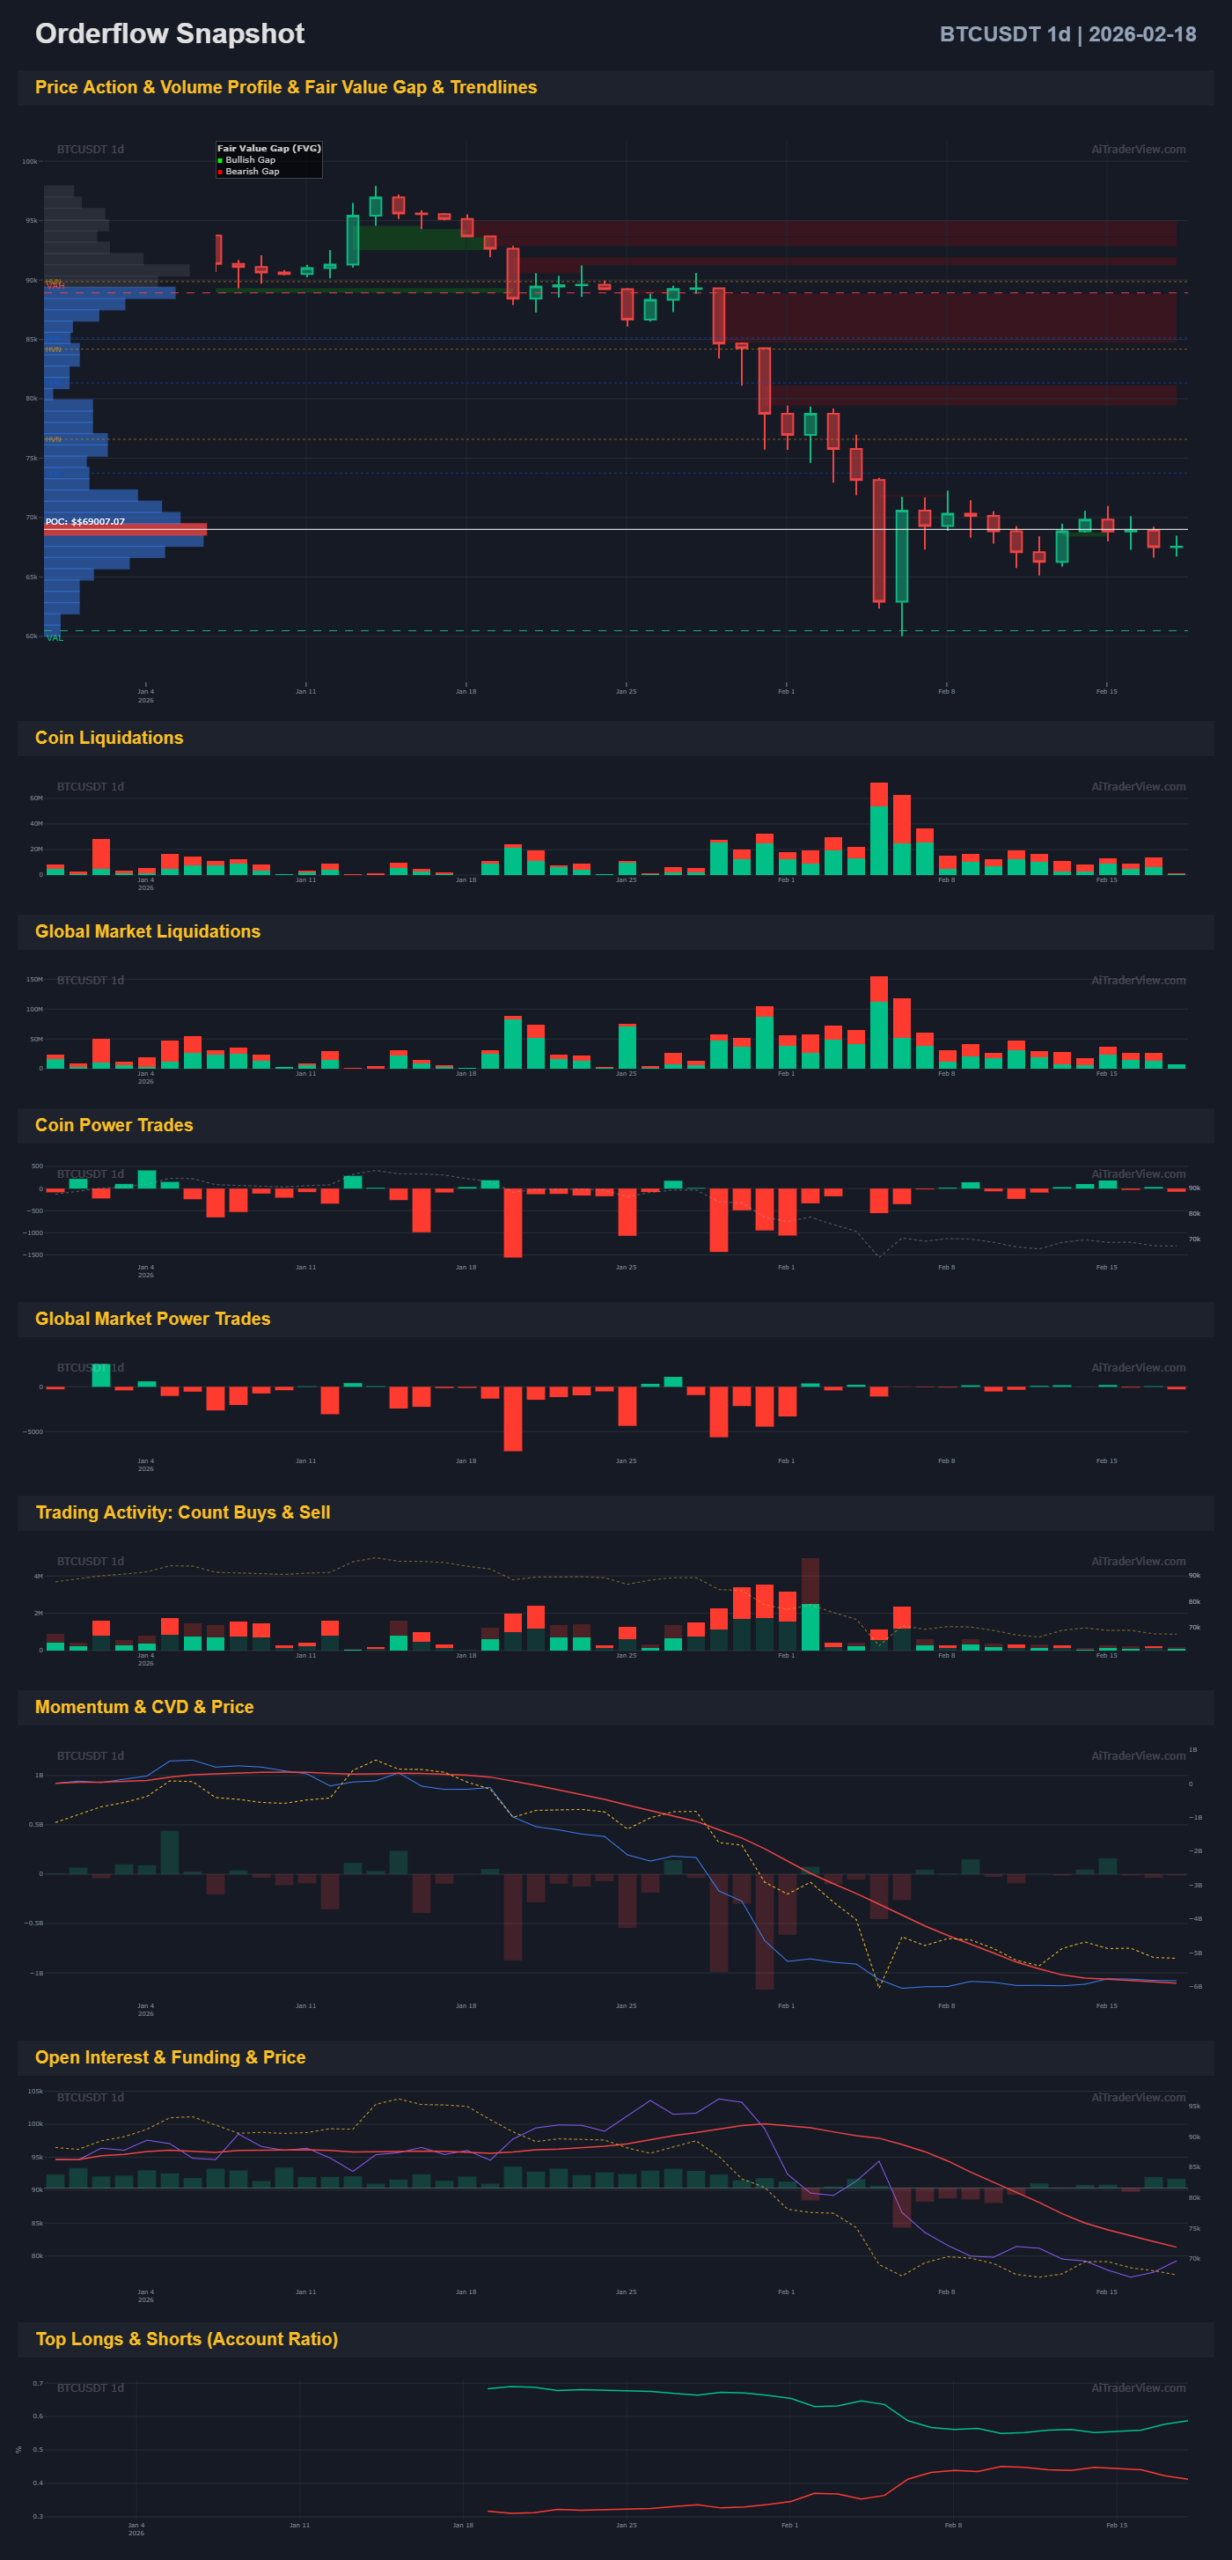
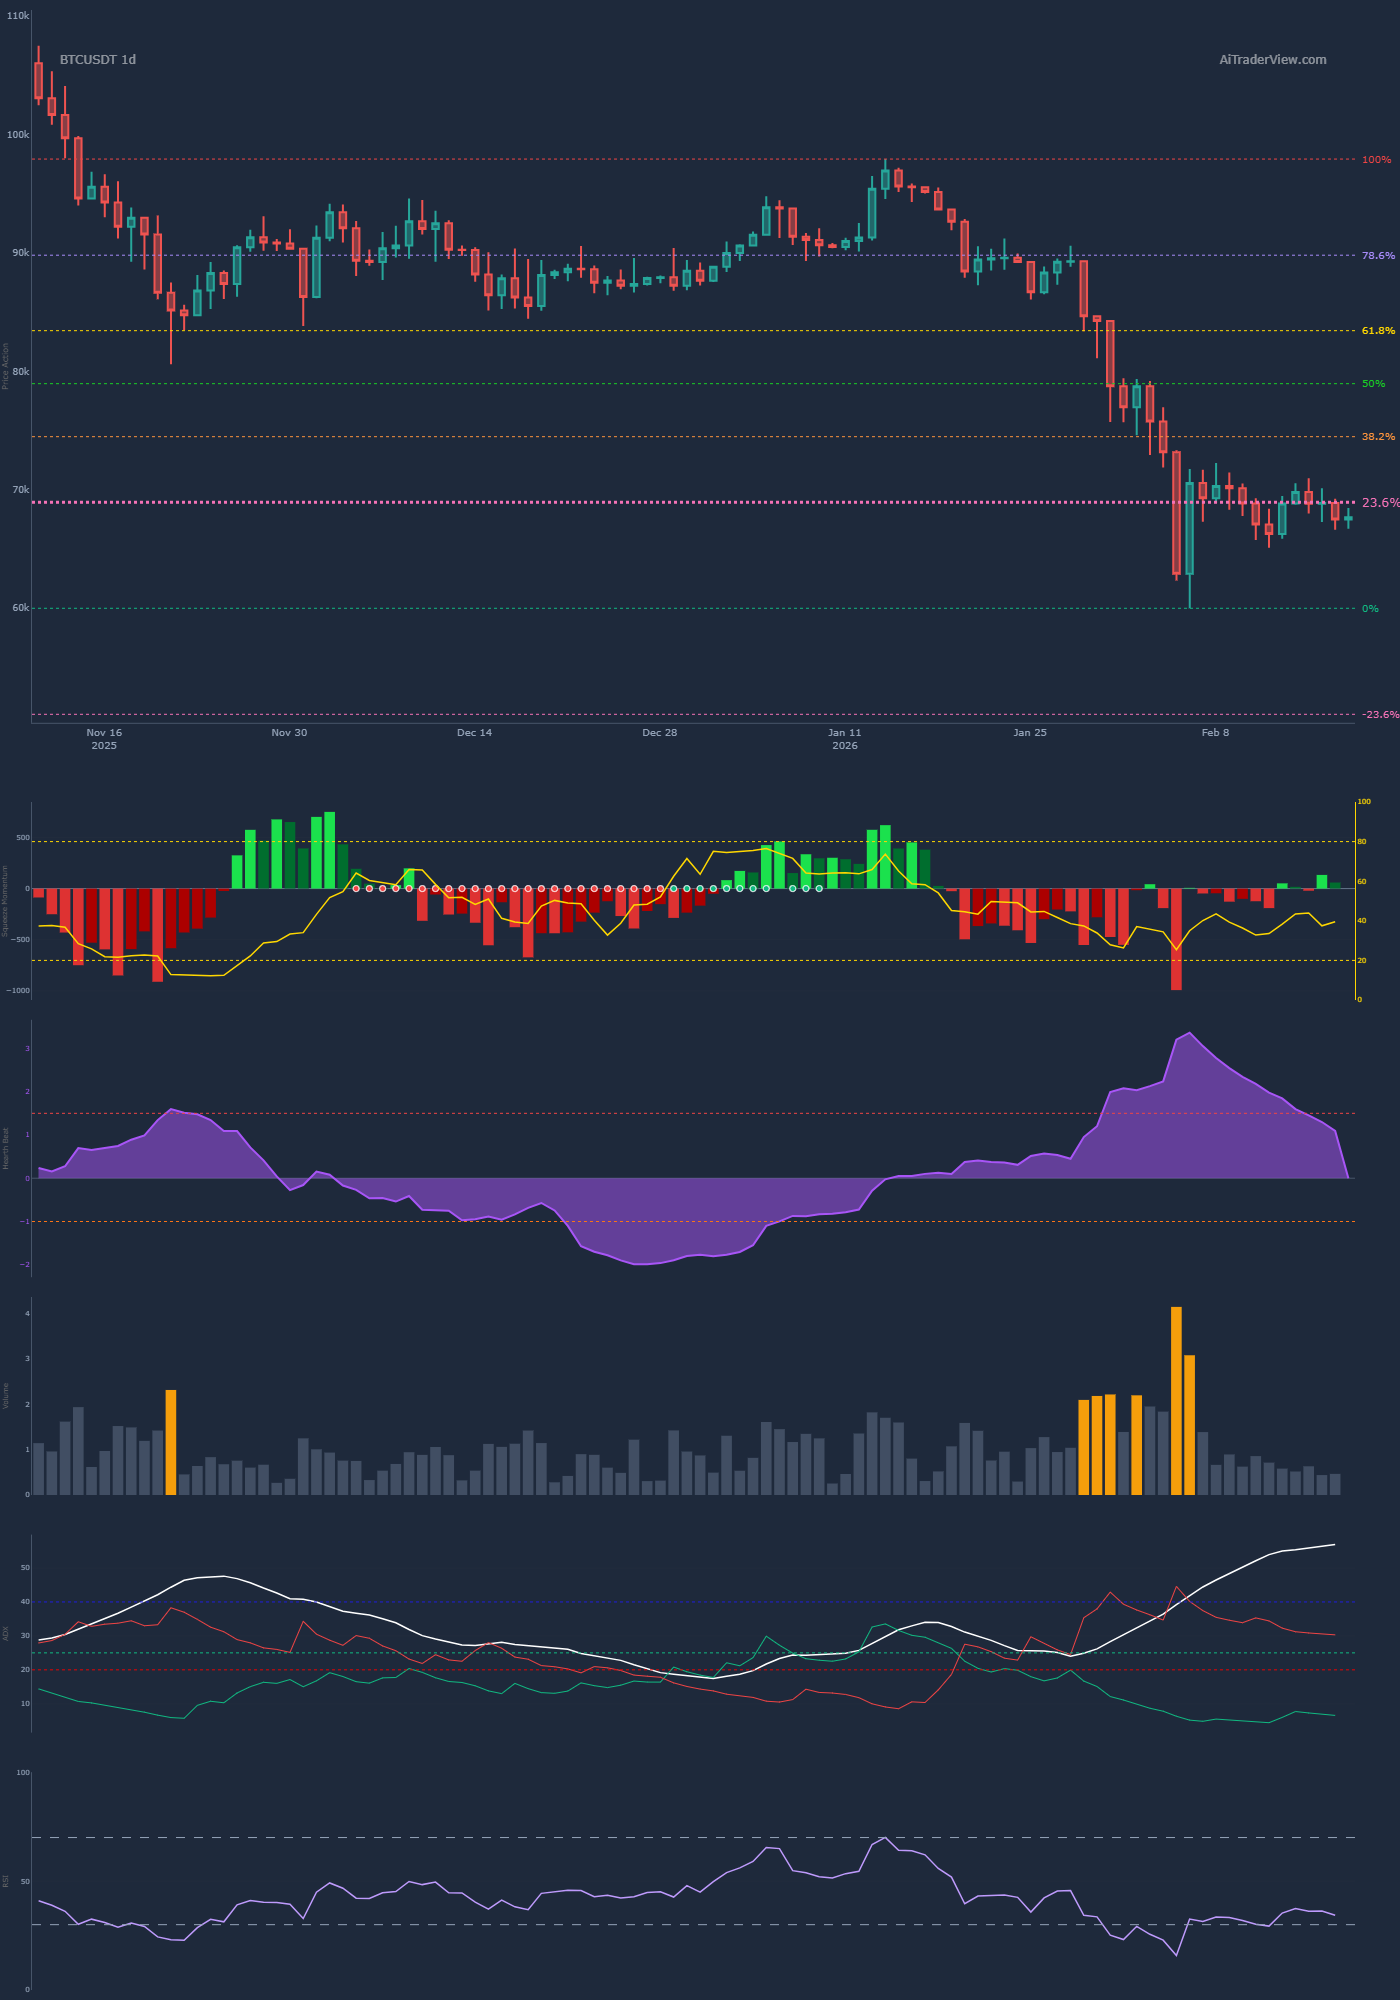
- 1D Timeframe: The price is in a clear downward trend, trading around the 69k level. There is a massive Bearish Fair Value Gap (FVG) visible between 75k and 85k, acting as heavy resistance. Price action has shown a strong decline from the 100k region.
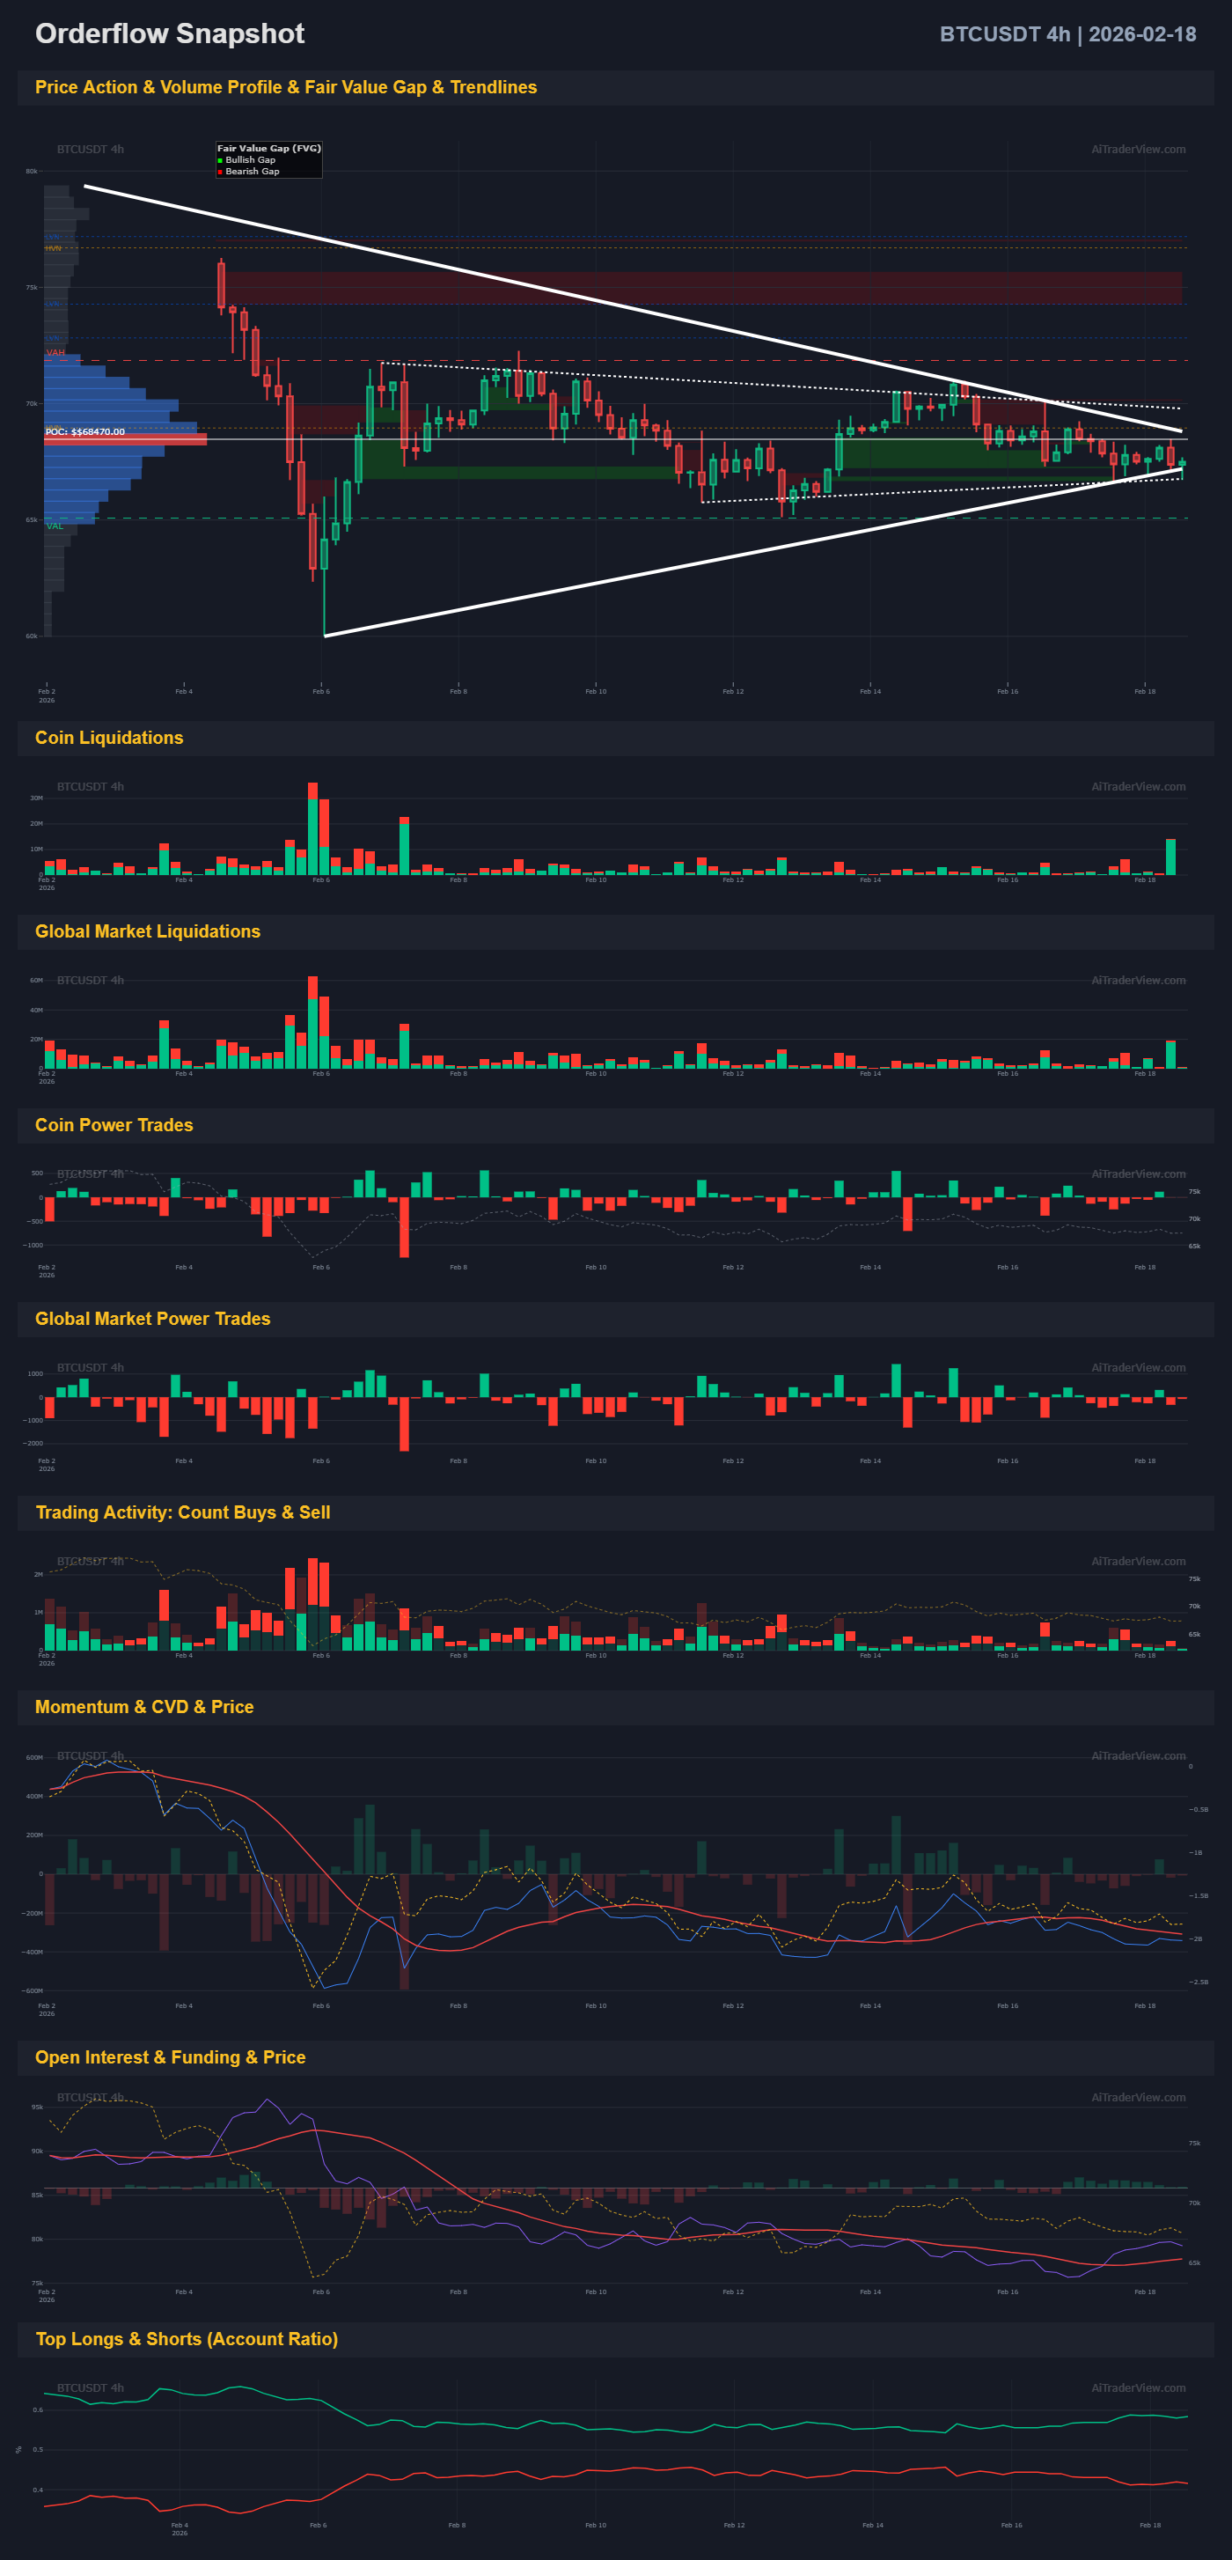
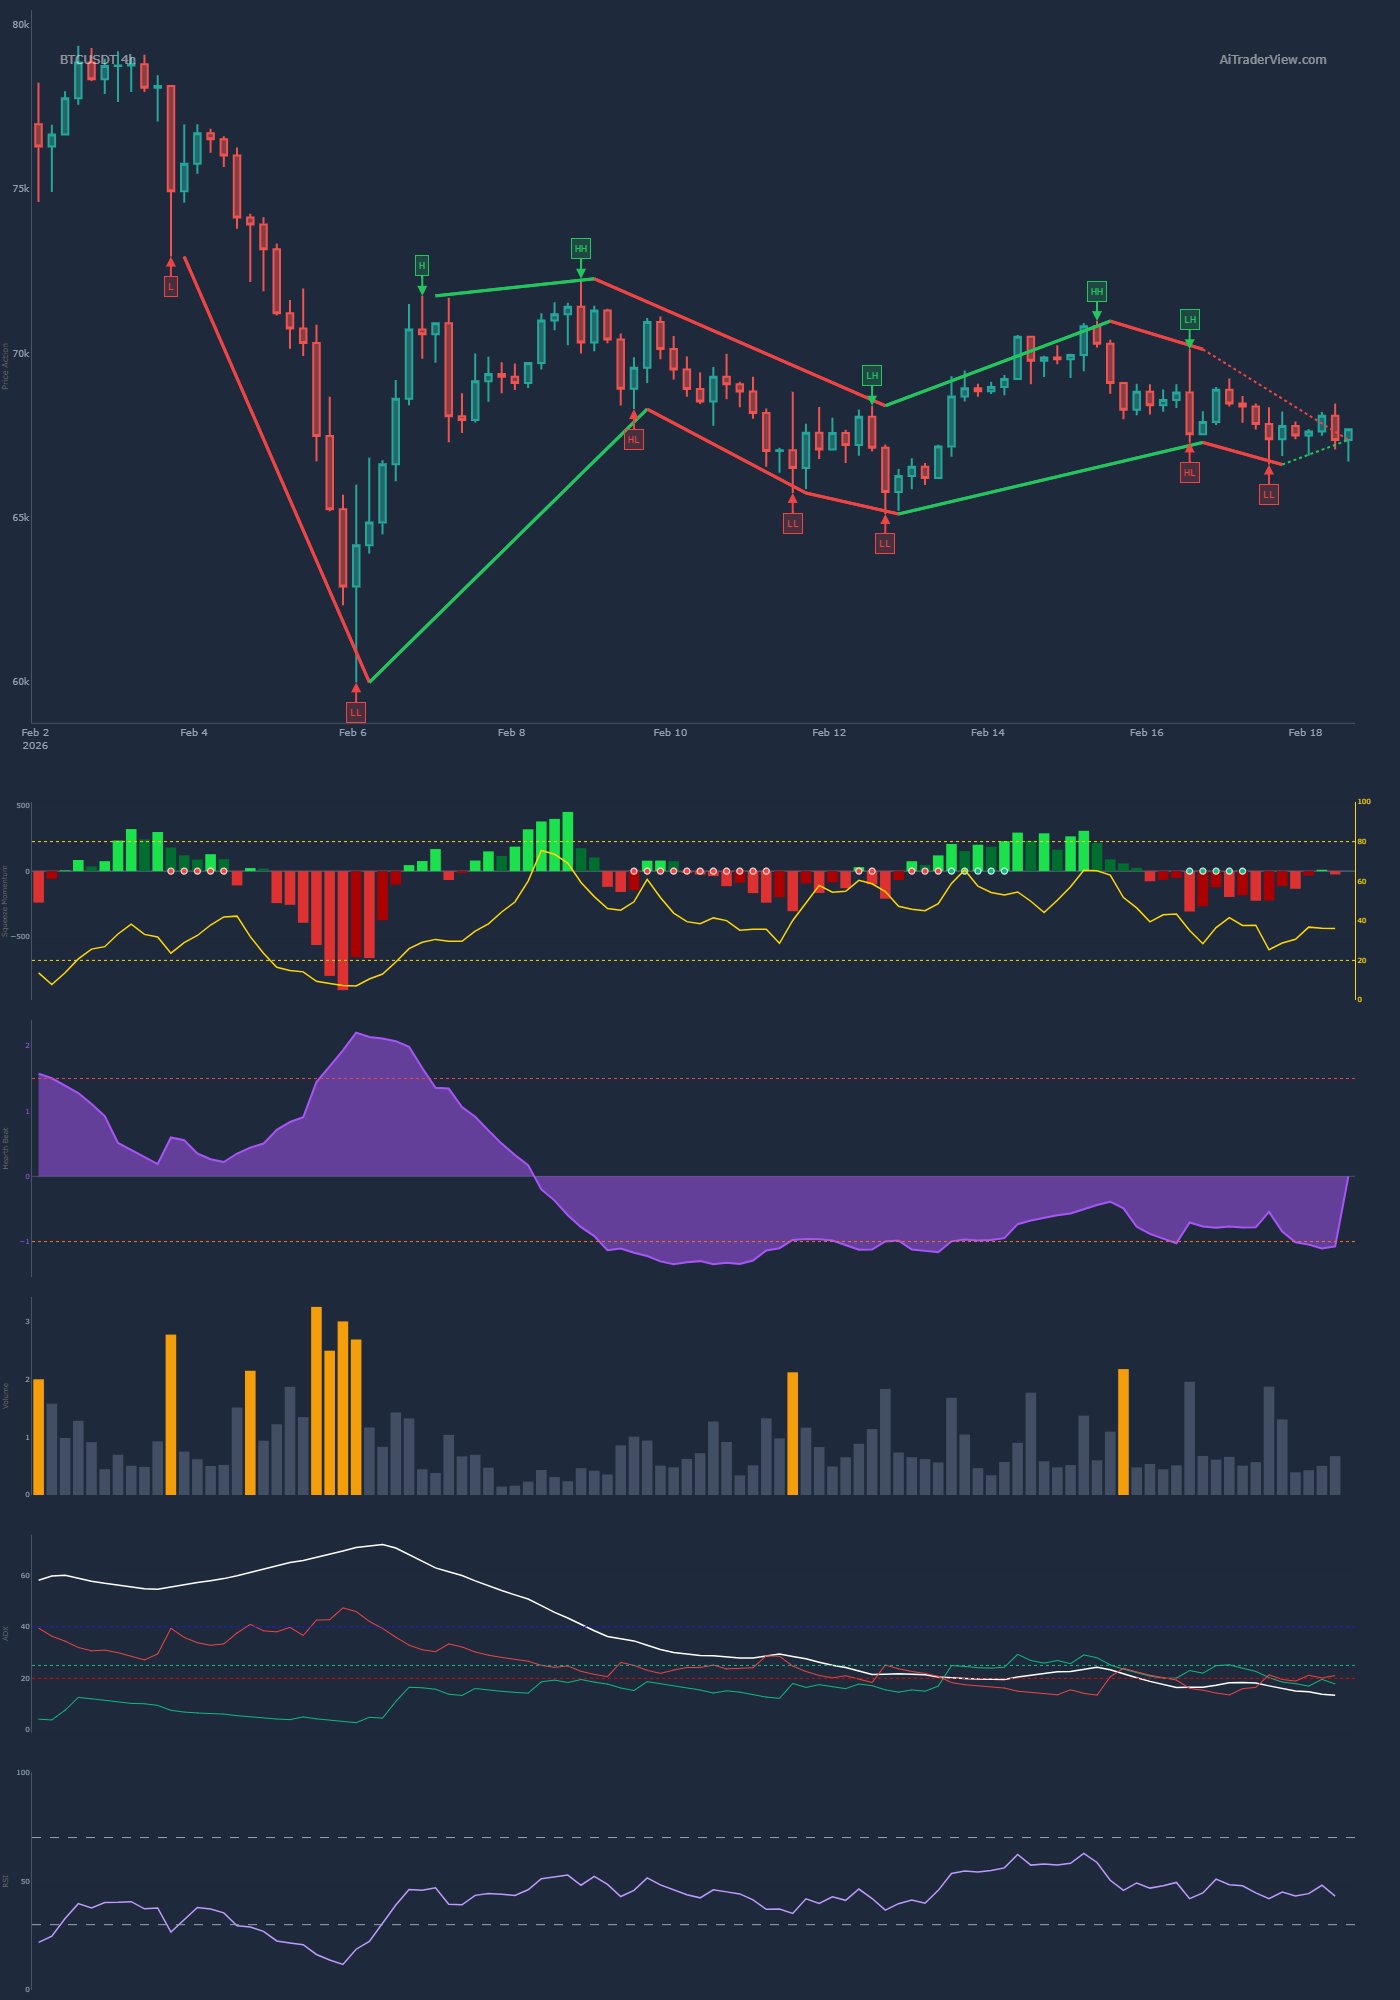
- 4H Timeframe: The price is consolidating within a symmetrical triangle (pennant). The 4H POC (Point of Control) sits around 69,170. The price is currently oscillating directly around this POC, indicating indecision and acceptance of this price level in the short term.
- CVD (Cumulative Volume Delta) & Momentum:
- CVD: The CVD on the daily chart shows a persistent downward trend, indicating consistent sell-side aggression. On the 4H chart, we see a flat CVD moving in tandem with the price consolidation; there is no significant bullish divergence (absorption) visible yet to confirm a bottom.
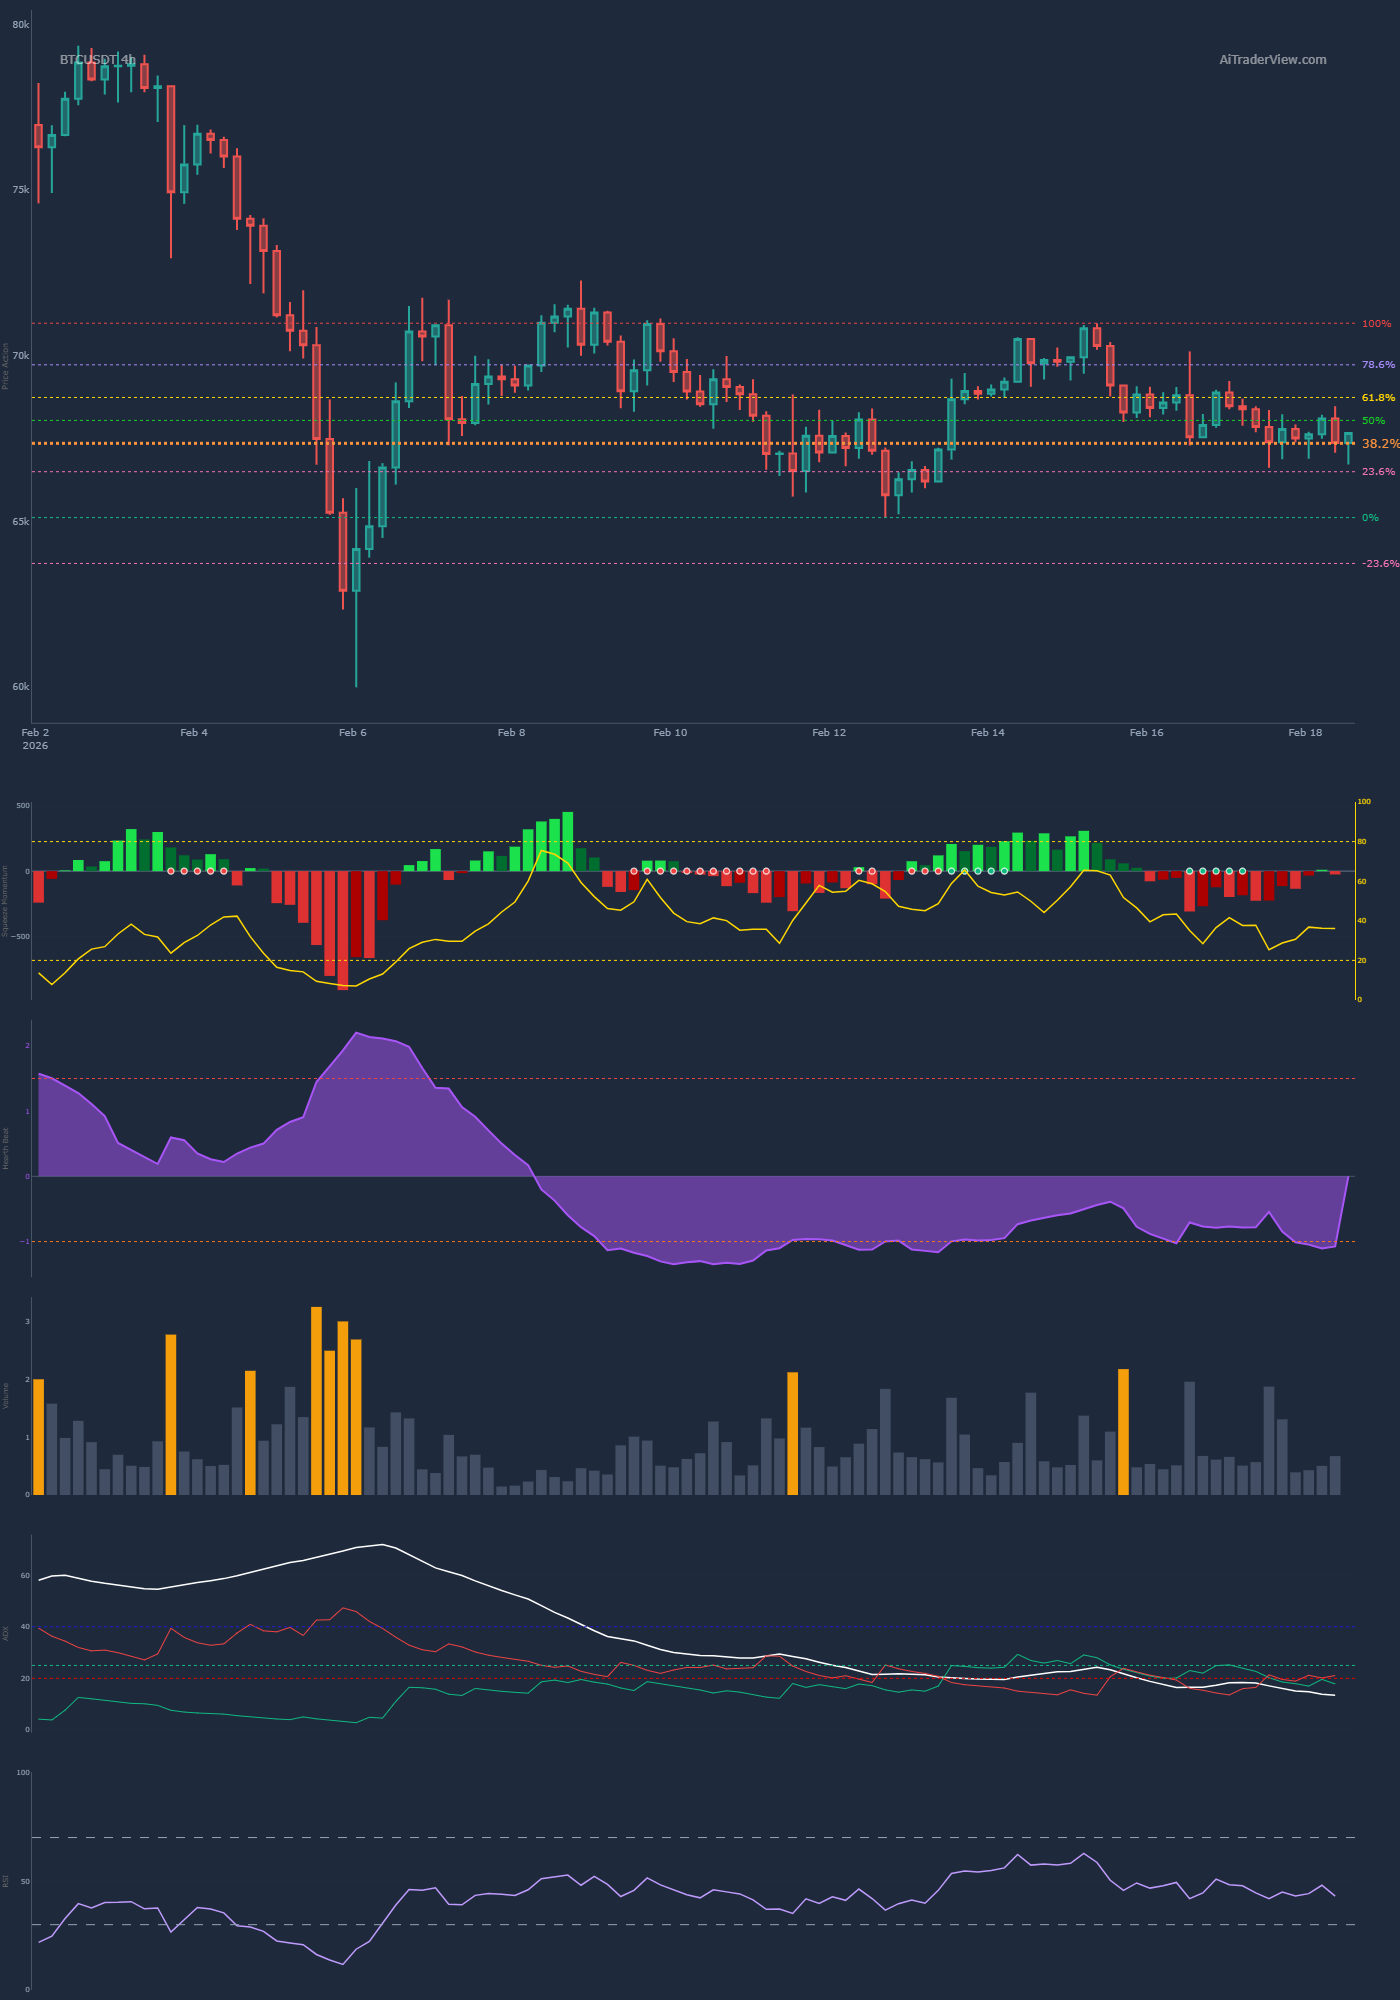
- Momentum: The RSI and Stochastic indicators on the daily are low (oversold region) but have not yet shown a powerful upward cross. The MACD histogram remains red/negative.
- Open Interest (OI) & Funding Rates:
- Open Interest: OI dropped significantly during the crash (from ~100k to current levels), indicating a large flush of leverage. Currently, OI is flat/stable. This means few new positions are being aggressively opened in this consolidation zone.
- Funding Rates: Specific funding rates are not numerically visible, but the combination of falling price and flat/dropping OI suggests a market reset, likely neutral to slightly negative.
- Long/Short Ratio & Trading Activity:
- Account Ratio: In the bottom section (“Top Longs & Shorts”), the Long Account Ratio (green line) remains high while the price drops. This is a classic bearish signal: retail traders are trying to “catch the knife” while smart money is likely on the sell-side or waiting.
- Activity: Buying and selling activity (Trading Activity) has decreased during the current consolidation; volume is drying up as expected in a triangle pattern.
- Power Trades:
- On the “Coin Power Trades” and “Global Market Power Trades,” various red spikes (sell orders) are visible during the decline. In the current range, power trades are mixed and relatively small in size. There are no clear whale buy walls visible aggressively pushing the price up.
- Liquidations:
- A large long liquidation cascade occurred during the drop to 63k (tall green bars in the liquidation chart). Currently, it is quiet regarding liquidations. Liquidation levels are likely stacked just above and below the current triangle structure (above 72k for shorts, below 66k for longs).
- Fibonacci:
- 4H Analysis: The price faced a perfect rejection on the 4H chart at the 0.618 Fib (Golden Pocket) of the recent swing high (~72k). This is a strong technical bearish signal. Currently, the price is fighting to hold the 0.382 and 0.5 levels. Losing the 0.382 could lead to a retest of the lows.
- Trend:
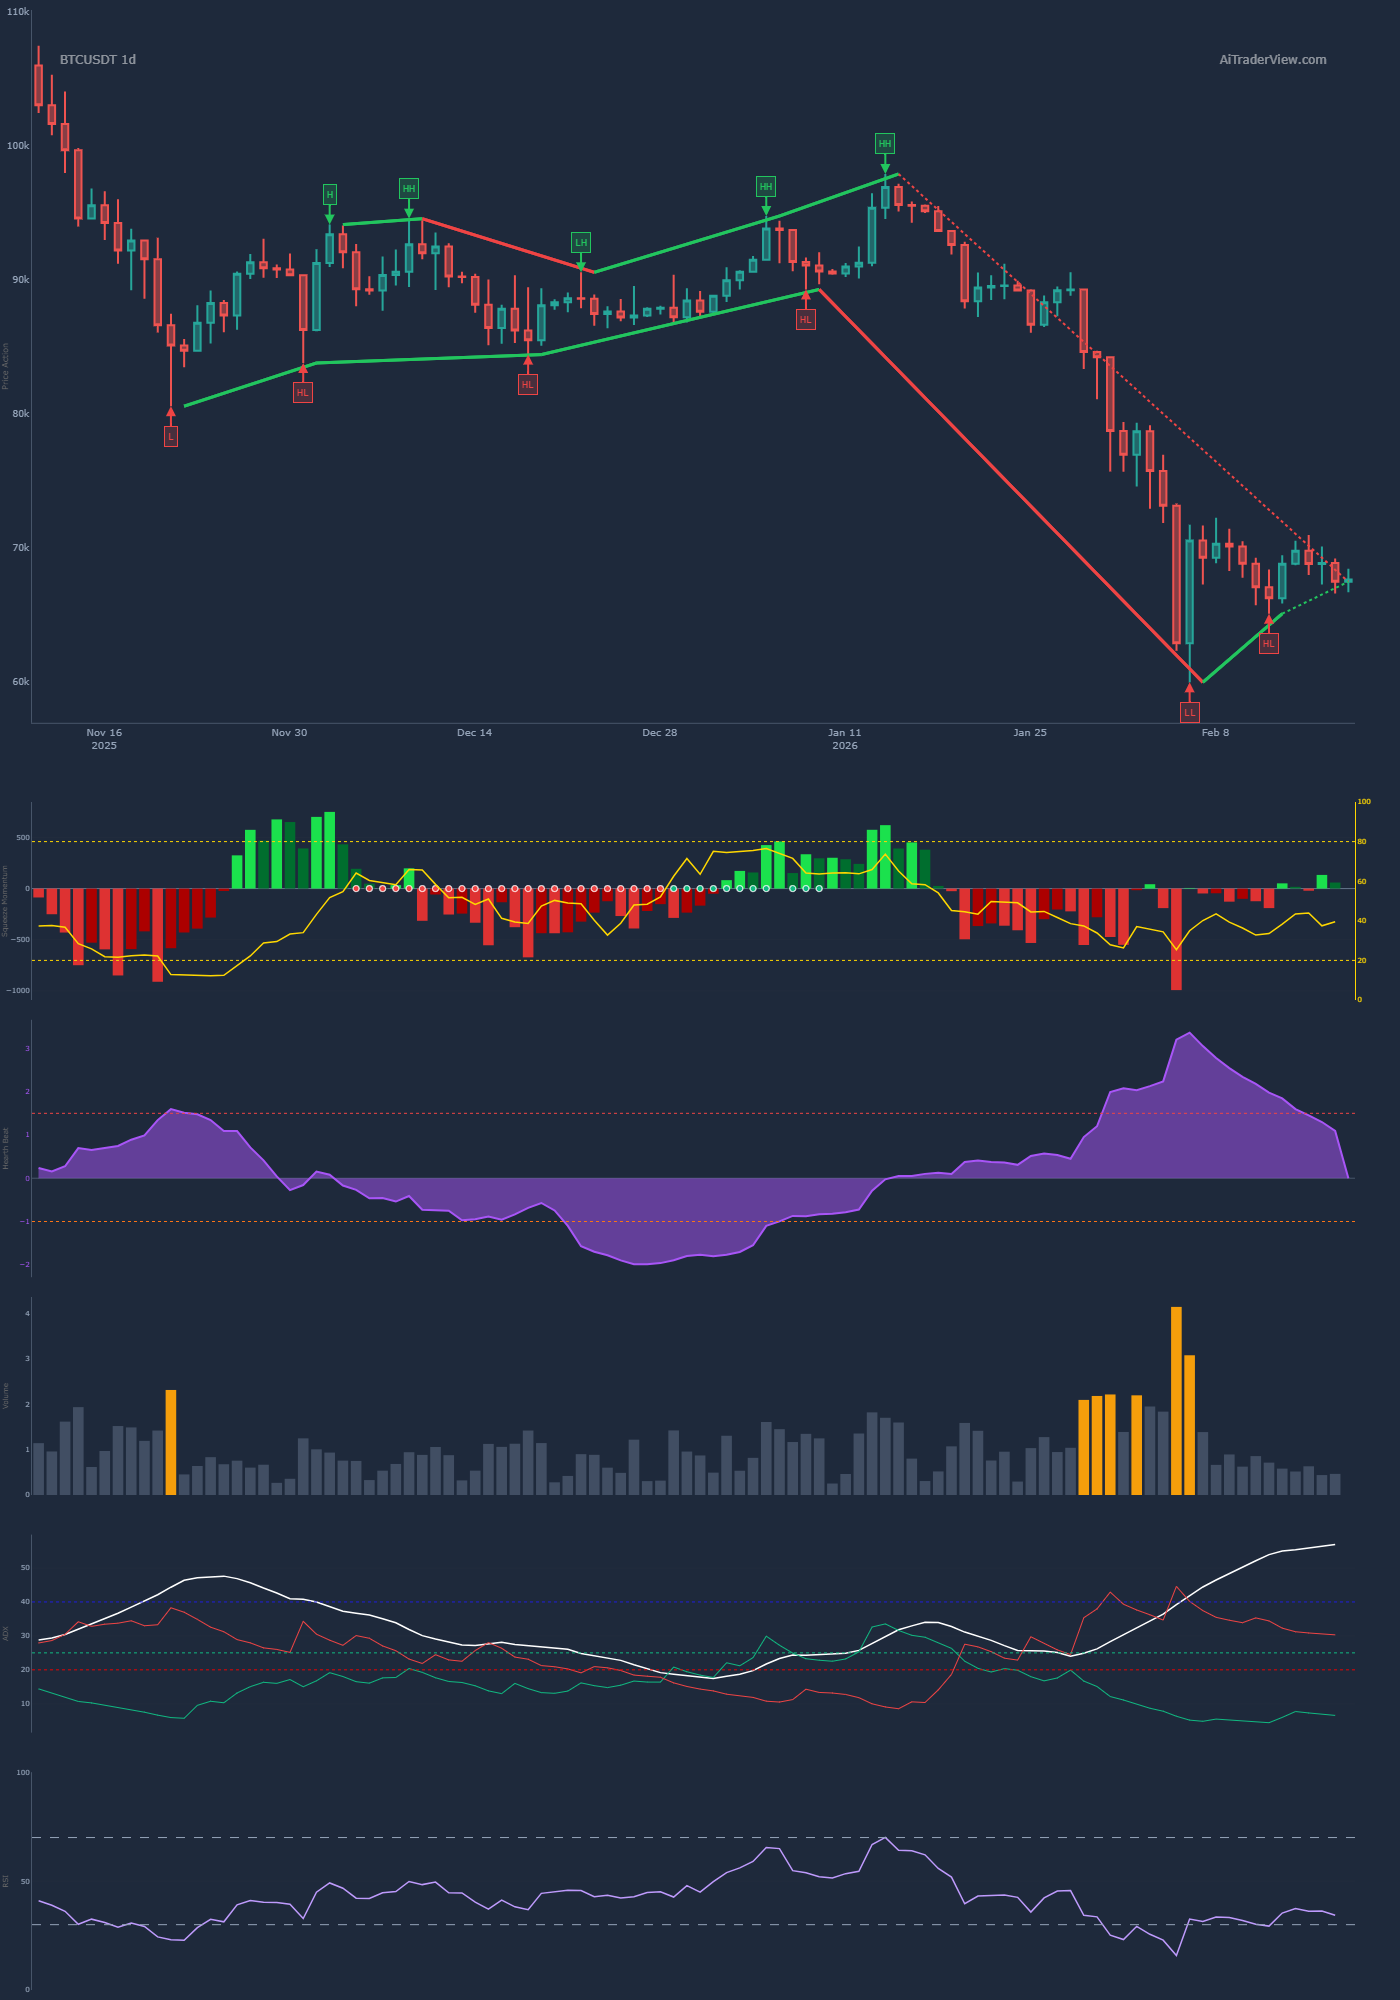
- Daily: The structure is undeniably Bearish. We see a clear sequence of Lower Highs (LH) and Lower Lows (LL).
- 4H: Short-term structure is neutral/compression (Triangle). Local Higher Lows are being made, but as long as the Lower Highs remain intact and price stays below the Golden Pocket, the dominant trend remains downward.
Part 2: Scoring and Conclusion
| Component | Bullish Score | Bearish Score | Neutral | Reason (Key points) |
| Price vs POC | [ ] | [ ] | [1] | Price on 4H POC, ranging. No clear bias. |
| Trend Structure | [ ] | [1] | [ ] | Daily dominant bearish (LL/LH), 4H consolidation. |
| Fibonacci Level | [ ] | [1] | [ ] | Hard rejection at 0.618 Golden Pocket (~72k). |
| CVD & Momentum | [ ] | [1] | [ ] | CVD trending down (net selling), no strong absorption. |
| Open Interest | [ ] | [ ] | [1] | OI is flat/consolidated after the flush. |
| Funding Rates | [ ] | [ ] | [1] | Not visible/specific, context suggests reset. |
| L/S & Activity | [ ] | [1] | [ ] | Retail (Accounts) heavy Long in downtrend = contrarian bearish. |
| Liq & Power Trades | [ ] | [ ] | [1] | Major liquidations passed, currently quiet/mixed. |
| TOTAL | 0 | 4 | – | – |
Calculation:
- Bullish % = (0 ÷ 8) × 100% = 0%
- Bearish % = (4 ÷ 8) × 100% = 50%
- (50% of factors are Neutral/Waiting)
Final Verdict:
Sentiment is predominantly bearish to neutral. The trend on higher timeframes is downward, and the recent rejection at the Golden Pocket confirms weakness. However, the market is currently in consolidation (triangle) around the POC.
⚠️ RISK WARNING & AI DISCLOSURE
- This information is generated by Artificial Intelligence (AI) and complex algorithms. While advanced, these systems can contain errors or inaccuracies and are for educational purposes only.
- Technical analysis provides no guarantees; this information is purely informative.
- All discussed scenarios are hypothetical and do not constitute predictions or expectations.
- Past performance is not an indicator of future results.
- This is not financial advice and is not intended as a call-to-action for the reader.
- No implicit direction is claimed, and no specific behavior of market participants is suggested.