

Similar to ETH, we see a market that has taken a heavy hit. The high-timeframe structure (1D) is undeniably bearish, while the lower timeframe (4H) is attempting to form a temporary bottom, but completely lacks conviction in buying power.
1. Price & Volume Profile & FVG
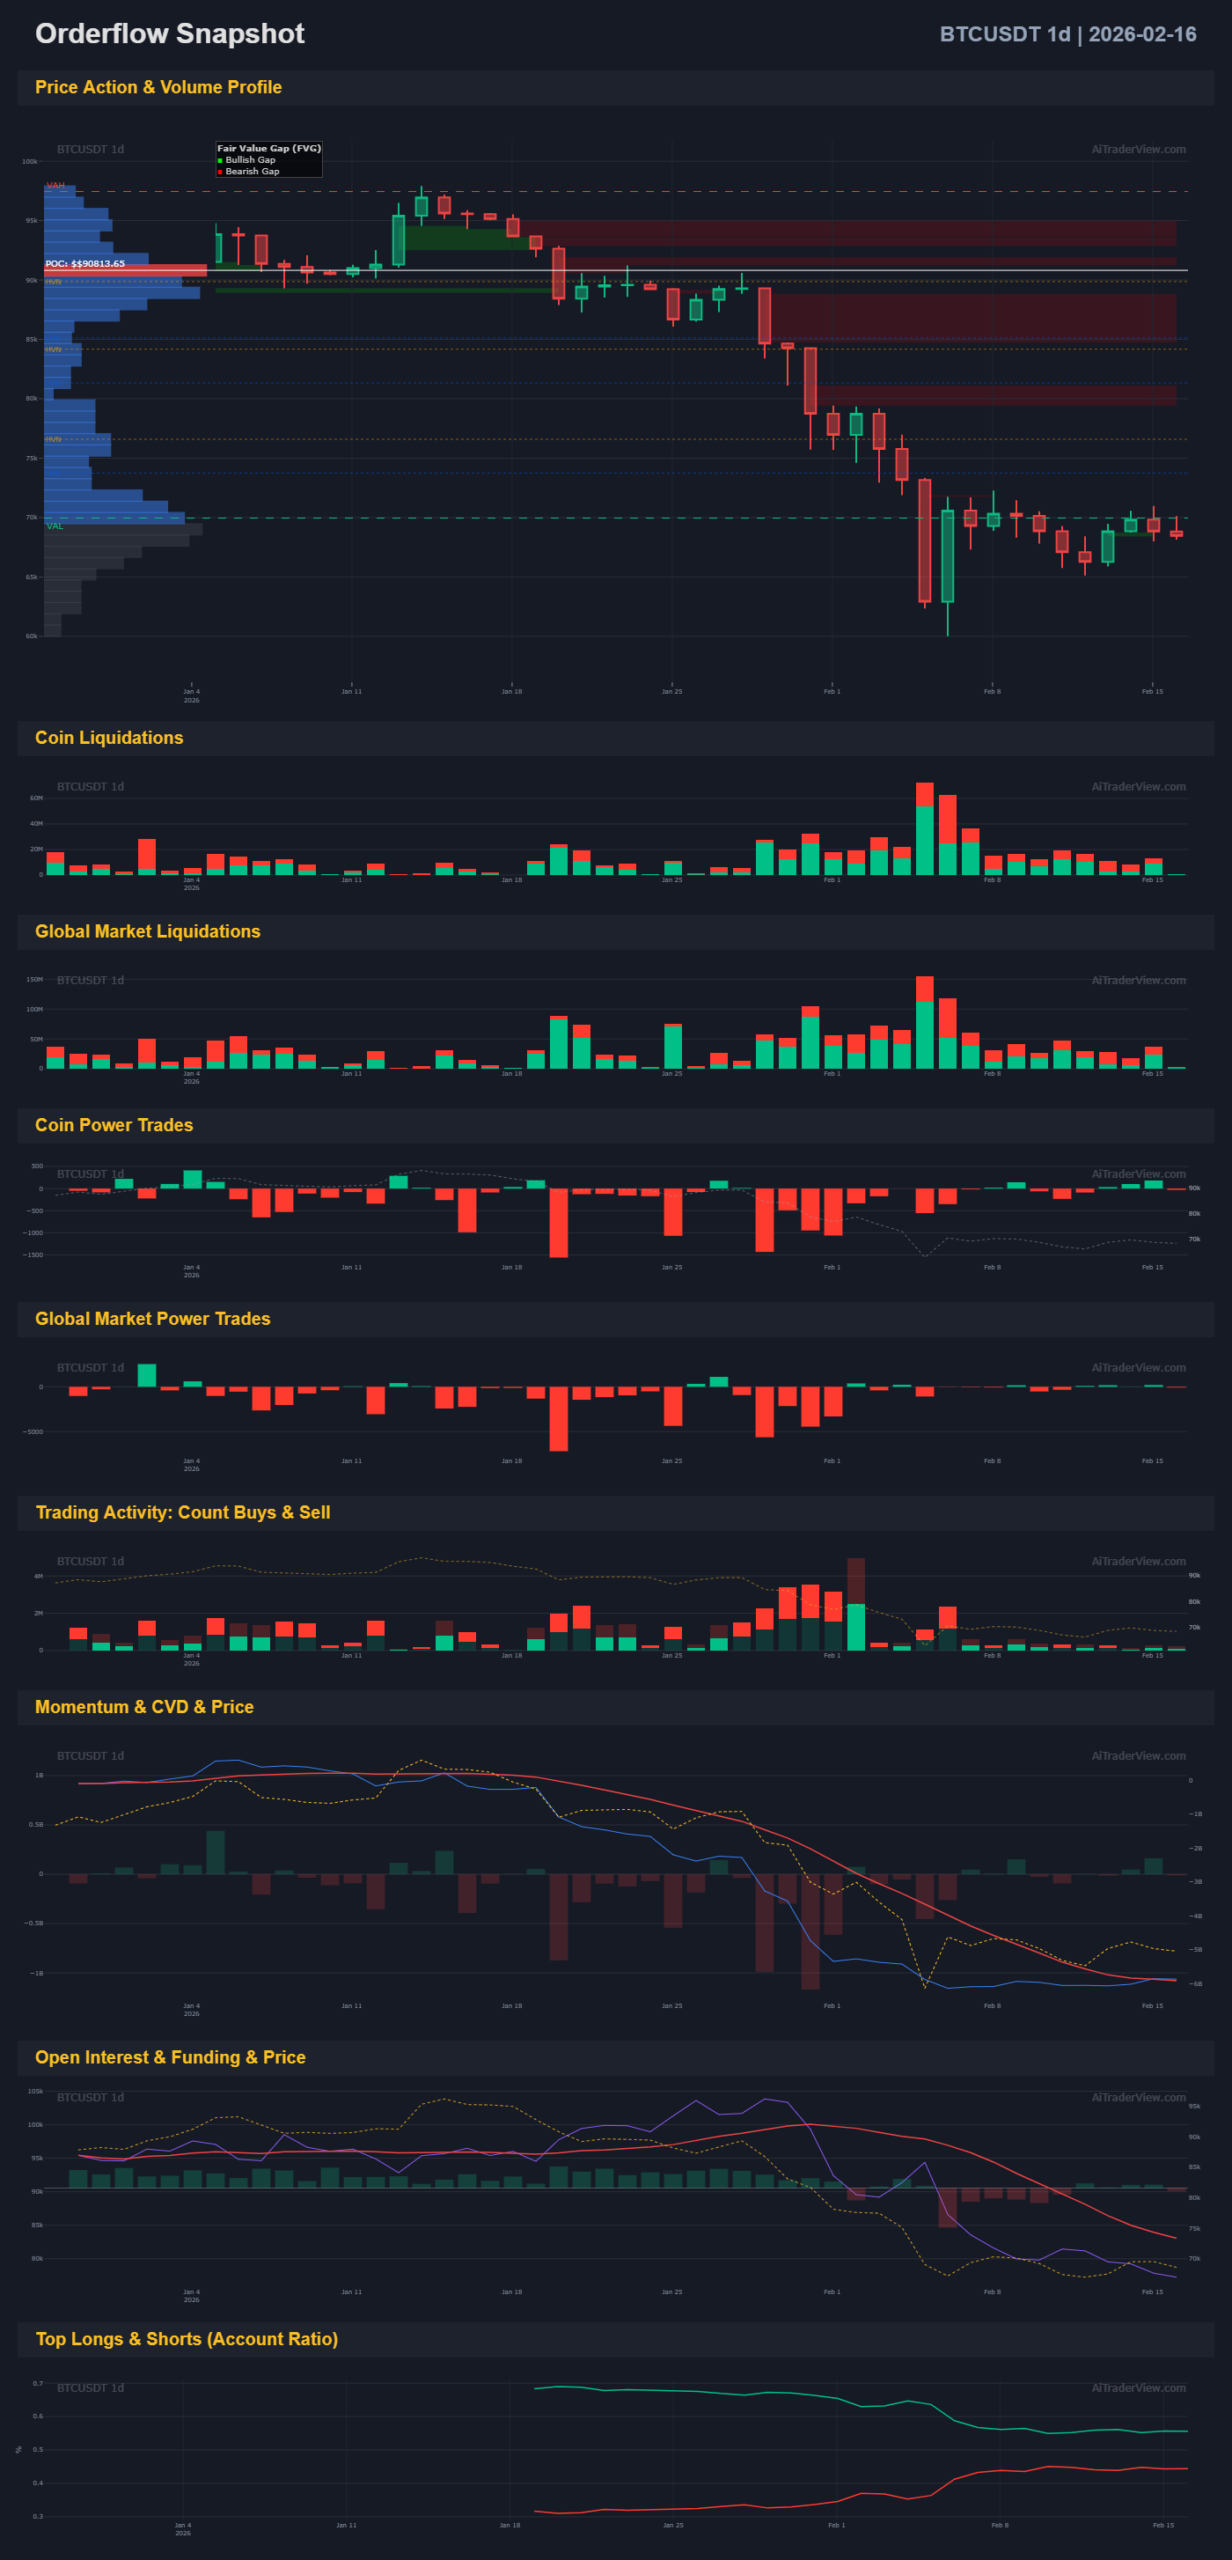
- 1D (Daily): Price is trading well below the Point of Control (POC) (the red line with the largest volume profile on the left). This puts us in ‘discount’ territory, but the market is not accepting these lower prices as a buying opportunity yet. There is a clear ‘gap’ down. The red FVG zones above current price act as heavy resistance.
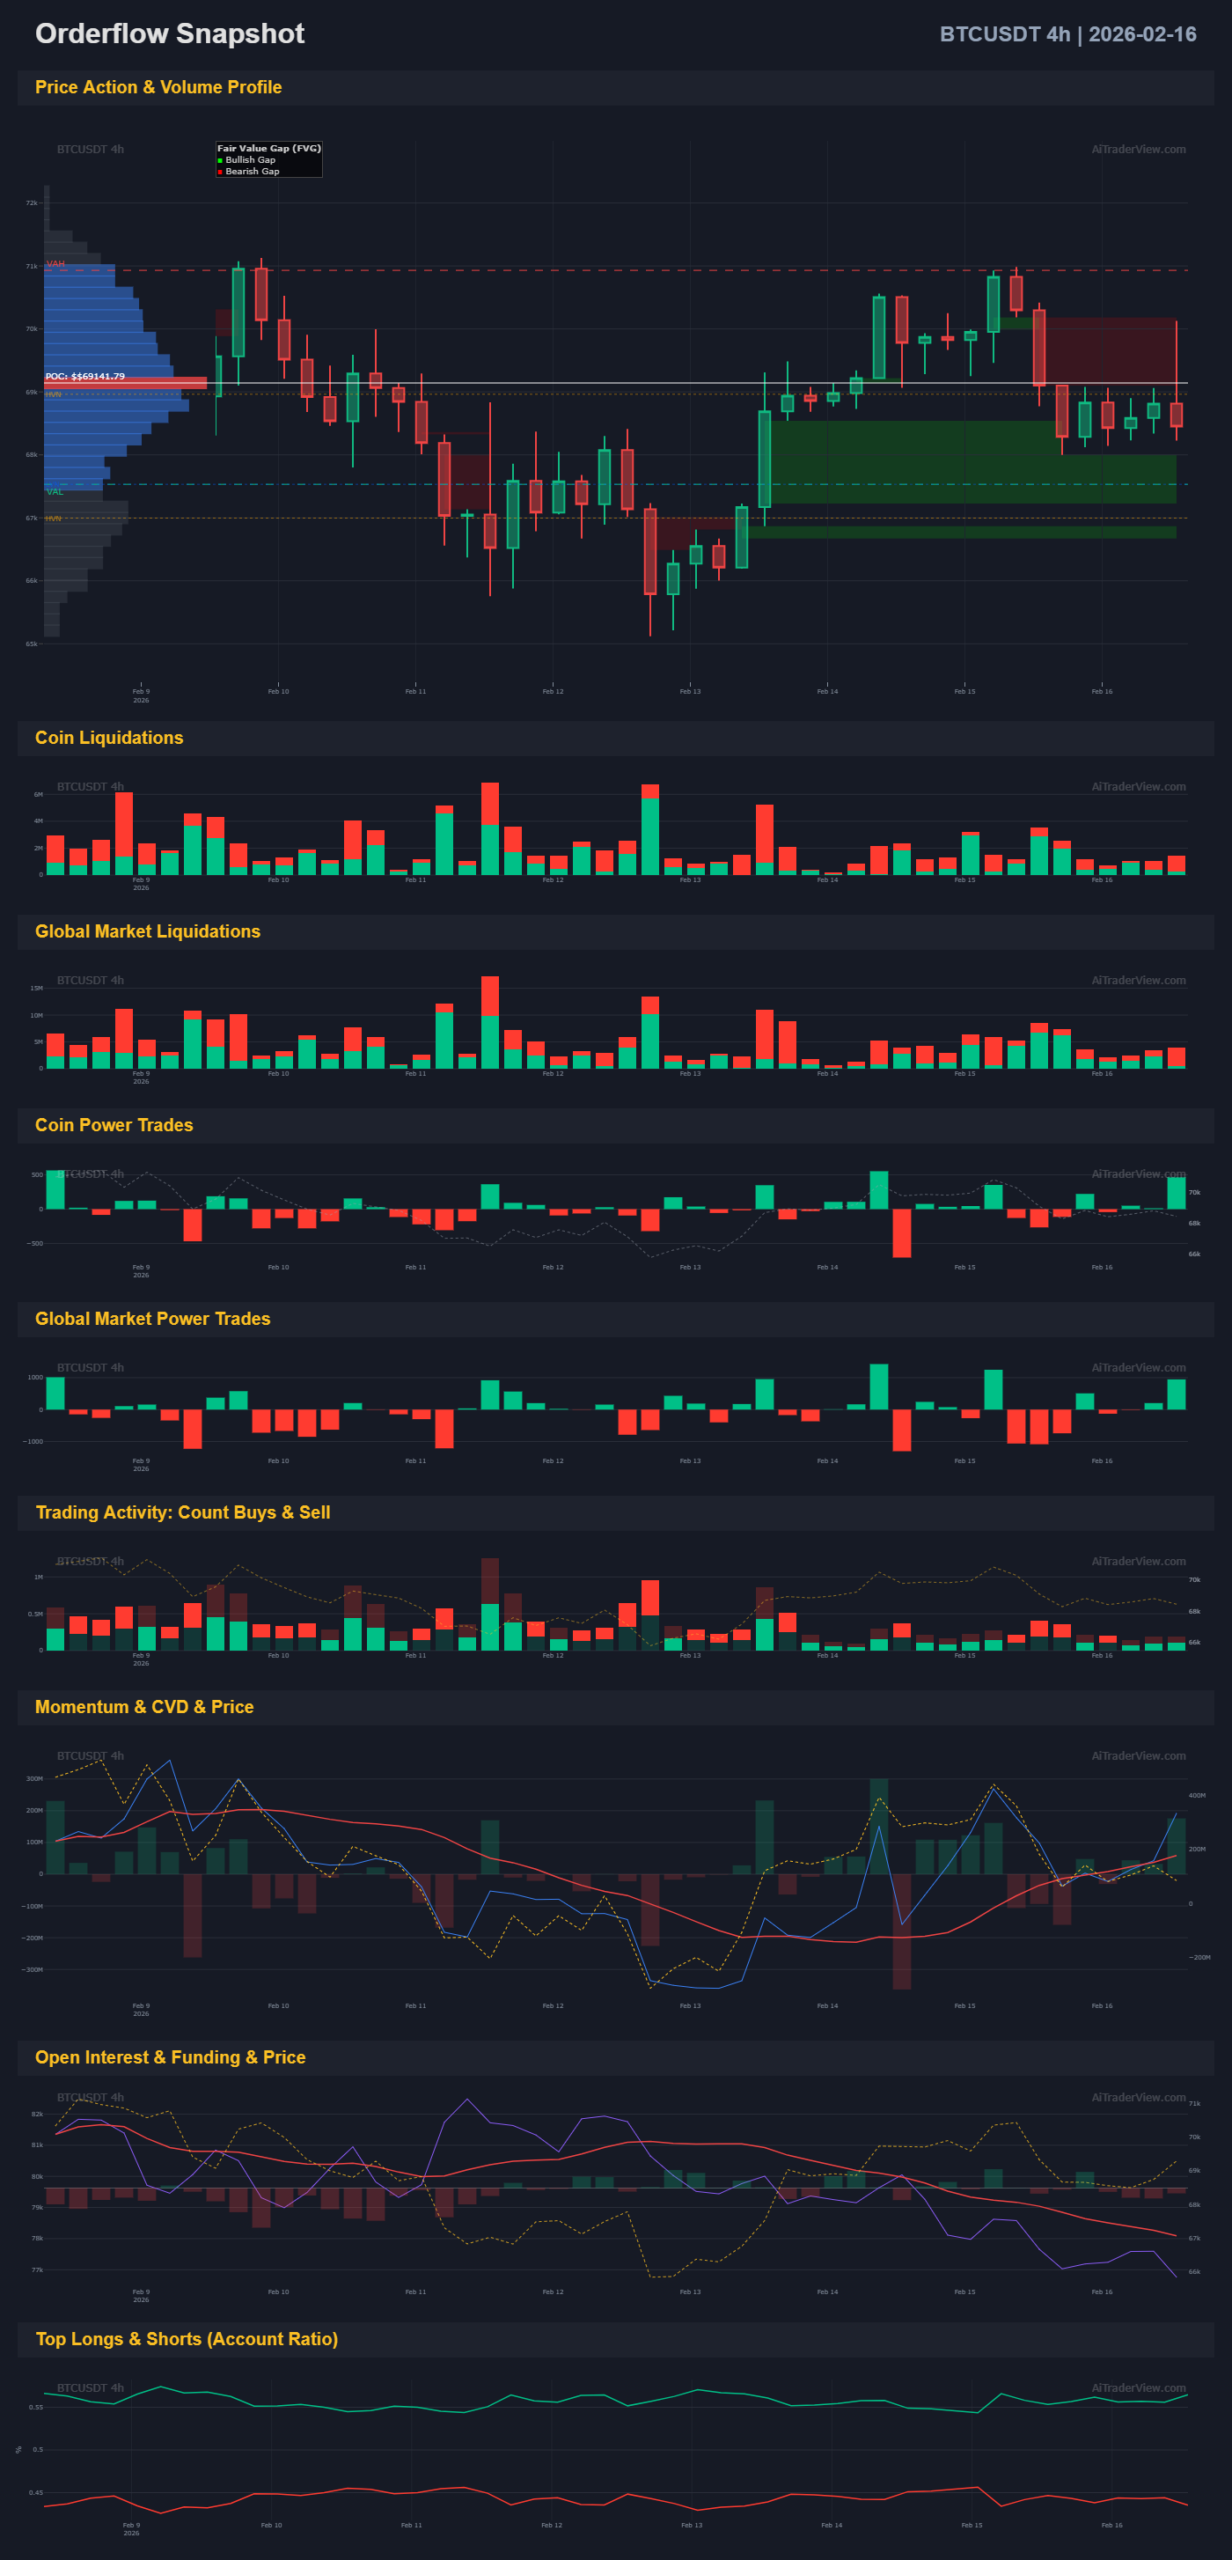
- 4H: On the 4-hour chart, price found support in a Bullish FVG (the green zone). However, the bounce from here is weak. Price is consolidating in a tight range. We see an attempt to return to the local POC, but every rally is quickly punished.
2. CVD & Momentum
- CVD (Cumulative Volume Delta): On the 1D chart (the ‘Momentum & CVD’ panel), this is extremely bearish. The orange CVD line is diving aggressively, much steeper than the price itself. This is a classic bearish divergence: aggressive market selling (sells hitting bids) is occurring, while price is being artificially propped up by passive limit orders. Once those limit orders are exhausted, price often drops further.
- Momentum: On both timeframes, momentum is negative. The RSI-like lines in the momentum panel show no powerful ‘oversold’ bounce signals.
3. Open Interest & Funding
- Open Interest (OI): OI (white line in the second-to-last panel) dropped significantly during the crash and is now consolidating sideways at lows. This indicates capital flight. Traders are closing positions and not opening new ones. This confirms a lack of interest in buying at current levels.
- Funding: Funding rates are neutral to slightly positive. There is no extreme negative funding that could lead to a short squeeze. The market is ’empty’.
4. Long/Short Ratio & Trading Activity
- L/S Ratio: ‘Top Longs’ (green line at the bottom) remain dominant and are even rising slightly relative to shorts. This is a contrarian bearish signal. Retail traders (“Top Accounts” are often retail on exchanges) are trying to catch the knife (long), while price keeps dropping. As long as this ratio doesn’t ‘reset’ (longs capitulate), the pressure remains to the downside.
- Trading Activity: Transaction counts (buys & sells) are low and decreasing. Volatility is drying up, which is often a precursor to a new impulsive move (usually in the direction of the prevailing trend: down).
5. Power Trades
- Power Trades: On the 1D chart, we see mostly red outliers in the past (selling pressure). On the 4H chart, the picture is mixed with small outliers, but no structural buy pressure from whales pushing the price up.
6. Liquidations
- Liquidations: The major liquidation events (high bars on the left of the 1D) are behind us. Recently on the 4H chart, we see small green spikes (short liquidations) on every mini-bounce, but this doesn’t lead to higher prices. This indicates weakness: shorts are covering, but there are no new spot buyers.
Scoring Table
Below is the quantification of the BTC data.
| Component | Bullish Score | Bearish Score | Neutral | Notes |
| Price vs POC | 0 | 1 | 0 | Price well below Daily POC. Resistance is dominant. |
| Trend Structure | 0 | 1 | 0 | Lower Lows, Lower Highs. 4H consolidation is weak (bear flag-ish). |
| CVD | 0 | 1 | 0 | CVD diving hard (aggressive sellers), steeper than price drop. |
| Momentum | 0 | 1 | 0 | No recovery strength visible. |
| Open Interest | 0 | 0 | 1 | Flat and low. No influx of fresh capital. |
| Funding | 0 | 0 | 1 | Neutral. No squeeze potential. |
| Long/Short | 0 | 1 | 0 | Crowded long trade. Retail is on the wrong side. |
| Trading Activity | 0 | 0 | 1 | Volume drying up. Wait-and-see approach. |
Conclusion & Percentage
The scores for Bitcoin are virtually identical to ETH, which makes sense given the correlation, but Bitcoin’s CVD on the daily chart looks even more aggressive in terms of selling pressure.
- Total Components: 8
- Bullish Points: 0
- Bearish Points: 5
- Neutral: 3
The Percentages:
- Bullish: 0 / 8 = 0%
- Bearish: 5 / 8 = 62.5%
- (Neutral/Waiting: 37.5%)
Final Verdict:
The Bitcoin market structure is Bearish.
There is strong absorption happening: passive buyers are catching price in the current zone, but aggressive sellers (visible in CVD) keep hitting the sell button. As long as the POC is not reclaimed and CVD does not flip, the probability of further downside (continuation) is greater than a reversal. The market is slowly “bleeding out” in this range.
If you want to run these analyses yourself, you can use our AiTraderView webapp for free. All you need to do is create an account & login & Launch AiTraderView App — that’s it. It’s completely free! Register a free account
⚠️ RISK WARNING & AI DISCLOSURE
- This information is generated by Artificial Intelligence (AI) and complex algorithms. While advanced, these systems can contain errors or inaccuracies and are for educational purposes only.
- Technical analysis provides no guarantees; this information is purely informative.
- All discussed scenarios are hypothetical and do not constitute predictions or expectations.
- Past performance is not an indicator of future results.
- This is not financial advice and is not intended as a call-to-action for the reader.
- No implicit direction is claimed, and no specific behavior of market participants is suggested.