
We are thrilled to announce a major upgrade to our Crypto Automated Technical Analysis software.
Trading often feels like trying to read a map in the dark. You see the price moving, but do you know why? Is that dip a buying opportunity or a trap? Is that pump real volume or just manipulation?
Enter the Bitcoin Anomaly Detector.
This new module serves as a real-time “X-ray” of the market. By fusing advanced AI pattern recognition with raw order flow data, we can now visualize abnormal market behavior the moment it happens.
Here is what this new dashboard brings to your trading arsenal:
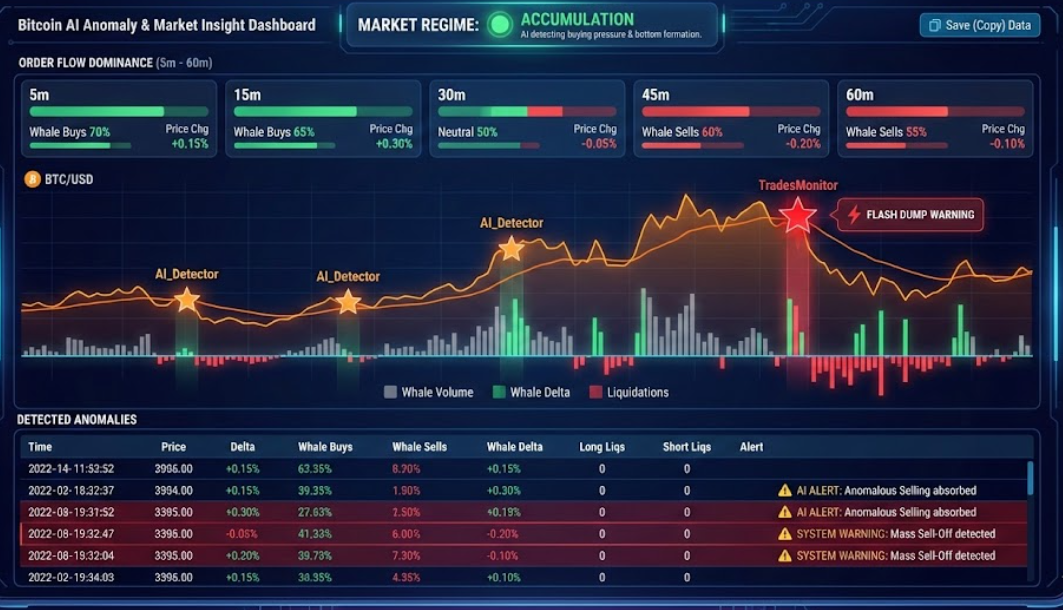
1. Instant Market Regime Analysis
Stop guessing the trend. At the top of your dashboard, the AI continuously analyzes price action and volume flow to determine the current “psychological state” of the market:
- 🟢 Accumulation: The AI detects buying pressure being silently absorbed. This is often a precursor to a bottom formation or a rally.
- ⚪ Neutral: The market is balanced or ranging.
- 🔴 Distribution: Big players are likely taking profits while price stagnates. A classic warning sign of an impending correction.
2. Track the “Whale War” (Order Flow Dominance)
Price tells you where value is; volume tells you the conviction behind it. Our Order Flow Dominance cards give you a snapshot of the battle between buyers and sellers across 5, 15, 30, 45, and 60-minute timeframes.
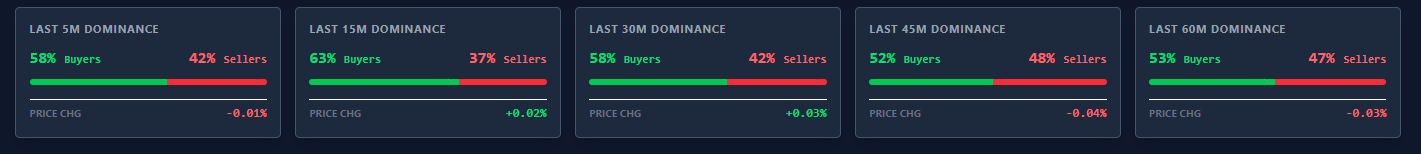
- The Bar: Visualizes the ratio of Whale Buys vs. Whale Sells. If the bar is 70% Green, the big money is buying.
- The Alpha Strategy: Look for divergence. If you see heavy Red Dominance (whales selling) but the Price Change is stable or rising, the market is absorbing the sell pressure. That is a bullish signal hidden in plain sight.
3. AI-Powered Anomaly Alerts
We have overlaid the price chart with intelligent signals to help you spot manipulation and volatility events.
- ⭐ Orange Stars (AI Detector): These appear when our AI detects behavior that is “abnormal” for the current conditions. It detects hidden walls, exhaustion, or manipulation patterns that standard indicators miss.
- ⭐ Red Stars (Hard Data): These are critical system warnings for extreme events, such as Flash Dumps, “God Candles,” or massive sell-offs that exceed safety limits.
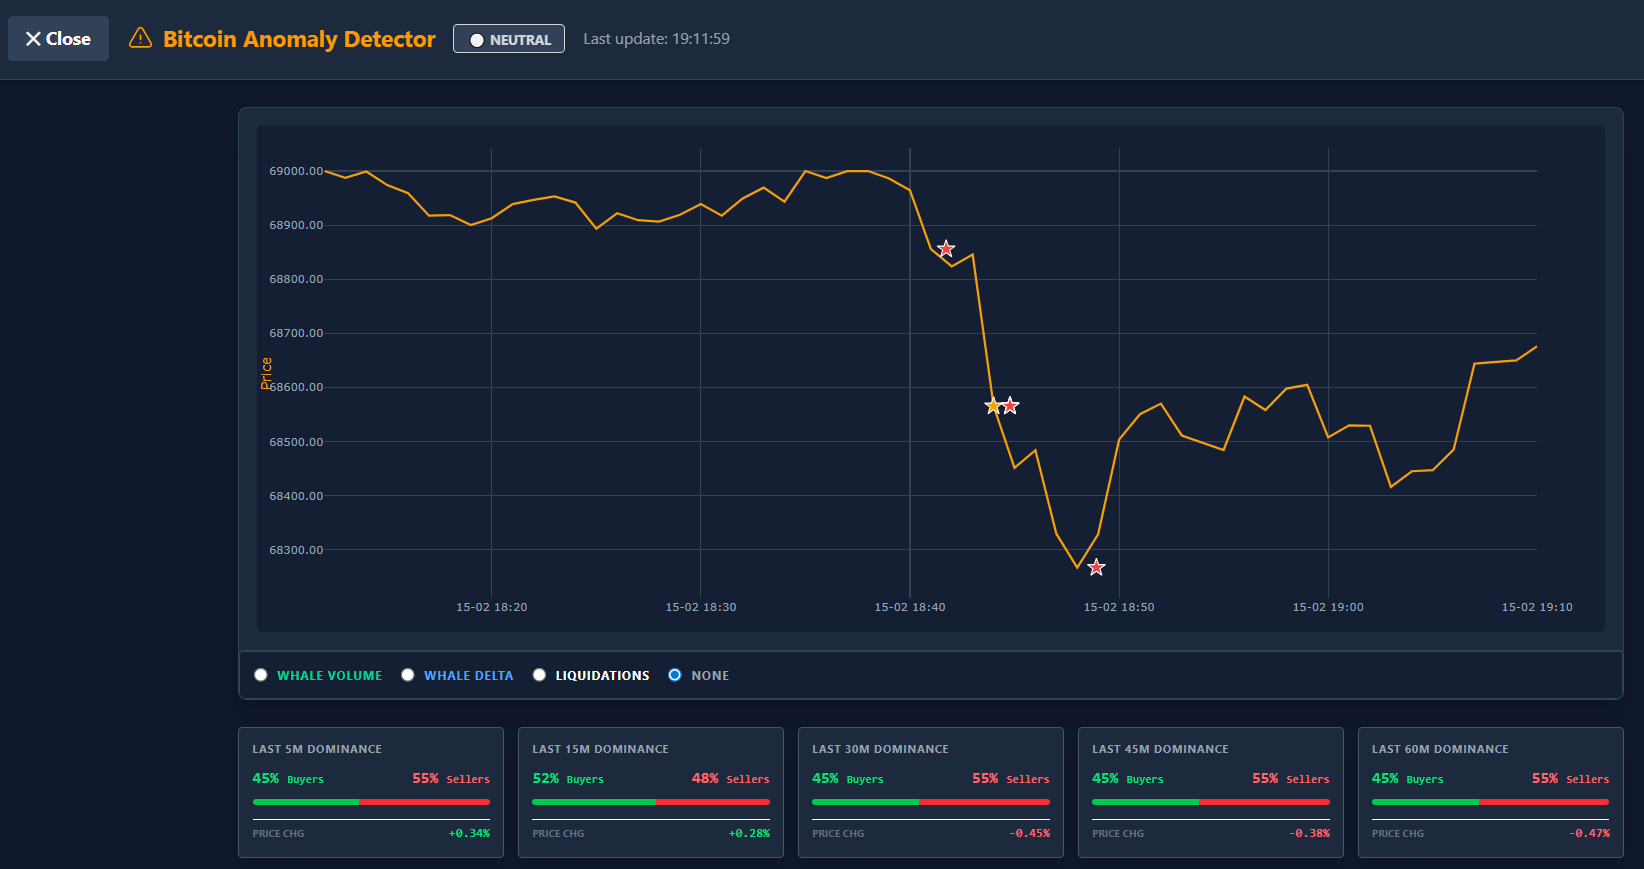
4. Deep Dive Data & Overlays
Want to verify the signal? You can toggle overlays to see exactly what is driving the move:
- Whale Volume & Delta: Are the whales aggressively buying or selling?
- Liquidations: See where traders are being forced out of positions—these painful moments often provide the fuel for the next big move.
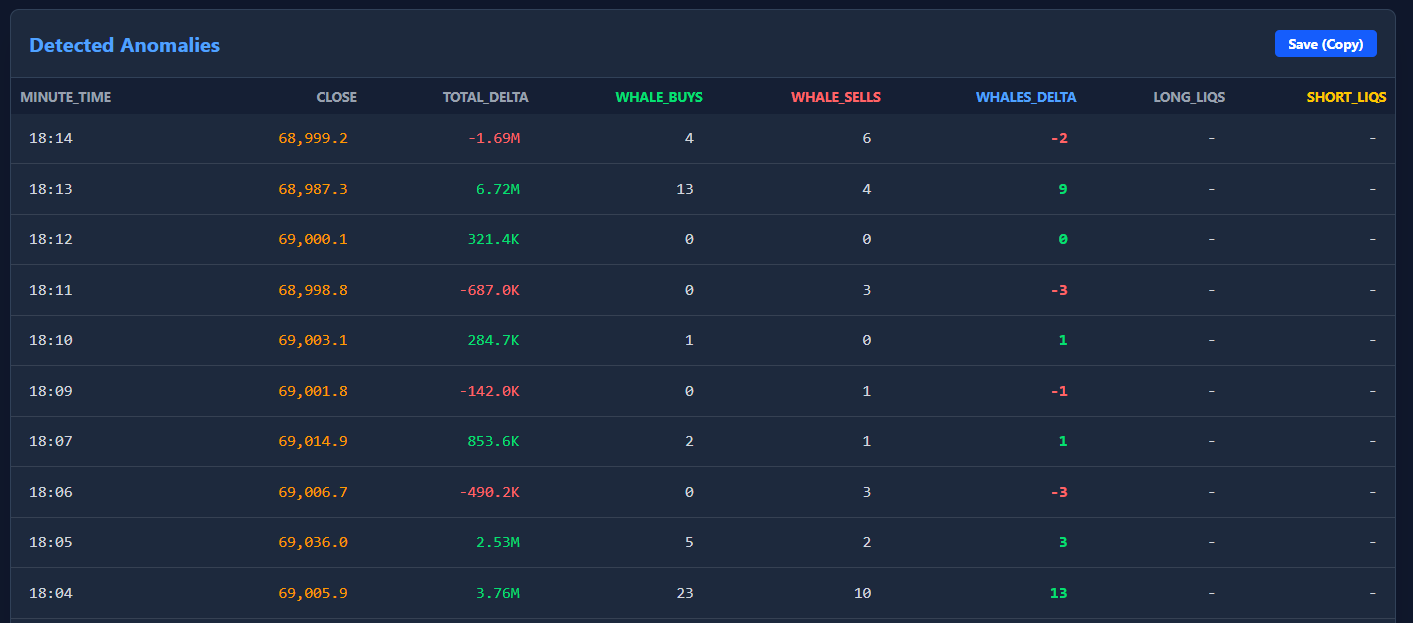
All of this data is logged in a minute-by-minute Anomaly Table below the chart, highlighting specific alerts like “Anomalous Selling absorbed” or “Buying hitting wall.”
Ready to see what others miss?
The Bitcoin Anomaly Detector is live now. Stop trading blindly and start analyzing the market with institutional-grade insights.
Read the Knowledge Base article
⚠️ RISK WARNING & AI DISCLOSURE
- This information is generated by Artificial Intelligence (AI) and complex algorithms. While advanced, these systems can contain errors or inaccuracies and are for educational purposes only.
- Technical analysis provides no guarantees; this information is purely informative.
- All discussed scenarios are hypothetical and do not constitute predictions or expectations.
- Past performance is not an indicator of future results.
- This is not financial advice and is not intended as a call-to-action for the reader.
- No implicit direction is claimed, and no specific behavior of market participants is suggested.