

1. Technical Analysis & Price Structure
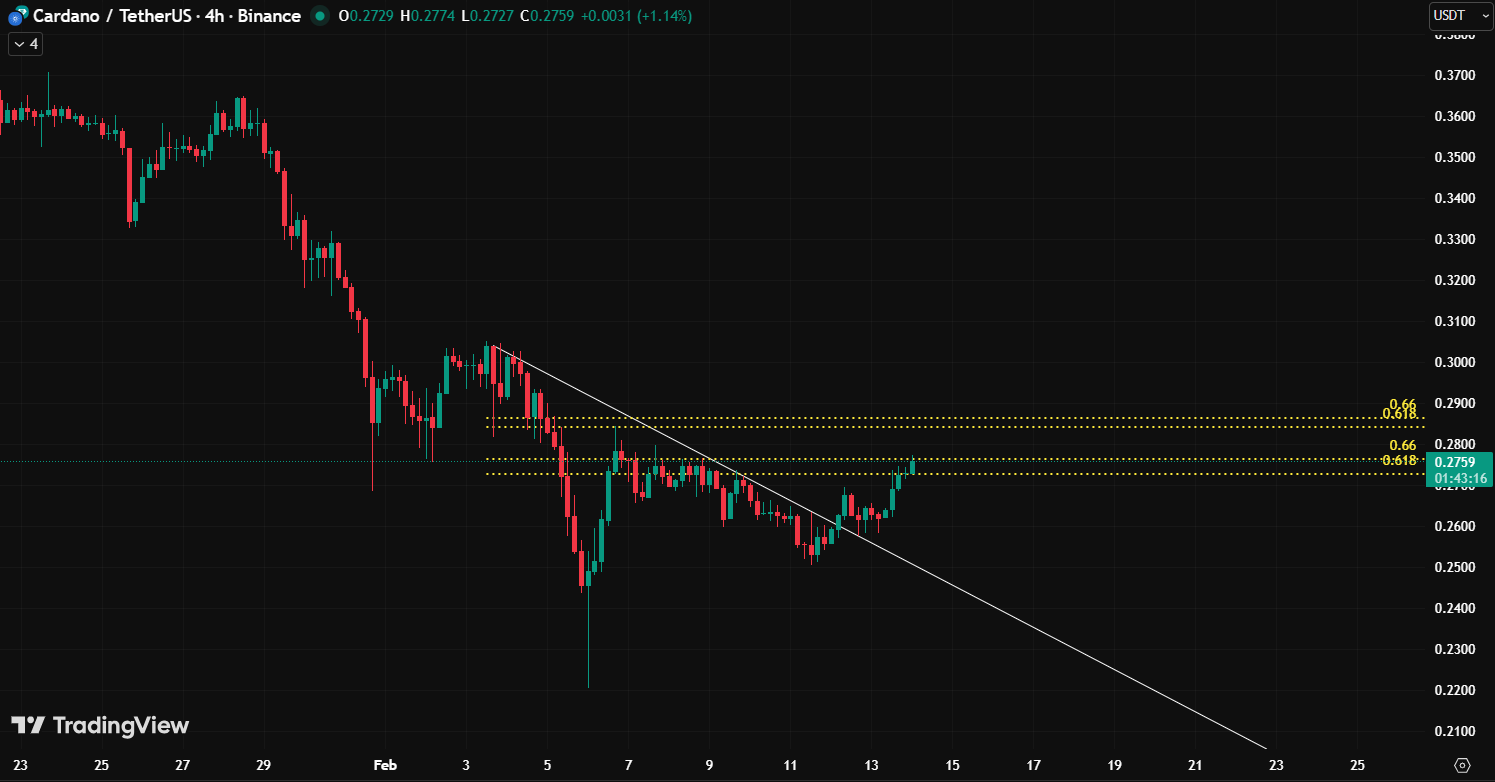
- Trendline Breakout: Image
ada1.pngclearly shows ADA breaking above a long-term descending trendline (the white diagonal line). This is a classic technical signal indicating a potential change in trend direction. - Fibonacci Resistance: The price is currently battling the Golden Pocket (the zone between the 0.618 and 0.66 Fibonacci levels), specifically around the 0.2759 – 0.2800 price point. A convincing candle close above this zone is typically regarded as a strong bullish confirmation.
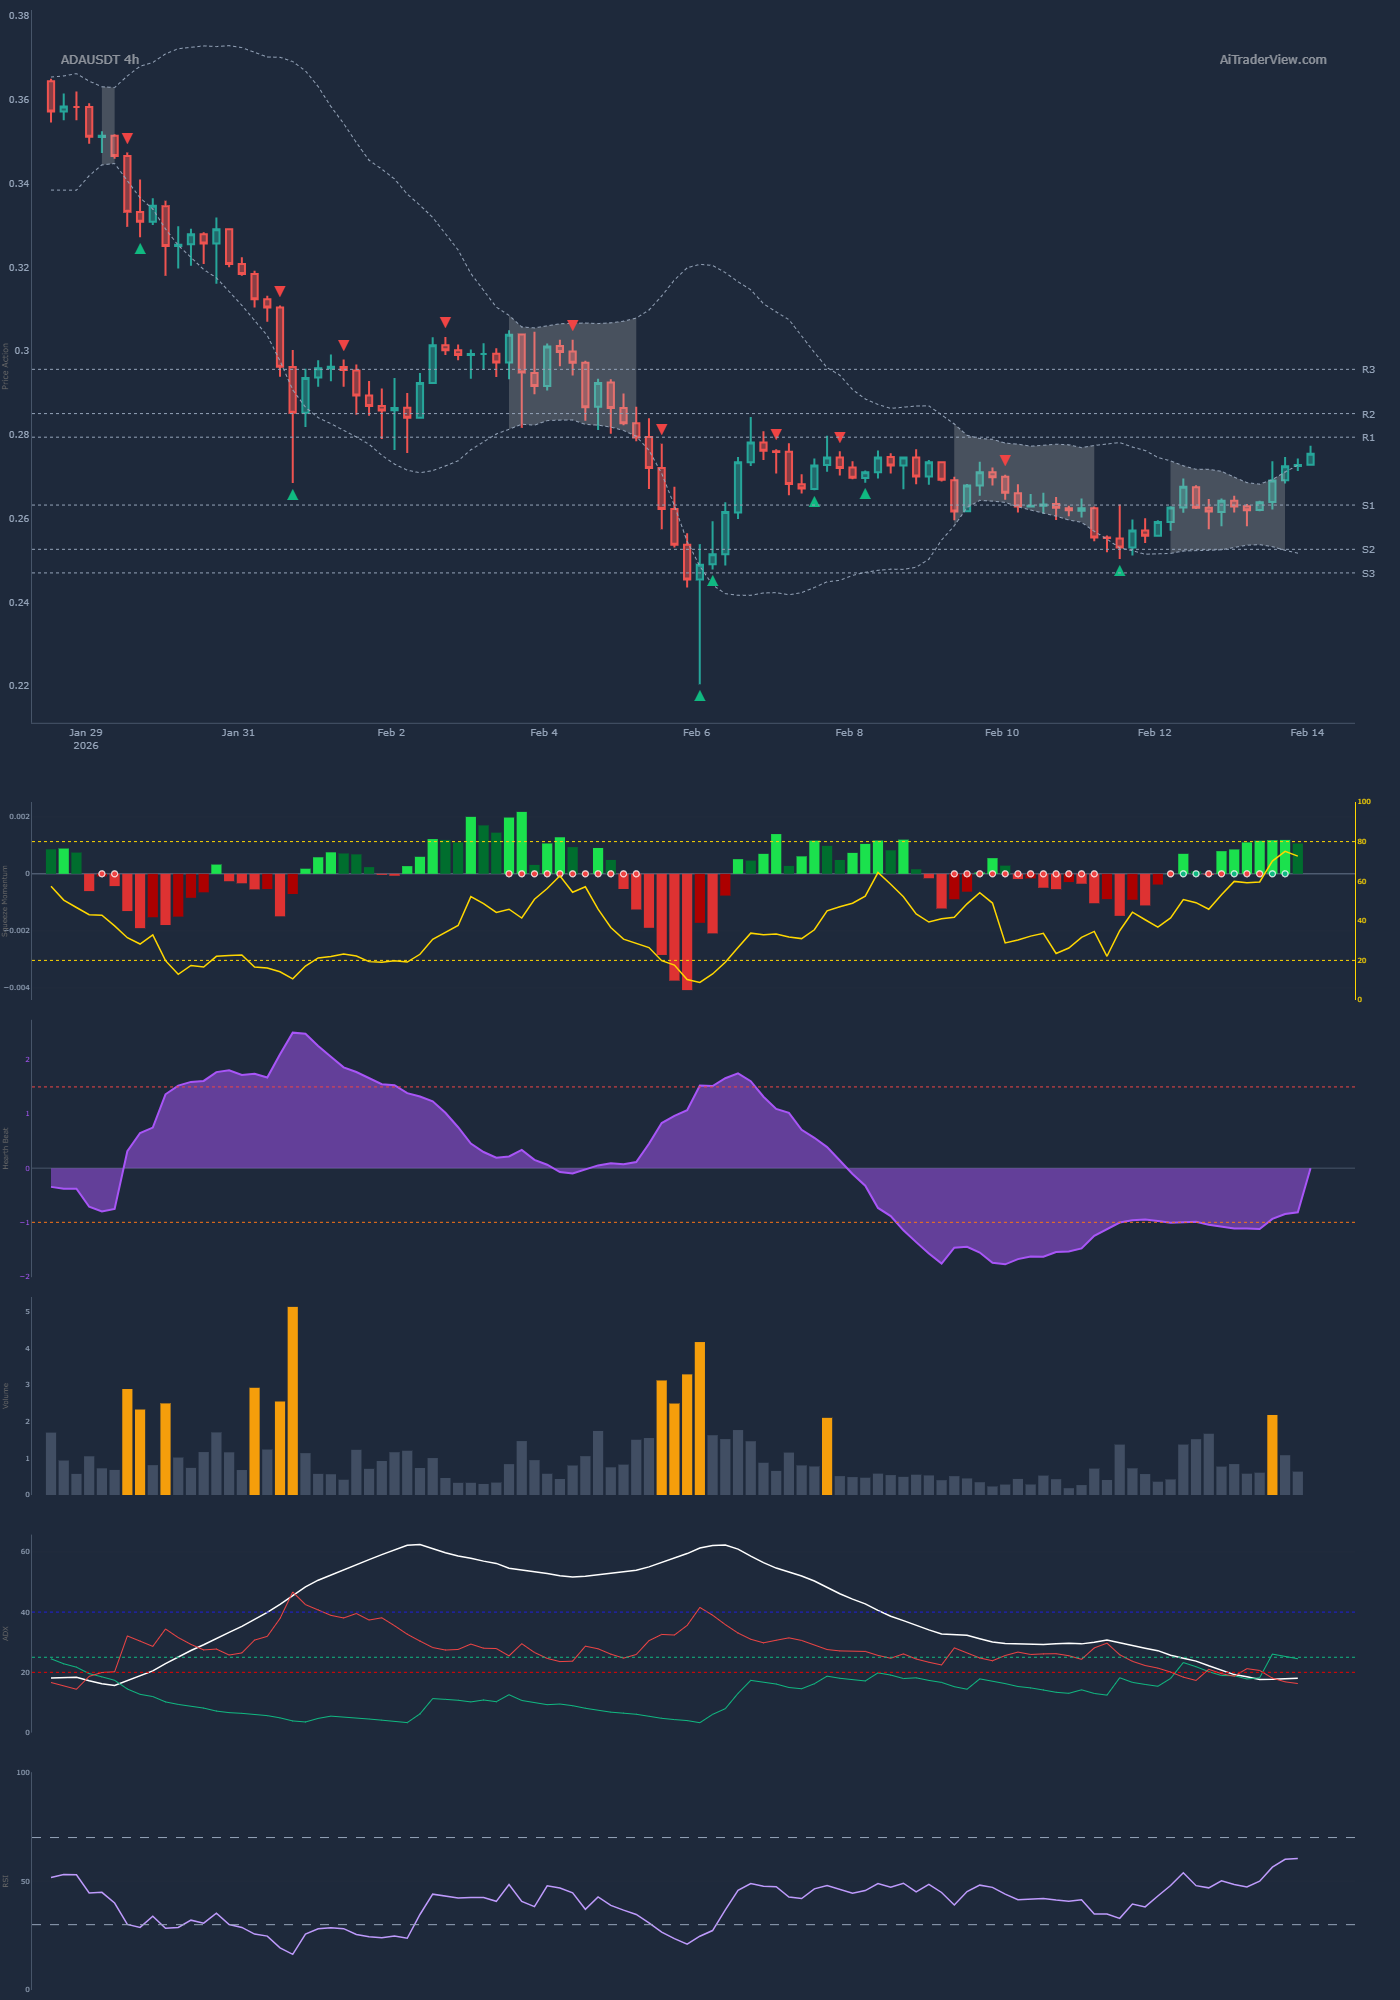
- Bottom Formation: In
ada3.jpg, we see that the price found a floor after a sharp decline (capitulazione) and is now climbing back towards resistance levels (R1/R2).
2. Orderflow & Market Data
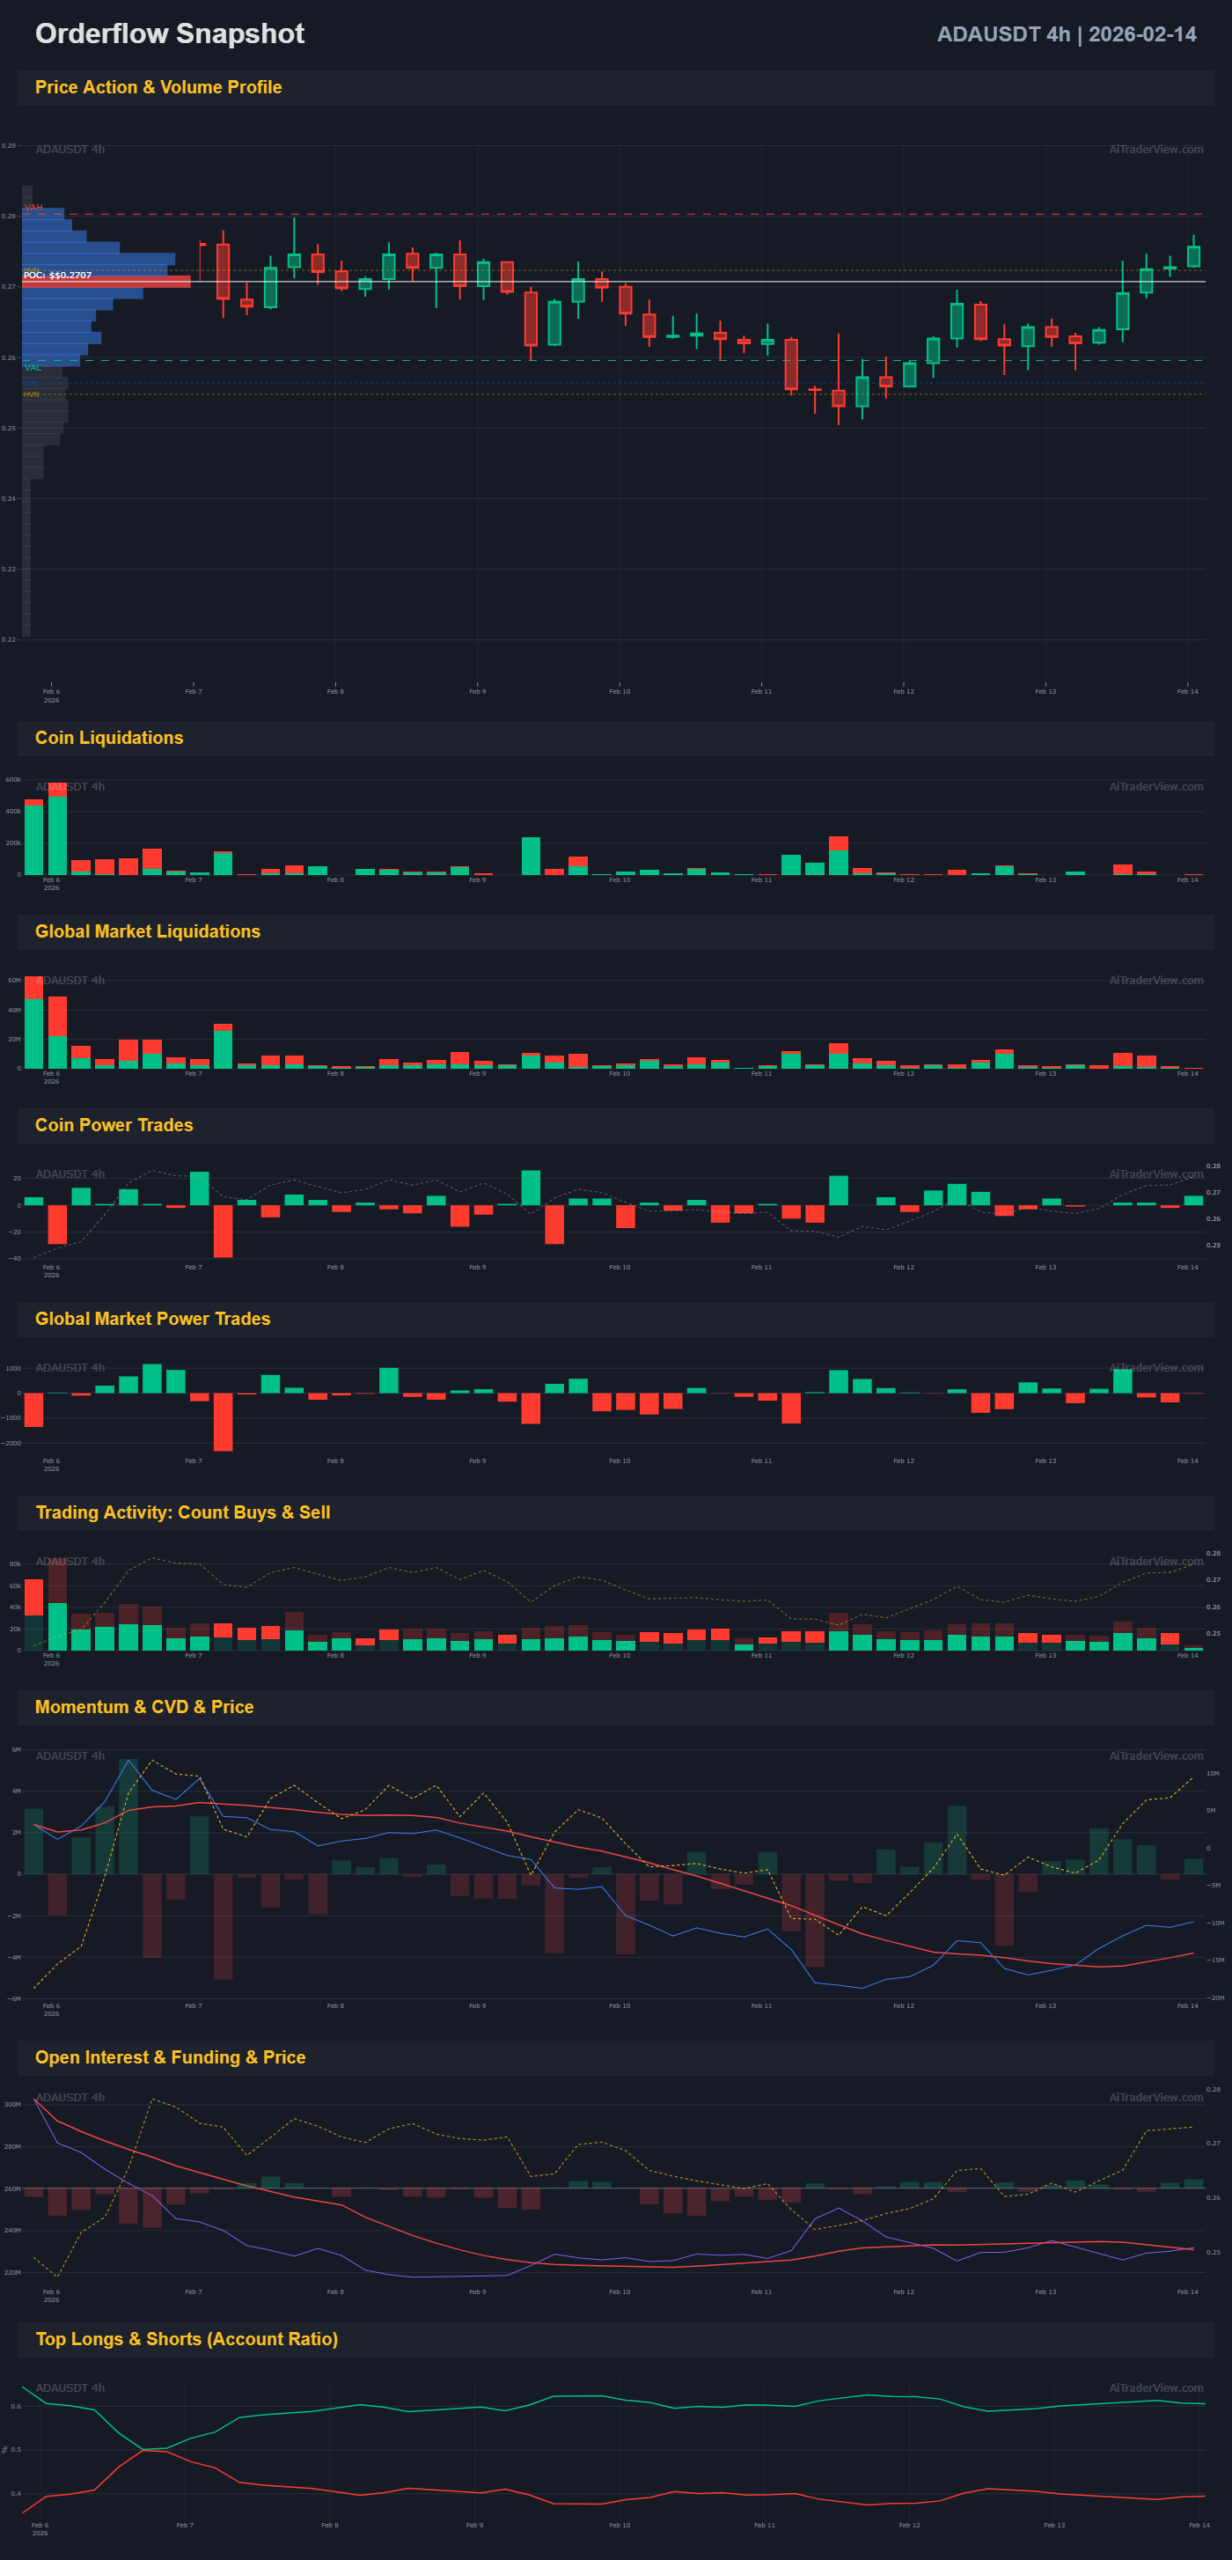
- Volume Profile: On the left side, the volume profile indicates that the price is moving above a significant volume cluster (High Volume Node), which should now act as support.
- Liquidations & CVD: The sub-charts display liquidations and Cumulative Volume Delta (CVD). Following earlier liquidations, the market appears to be stabilizing. It is crucial to monitor the CVD (net buy/sell volume) to confirm if the breakout is supported by genuine buying pressure.
- Open Interest: Rising Open Interest alongside rising prices would further confirm the strength of the current trend.
3. Algorithmic Signals
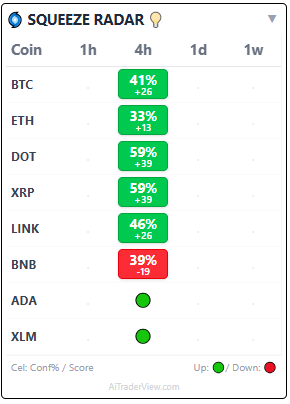
- Squeeze Radar: This table displays market sentiment for various cryptocurrencies.
- Signal for ADA: The 4h (4-hour) column shows a green dot for ADA.
- Context: This signal aligns with the broader market (BTC, ETH, DOT, and XRP also show green signals), suggesting that ADA’s rise is part of a general positive market sentiment rather than an isolated event.
Conclusion
The data is consistent across all images: ADA is in a recovery phase on the 4-hour chart.
- Bullish: The trendline has been broken, and algorithmic signals are flashing green.
- Caution: The price is currently in a critical resistance zone (Fibonacci 0.618). Traders often wait for a clear breakout above 0.2800 or a successful “retest” of the trendline as support before opening new long positions.
⚠️ RISK WARNING & AI DISCLOSURE
- This information is generated by Artificial Intelligence (AI) and complex algorithms. While advanced, these systems can contain errors or inaccuracies and are for educational purposes only.
- Technical analysis provides no guarantees; this information is purely informative.
- All discussed scenarios are hypothetical and do not constitute predictions or expectations.
- Past performance is not an indicator of future results.
- This is not financial advice and is not intended as a call-to-action for the reader.
- No implicit direction is claimed, and no specific behavior of market participants is suggested.