

Bitcoin (BTC) is trading under intensified selling pressure around $66,940 following a confirmed bearish breakout. After a period of low volatility, the technical structure has shifted, with a “squeeze” firing to the downside on intraday timeframes. This move challenges critical Fibonacci support levels despite continued capital injections from Spot ETFs.
This analysis dissects the mechanics of the recent breakdown, the current order flow, and the key levels traders are watching.
Technical Analysis: Squeeze Breakout Confirmed
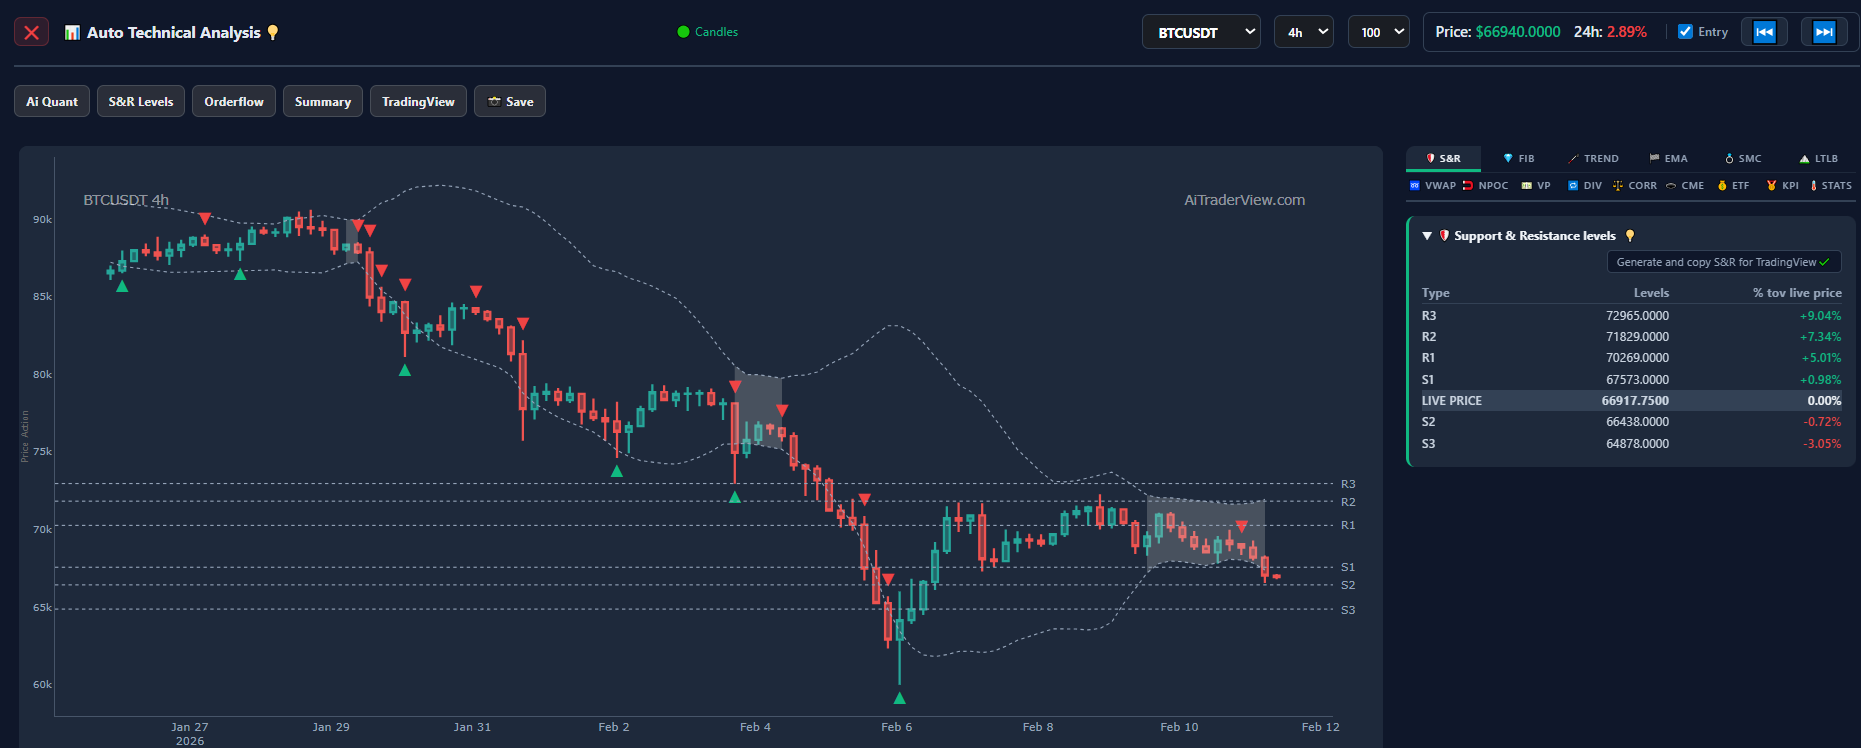
The most significant immediate development is visible on the 1-hour and 4-hour charts. For several sessions, Bitcoin traded in a tight compression zone (indicated by the grey shaded areas on the Squeeze indicator).
- Squeeze Fired Short: The TTM Squeeze indicator, which visualizes periods of consolidation, has officially fired to the downside. This signals a transition from low volatility to high volatility expansion.
- Momentum Shift: The breakout was accompanied by a sharp drop in price, pushing Bitcoin below the lower Bollinger Bands. This confirms that bears have seized immediate control, invalidating the sideways drift.
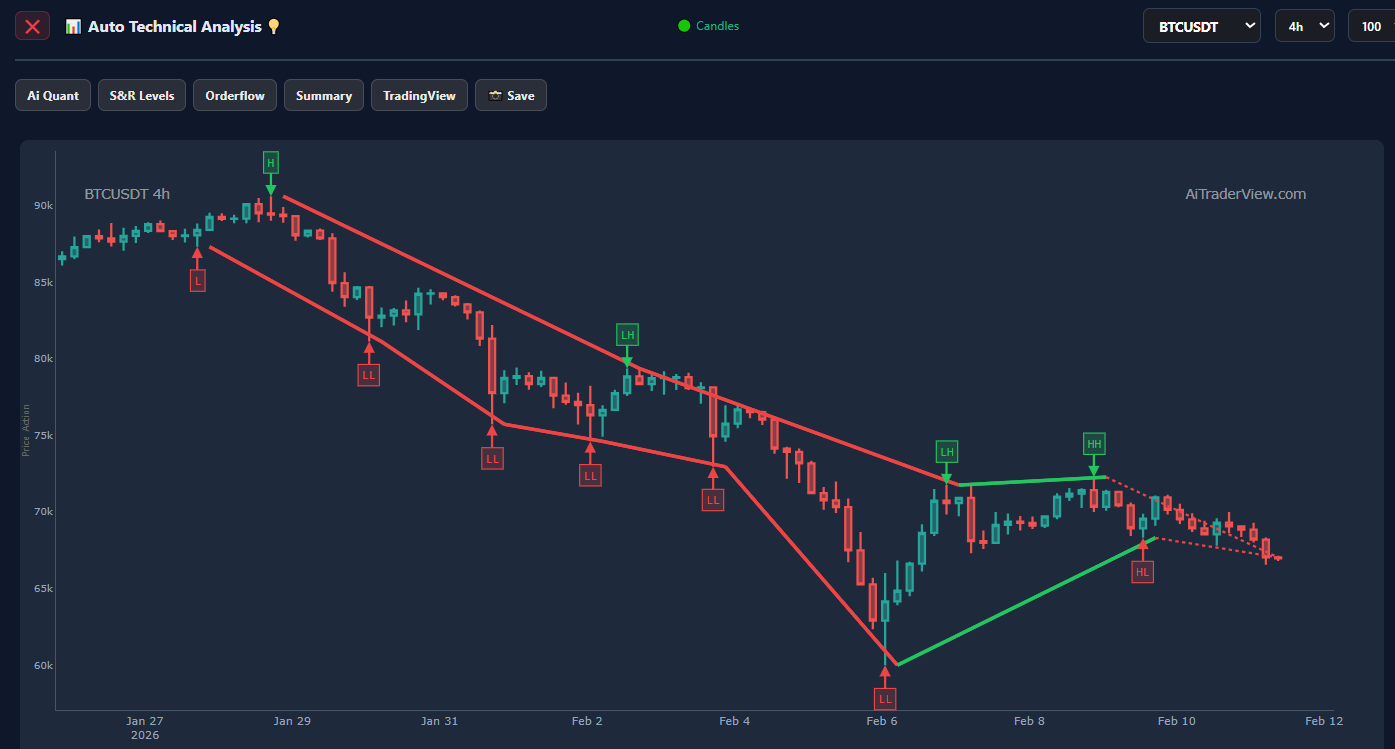
- Trend Continuation: The breakdown aligns with the broader downtrend channel characterized by Lower Highs (LH) and Lower Lows (LL). The failure to reclaim the EMA 20 prior to this drop suggests the path of least resistance remains lower.
Moving Averages & RSI
- EMA Structure: Price is rejected firmly by the EMA ribbon. The 20 EMA is acting as dynamic resistance, pushing price further away from the 50 and 200 EMA.
- RSI & ADX: The RSI is trending lower but has not yet reached deep oversold territory on the 4H chart, leaving room for further downside. The ADX (Average Directional Index) is rising, indicating the strength of this bearish trend is increasing.
Order Flow & CVD: Aggressive Selling
The “plumbing” of the market supports the bearish price action seen on the charts.
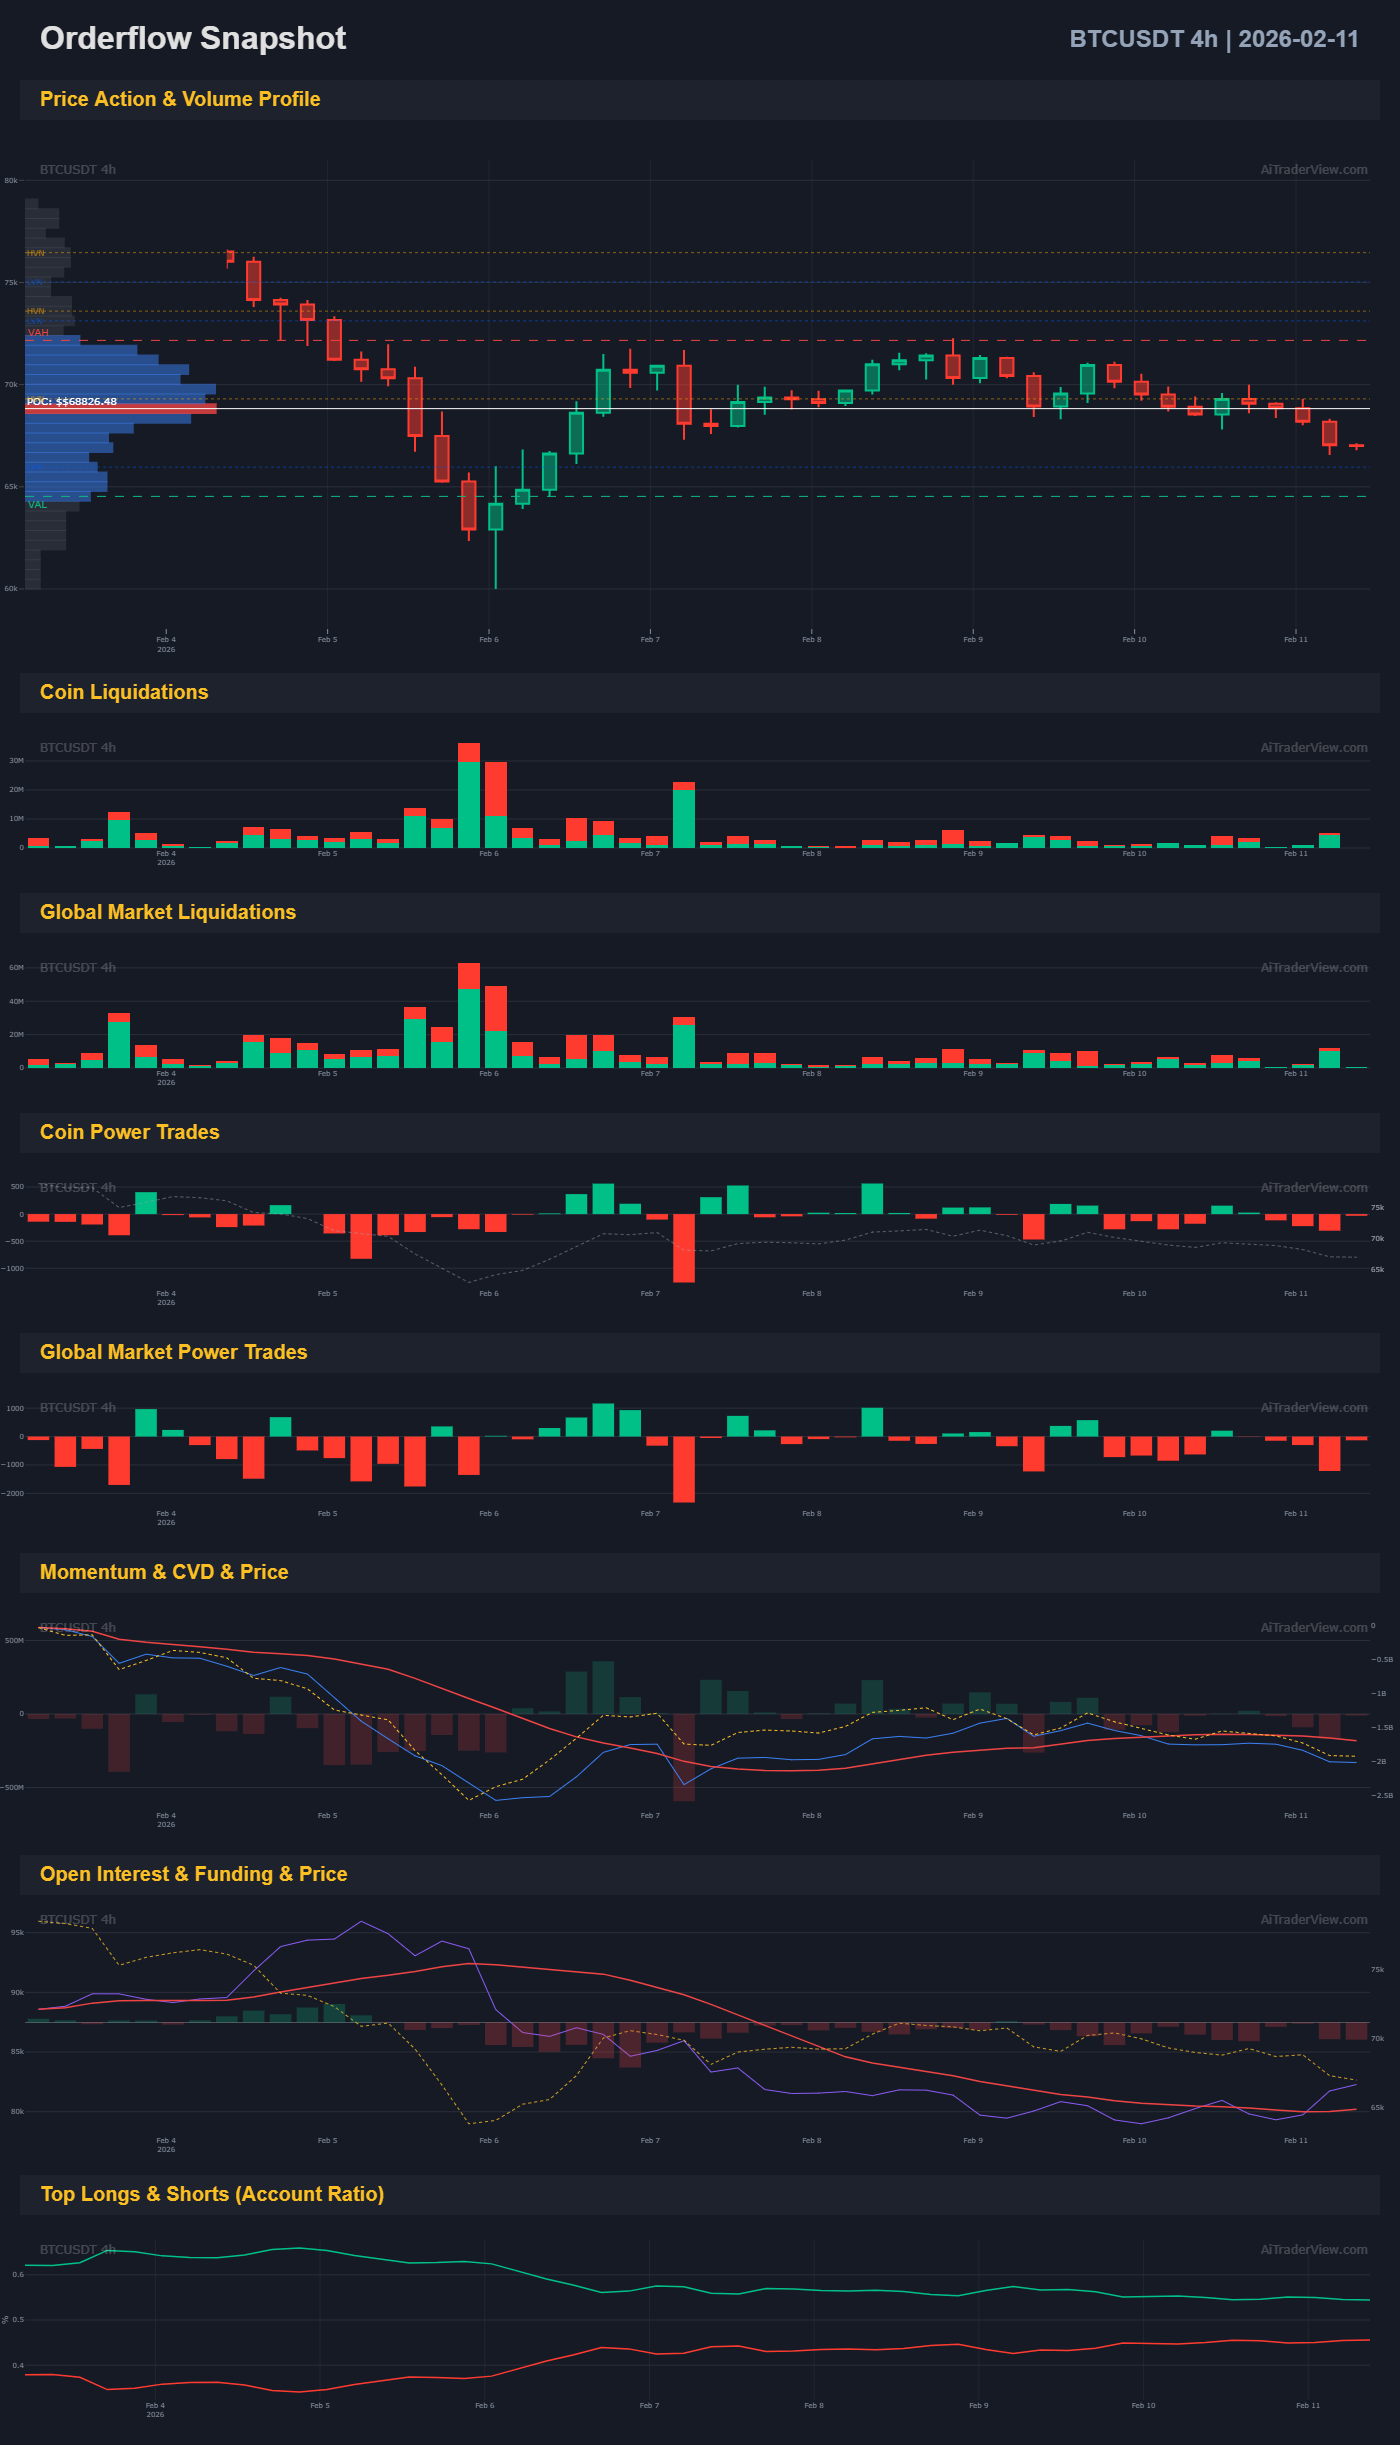
- Cumulative Volume Delta (CVD): Coinciding with the squeeze breakdown, the CVD has dropped significantly. This indicates that the move downward is being driven by aggressive market sell orders, rather than simply a lack of buyers.
- Open Interest (OI): Open Interest has remained relatively stable during the drop, suggesting that short positions are being opened and held, rather than just long positions closing.
- Liquidations: The breakout triggered a cluster of long liquidations. However, the order flow heatmap suggests there is still liquidity to be hunted below the $66,400 swing low.
Institutional Divergence: The ETF Anomaly
Despite the bearish technical breakdown, institutional behavior continues to diverge from spot price action. Bitcoin Spot ETF flows remain net positive, signaling accumulation during this correction.
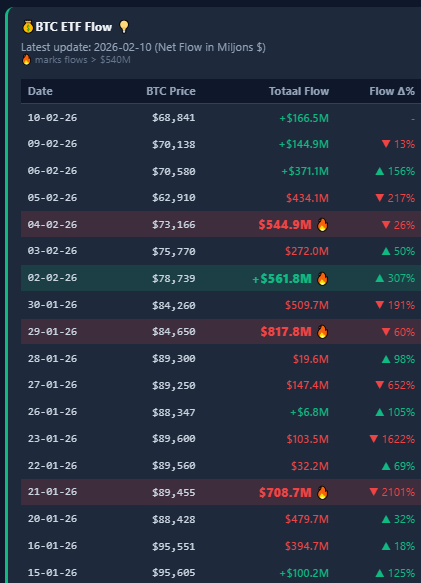
- Recent Inflows:
- Feb 10: +$166.5M
- Feb 09: +$144.9M
- Feb 06: +$371.1M
- Analysis: While short-term traders and algorithms are playing the technical squeeze to the downside, longer-term institutional capital appears to be absorbing the supply. This creates a complex dynamic where price drops are being met with passive buying walls, potentially limiting the depth of the crash.
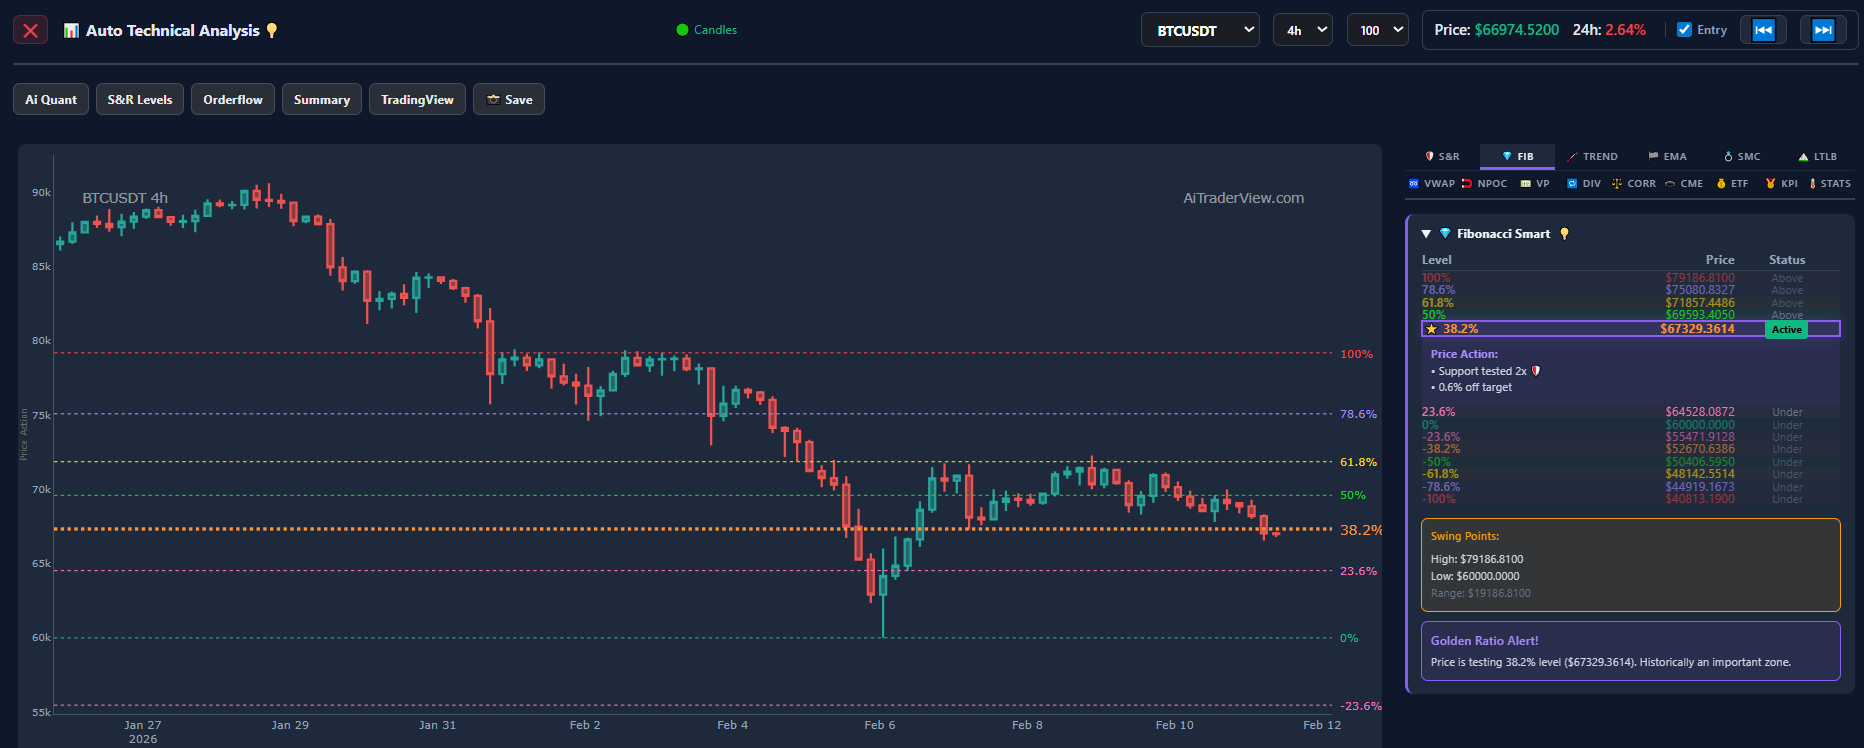
Key Support & Resistance Levels
Bitcoin is currently testing the 38.2% Fibonacci Retracement level ($67,329), having effectively wicked below it.
- Immediate Resistance: $68,300 (The breakdown point and recent Bearish Breaker).
- Critical Support (S1): $66,438. A loss of this level confirms the Squeeze breakdown’s full target.
- Major Support (S2): $64,878 (Previous swing lows).
Summary
The market has spoken in the short term: the squeeze has fired short, and the technical trend is bearish. The breakdown below consolidation support suggests a test of $66,400 is imminent.
However, the persistent ETF inflows serve as a warning to late bears. While the technicals favor downside continuation, the institutional bid underneath the market remains strong.
- Bearish Confirmation: A 4-hour candle close below $66,400 would likely accelerate the move toward $64k.
- Bullish Reversal: Bulls must arrest the momentum and reclaim $68,300 to invalidate the effects of this squeeze breakout.
⚠️ RISK WARNING & AI DISCLOSURE
- This information is generated by Artificial Intelligence (AI) and complex algorithms. While advanced, these systems can contain errors or inaccuracies and are for educational purposes only.
- Technical analysis provides no guarantees; this information is purely informative.
- All discussed scenarios are hypothetical and do not constitute predictions or expectations.
- Past performance is not an indicator of future results.
- This is not financial advice and is not intended as a call-to-action for the reader.
- No implicit direction is claimed, and no specific behavior of market participants is suggested.