VWAP – Volume Weighted Average Price
Institutional Benchmarking: The ➿ VWAP Tab
In professional trading, algorithms and institutional desks frequently utilize specific benchmarks to gauge execution quality. One of the most widely monitored metrics is the VWAP (Volume Weighted Average Price).
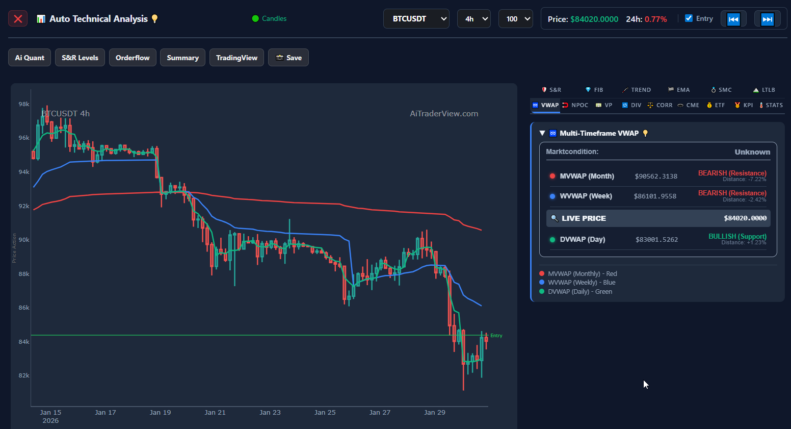
The ➿ VWAP tab in AiTraderView provides access to this data. It serves as a tool to filter out intraday volatility, displaying the volume-weighted mean price at which an asset has traded throughout a specific session.
AiTraderView extends this analysis with Multi-Timeframe VWAP logic. In this article, we explain how the DVWAP, WVWAP, and MVWAP function, and how they are utilized to analyze market structure across different time horizons.
What is the Volume Weighted Average Price?
The Volume Weighted Average Price (VWAP) is a trading benchmark calculated by adding up the dollars traded for every transaction (price multiplied by number of shares/coins) and then dividing by the total shares/coins traded.
The Weighting Concept:
- Scenario A: 100 Bitcoin are bought at $50,000.
- Scenario B: 1 Bitcoin is bought at $52,000.
A simple moving average might calculate the mean price near $51,000. However, the VWAP accounts for the volume, placing the effective average much closer to $50,000. In technical analysis, the VWAP line is often viewed as a dynamic “Fair Value” zone.
The 3 VWAP Lines: Green, Blue, and Red
The ➿ VWAP tab displays three distinct lines, each representing the average price over a different timeframe. Understanding the “Reset” times (when the calculation restarts from zero) is crucial for interpretation.
1. 🟢 DVWAP (Daily VWAP) – Green
- Reset: Every day at 00:00 UTC.
- Function: This line is primarily used for Intraday Analysis. It resets every night, providing data on the current session’s volume profile.
- Technical Context: If the price is trading above the Green line, the intraday bias is technically defined as Bullish. If below, the bias is Bearish. Institutional algorithms often target the DVWAP to execute large orders at the session’s average price.
2. 🔵 WVWAP (Weekly VWAP) – Blue
- Reset: Every week on Monday at 00:00 UTC.
- Function: This line serves as a benchmark for Swing Trading structures. It accumulates volume data for the entire week, filtering out single-day volatility.
- Technical Context: In a healthy uptrend, price often retraces to the Blue WVWAP line. Analysts monitor this “Weekly Reset” as a potential area of support where the weekly trend may resume.
3. 🔴 MVWAP (Monthly VWAP) – Red
- Reset: Every month on the 1st day of the month.
- Function: This line is used for Macro Trend Analysis. It represents the average cost basis for positions opened during the current month.
- Technical Context: The MVWAP is often viewed as a significant support or resistance level. If the price holds above the Red line, the monthly structure is considered bullish, regardless of short-term intraday fluctuations.
Interpreting the Signals
By analyzing the interaction between these three lines, users can assess market alignment across timeframes.
The “Trend Alignment” (Confluence) A significant technical setup occurs when the price is positioned above all three lines.
- Price > Green (Bullish Intraday)
- Price > Blue (Bullish Weekly)
- Price > Red (Bullish Monthly)
- Interpretation: This is known as “Full Bullish Alignment.” In this state, strategies focusing on trend continuation (“dip buying”) are often favored by analysts because multiple timeframes of support exist below the current price.
The “VWAP Reclaim”
- Scenario: Price drops below the Green DVWAP (short-term correction) but finds support on the Blue WVWAP.
- Technical Signal: If the price subsequently breaks back above the Green DVWAP, it is technically defined as a “Reclaim.” This suggests that the short-term correction has concluded and the broader weekly trend may be resuming.
The “Structural Break” (Bearish)
- Scenario: Price drops below the Red MVWAP and fails to reclaim it.
- Technical Signal: This is monitored as a warning sign. Standard technical theory suggests that when price is below the MVWAP, the line may flip from Support to Resistance, as long-term holders may look to exit positions at break-even.
Conclusion
The ➿ VWAP tab provides an objective, volume-based perspective on price action. Instead of relying solely on subjective trendlines, this tool allows traders to analyze price relative to the average volume-weighted cost.
- Utilize the Green DVWAP for intraday momentum.
- Utilize the Blue WVWAP for weekly structure.
- Utilize the Red MVWAP for monthly trend definition.
By monitoring these levels, traders can align their strategies with the “Fair Value” benchmarks used by institutional participants.
⚠️ RISK WARNING & AI DISCLOSURE
- This information is generated by Artificial Intelligence (AI) and complex algorithms. While advanced, these systems can contain errors or inaccuracies and are for educational purposes only.
- Technical analysis provides no guarantees; this information is purely informative.
- All discussed scenarios are hypothetical and do not constitute predictions or expectations.
- Past performance is not an indicator of future results.
- This is not financial advice and is not intended as a call-to-action for the reader.
- No implicit direction is claimed, and no specific behavior of market participants is suggested.