Papertrader & My Portfolio
Introduction: Portfolio Management & Simulation
The Portfolio section of the platform is designed to provide users with comprehensive visibility over their positions. Whether monitoring long-term holdings or testing a new theory, this dashboard serves as the primary interface for asset tracking. It combines a visual breakdown of assets through the Portfolio Treemap and a risk-free environment for strategy testing via Paper Trading.
1. 💼 My Portfolio: The Treemap Visualization
In the My Portfolio tab, data is transformed into an interactive visual map. This Treemap allows users to assess the allocation and status of holdings efficiently.
Understanding the Treemap The Treemap represents positions as a series of nested rectangles.
- Block Size (Allocation): The size of each rectangle is proportional to its weight in the portfolio. A larger block indicates that a specific asset represents a higher percentage of the total portfolio value.
- Block Color (Performance): The color indicates the unrealized P&L (Profit & Loss) relative to the entry price:
- Green: The position is currently showing a positive return.
- Red: The position is currently showing a negative return.
Visual Analysis: This view helps users instantly identify which assets are impacting the portfolio’s overall volatility and performance.
2. 💼 Papertrade: Simulation & Education
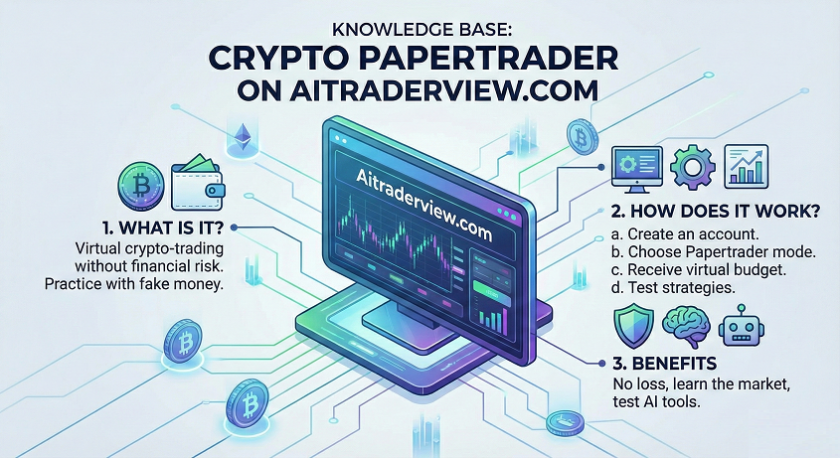
For users who wish to practice platform execution or test the signals from the KPI suite without financial exposure, the Paper Trading module provides a simulated environment.
What is Paper Trading? Paper Trading is a educational tool that uses “Virtual Capital” to interact with live market data. Actions taken in Paper Trade mode are simulations and have no impact on actual wealth.
- Virtual Balance: Users start with a defined amount of simulated funds (e.g., $10,000) to open and close virtual positions.
- Strategy Testing: Users can test their analysis (e.g., a Squeeze Radar alert or a technical pattern) in a safe environment to observe how the strategy would perform under current market conditions.
- Platform Familiarization: This mode allows users to become comfortable with the MMS V2 algorithms and platform interface before engaging with real capital.
3. Key Performance Metrics
Below the Treemap, the dashboard provides data points to evaluate simulated performance:
- Total Equity: The sum of virtual cash and the current market value of all open simulated positions.
- Open P&L ($ / %): The current unrealized profit or loss across all active trades.
- Asset Allocation: A breakdown of diversification (e.g., 40% BTC, 20% SOL, 40% Cash).
- Position Details: A granular list showing entry price, current market price, and the specific performance of each asset.
4. Integrating Analysis with Simulation
The system allows users to create a feedback loop between analysis and simulation:
- Analyze: Use the SMC Overview and LSS Matrix to identify a potential setup based on technical data.
- Simulate: Open a position in Paper Trade mode to track the idea.
- Monitor: Use the Treemap to observe how that position influences the simulated portfolio balance.
Concept: Concentration Risk In portfolio theory, the Treemap can be used to visualize Over-Concentration. If one block occupies a significant majority (e.g., 70%) of the map, the portfolio is statistically more vulnerable to the volatility of that single asset. A diversified portfolio typically displays a balanced distribution of blocks.
⚠️ RISK WARNING & AI DISCLOSURE
- This information is generated by Artificial Intelligence (AI) and complex algorithms. While advanced, these systems can contain errors or inaccuracies and are for educational purposes only.
- Technical analysis provides no guarantees; this information is purely informative.
- All discussed scenarios are hypothetical and do not constitute predictions or expectations.
- Past performance is not an indicator of future results.
- This is not financial advice and is not intended as a call-to-action for the reader.
- No implicit direction is claimed, and no specific behavior of market participants is suggested.