NPOC – Naked Point of Control
Auction Market Theory: The 🧲 NPOC Tab
In technical analysis, price movement is often analyzed through the lens of Auction Market Theory. A common phenomenon observed by analysts is the tendency for price to revisit specific historical levels where significant volume was previously transacted.
The 🧲 NPOC tab in AiTraderView is designed to visualize these “untested” volume nodes, technically known as Naked Points of Control. In this article, we explain what an NPOC is, the theory behind why price often revisits them, and how they are used for precise targeting.
What is a Naked Point of Control?
To understand an NPOC, one must first understand the Point of Control (POC).
In Volume Profile analysis, the POC is the specific price level where the highest volume was traded during a specific time period (e.g., a day or a week). It represents the “fair value” established by buyers and sellers for that session.
- Standard POC: This level shifts dynamically as trading volume accumulates.
- Naked Point of Control (NPOC): This is a POC from a previous session that the price has not touched (or “tested”) again since that session closed.
Example: If Bitcoin establishes a significant POC at $60,000 on Monday, and then rallies to $65,000 on Tuesday without dipping back to $60,000, that $60,000 level becomes a Naked Point of Control. It is considered “Naked” because it remains exposed and unvisited.
Why Does Price Return to the NPOC?
Markets function like auctions, constantly searching for liquidity and balance.
- The Liquidity Search: Because significant volume was transacted at the NPOC level in the past, algorithmic models often identify it as a zone of high liquidity.
- Auction Efficiency: Market theory suggests that price often revisits high-volume nodes to validate them as support or resistance. This process is known as “closing the loop” or “backfilling.”
- Trend Structure: In many technical strategies, a trend is analyzed for sustainability based on whether it has backfilled to the nearest Naked Point of Control.
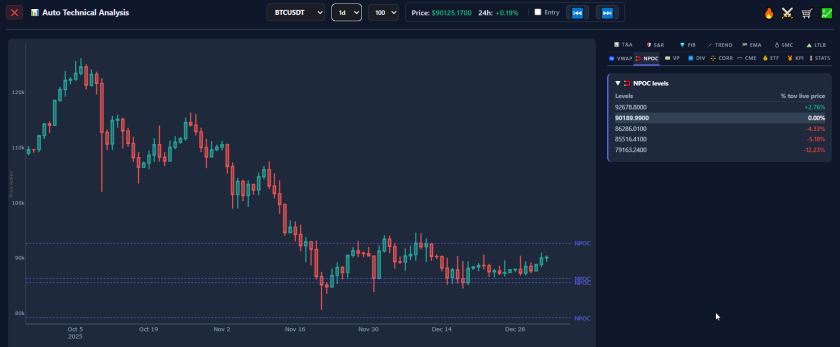
How to Access the 🧲 NPOC Tab
To access this volume analysis tool, follow these steps:
- Open the Menu: Click the “Auto Technical Analysis” button (📊 icon) for the asset.
- Select the Tab: Click on the eighth tab labeled 🧲 NPOC.
- Review the Levels: The interface displays a list of Daily and Weekly NPOCs that are currently active (untouched).
Using the NPOC Tab for Technical Strategy
The 🧲 NPOC tab provides specific coordinates often used for trade management.
Concept 1: Targeting Liquidity (Take Profit) If a position is active, analysts often look to NPOCs as logical destinations for price.
- Scenario: A short position is open, but the target is unclear.
- Application: If a Daily Naked Point of Control exists 2% below the current price, traders often place Take Profit orders slightly above that level. The theory is that price is statistically drawn to test these high-volume nodes.
Concept 2: Reaction Levels (Entry) Once an NPOC is tested, the “magnet” effect is considered resolved, and standard support/resistance mechanics apply.
- Scenario: Price is correcting sharply.
- Application: A Weekly NPOC from a previous period often acts as a significant support zone. Institutions may defend these levels, leading to a technical bounce or “reaction” upon the first test.
Concept 3: Technical Confluence An NPOC is most significant when aligned with other technical factors.
- Application: Use the 🧲 NPOC tab in conjunction with the 💎 FIB tab. If a Naked Point of Control aligns with a 0.618 Golden Pocket, the setup is considered “High Confluence.” In technical analysis, the overlap of volume data and Fibonacci ratios strengthens the validity of the support zone.
Daily vs. Weekly NPOCs
The tab distinguishes between timeframes, which carry different weights in analysis:
- Daily NPOC: Often utilized for short-term intraday targets. These levels are frequently tested within a few days of formation.
- Weekly NPOC: Represents a major structural level. While they can remain untouched for extended periods, a return to a Weekly Naked Point of Control is often associated with significant reactions or trend reversals.
Conclusion
Markets are mechanisms for correcting inefficiencies. The Naked Point of Control represents a notable volume inefficiency on the chart.
By using the 🧲 NPOC tab in AiTraderView, users move beyond guessing potential support levels to identifying specific coordinates that algorithmic models prioritize. This allows for data-driven precision in setting targets and identifying reversal zones.
⚠️ RISK WARNING & AI DISCLOSURE
- This information is generated by Artificial Intelligence (AI) and complex algorithms. While advanced, these systems can contain errors or inaccuracies and are for educational purposes only.
- Technical analysis provides no guarantees; this information is purely informative.
- All discussed scenarios are hypothetical and do not constitute predictions or expectations.
- Past performance is not an indicator of future results.
- This is not financial advice and is not intended as a call-to-action for the reader.
- No implicit direction is claimed, and no specific behavior of market participants is suggested.