LTLB – Last Top and Last Bottom of a timeframe
Range & Risk Analysis: The ⛰️ LTLB Tab
In trading, price rarely moves in a straight line. It moves in waves, creating a series of structural peaks and valleys known as “Swing Highs” and “Swing Lows.” Identifying the most recent high and low is critical because these points define the current trading range.
The ⛰️ LTLB tab in AiTraderView stands for Last Top and Last Bottom. It is a precision tool designed to identify these critical price levels across multiple timeframes instantly. Beyond simply finding the levels, it calculates the distance between the current price and these points, assisting in the calculation of Risk-to-Reward (R/R) ratios.
In this article, we explore the Last Top and Last Bottom functionality and how to use its data to structure trade setups.
What is Last Top and Last Bottom (LTLB)?
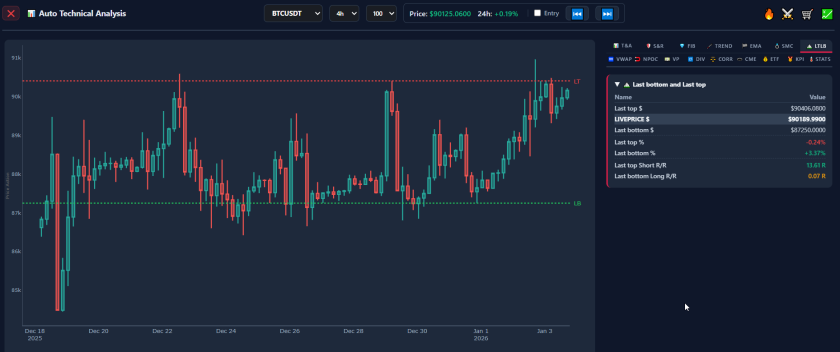
The Last Top and Last Bottom tab provides a structured overview of the current market range. The algorithm detects the most recent validated high (Top) and low (Bottom) for every timeframe, creating clear technical boundaries:
- Last Top: The immediate resistance level. If price breaks this, it is technically defined as a breakout or trend continuation.
- Last Bottom: The immediate support level. If price breaks this, it is technically defined as a breakdown.
Unlike historical support and resistance, Last Top and Last Bottom levels are dynamic, updating based on the current swing structure. This makes them essential for defining invalidation points (Stop Losses) and objectives (Take Profits).
How to Access the ⛰️ LTLB Tab
To view the range data for your asset, follow these steps:
- Open the Menu: Click on the “Auto Technical Analysis” button (📊 icon) for the asset.
- Select the Tab: Click on the sixth tab labeled ⛰️ LTLB.
- Analyze the Table: The interface lists various timeframes (e.g., 15m, 1h, 4h, 1d) with their corresponding Top and Bottom prices.
Understanding the Data Columns
The Last Top and Last Bottom tab provides context for decision making:
1. Price Levels (Top & Bottom) For each timeframe, the tool displays the exact price of the Last Top and the Last Bottom.
- Usage: These levels often serve as technical targets. For long positions, the “Last Top” is a logical resistance target. For short positions, the “Last Bottom” is the logical support target.
2. Percentage Distance This column shows the percentage difference between the Live Price and the Top/Bottom.
- Risk Assessment: Example: If the “Distance to Top” is +2% and “Distance to Bottom” is -10%, the asset is trading near the top of its range. Technically, entering a long position here offers a poor Risk/Reward ratio as resistance is close.
Strategies Using Last Top and Last Bottom
The Last Top and Last Bottom data allows for objective, mathematical planning.
The “Range Rotation” Concept Markets often consolidate in a range between the Last Top and Last Bottom.
- The Setup: Identify a timeframe where the price is near the Last Bottom.
- The Trade: Traders often define a Long position with a Stop Loss just below the Last Bottom and a Take Profit at the Last Top. This strategy anticipates a rotation back to the range high.
The Breakout Confirmation
- The Setup: Monitor the “Distance to Top” percentage.
- The Trade: If the price breaks the Last Top and closes above it, the range is technically broken. Momentum traders often use this event as a trigger, interpreting the removal of the “ceiling” as a signal for trend expansion.
Multi-Timeframe Alignment
- Concept: Look for a scenario where the Last Bottom on a lower timeframe (e.g., 15m) aligns with the Last Bottom on a higher timeframe (e.g., 4h).
- Confluence: This “Confluence of Support” suggests a significant structural floor. Buying near these aligned levels allows for tighter risk parameters while targeting higher timeframe ranges.
Conclusion
Effective trading requires understanding risk relative to reward. The ⛰️ LTLB tab eliminates uncertainty by providing accurate Last Top and Last Bottom data instantly.
By utilizing the distance metrics provided in this tab, traders can ensure they only engage in setups where the potential reward mathematically justifies the risk, moving away from estimation and towards data-driven analysis.
⚠️ RISK WARNING & AI DISCLOSURE
- This information is generated by Artificial Intelligence (AI) and complex algorithms. While advanced, these systems can contain errors or inaccuracies and are for educational purposes only.
- Technical analysis provides no guarantees; this information is purely informative.
- All discussed scenarios are hypothetical and do not constitute predictions or expectations.
- Past performance is not an indicator of future results.
- This is not financial advice and is not intended as a call-to-action for the reader.
- No implicit direction is claimed, and no specific behavior of market participants is suggested.