KPI: VIX (The Fear Gauge)
Macro-Economic Analysis: The VIX (Volatility Index)
The VIX (CBOE Volatility Index) is a premier macro-economic KPI used to measure the stock market’s expectation of volatility over the next 30 days. Often referred to by market participants as the “Fear Gauge,” the VIX is derived from S&P 500 index options.
In this trading ecosystem, the VIX serves as a key indicator for assessing the global financial environment. Because the crypto market is often categorized as a “risk-on” asset class, it has historically shown sensitivity to the levels of uncertainty reflected in the VIX.
1. How the VIX Works
Unlike most indicators that track price direction, the VIX tracks implied volatility.
- High VIX: Indicates that market participants expect significant price swings. Technically, this reflects increased demand for options as a form of portfolio hedging (“insurance”).
- Low VIX: Indicates that market participants expect stability. This is often interpreted as a sign of market confidence or complacency.
2. The Inverse Correlation with Crypto
For crypto analysts, the VIX is often monitored as a leading indicator of liquidity and risk appetite.
- Risk-On (Low VIX): Historically, periods of low volatility in traditional markets are associated with capital flows into higher-risk assets like Bitcoin and Altcoins.
- Risk-Off (High VIX): When the VIX spikes, institutional investors often “de-risk” portfolios. This can correlate with selling pressure in volatile asset classes (including crypto) as capital moves to cash or defensive assets.
3. Interpreting VIX Thresholds
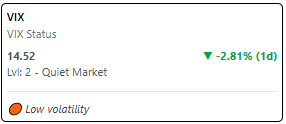
The dashboard displays the VIX value with specific color-coding to assist in assessing the macro risk level:
| VIX Level | Status | Market Environment Context |
| < 15 | 🟢 Complacency | Low expected volatility. Historically associated with stable trends. |
| 15 – 20 | ⚪ Healthy | Normal market conditions. Standard volatility expectations. |
| 20 – 30 | 🟡 Elevated | Growing uncertainty. Expectation of increased range expansion. |
| > 30 | 🔴 High Stress | Extreme uncertainty. Historically associated with capitulation events. |
4. Integration with MMS V2
The VIX serves as a primary input for the MMS (Market Macro Score) and the Regime Score algorithms.
- Regime Impact: A VIX reading above 25 is designed to lower the Regime Score, shifting the automated status toward Risk-Off.
- Sync Detection: If the VIX is spiking but Crypto prices remain stable, the system logic triggers a “Decoupled” status. This indicates that the crypto market is exhibiting independent strength relative to global macro sentiment.
5. Analytical Utility of the VIX
Monitoring the VIX helps identify the “structural” state of the broader market:
- identifying Extremes: An extremely low VIX (<12) is sometimes viewed by contrarian analysts as a sign of over-complacency, suggesting that the market may be unprepared for a sudden volatility expansion.
- Capitulation Signs: A significant spike in the VIX (>35) often coincides with “market capitulation”—a phase where selling pressure peaks. Technical analysts often monitor these levels for potential bottoming structures.
Educational Concept: Confluence
Traders often monitor the VIX Trend in conjunction with other metrics. For example, a rapidly rising VIX combined with a high LPI (Leverage Pressure Index) is technically interpreted as a scenario with high liquidation risk. This combination suggests that macro uncertainty is rising exactly when the market is highly leveraged.
⚠️ RISK WARNING & AI DISCLOSURE
- This information is generated by Artificial Intelligence (AI) and complex algorithms. While advanced, these systems can contain errors or inaccuracies and are for educational purposes only.
- Technical analysis provides no guarantees; this information is purely informative.
- All discussed scenarios are hypothetical and do not constitute predictions or expectations.
- Past performance is not an indicator of future results.
- This is not financial advice and is not intended as a call-to-action for the reader.
- No implicit direction is claimed, and no specific behavior of market participants is suggested.