KPI: SPI (Stablecoin Pressure Index)
Analyzing Liquidity Dynamics: The Stablecoin Pressure Index (SPI)
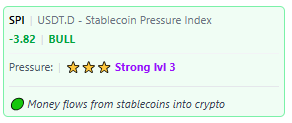
The Stablecoin Pressure Index (SPI) is a fundamental indicator designed to measure the flow of capital between stablecoins and the broader cryptocurrency market. While price indicators focus on asset valuation, the SPI analyzes Liquidity Pressure—monitoring the movement of capital currently sitting in stablecoins (e.g., USDT, USDC).
This index functions as a core component of the analytical engine, providing data on whether capital is statistically rotating into the market (Risk-On) or exiting into stablecoins (Risk-Off).
1. What Does the SPI Measure?
The SPI analyzes the inverse correlation between Stablecoin Dominance and Risk Asset valuation (such as BTC and ETH). The metric is based on the principle of Capital Rotation.
- Capital Inflow (Risk-On): When market participants swap stablecoins for crypto assets, stablecoin dominance typically decreases while the SPI rises.
- Capital Flight (Risk-Off): When market participants sell crypto assets for stablecoins, stablecoin dominance increases, resulting in a negative SPI value.
2. Interpreting the Scores
The SPI uses color-coded status indicators and numerical values to signal the direction of capital flows:
🟢 Positive SPI (Inflow)
- Technical State: Capital is rotating from stablecoins into crypto assets.
- Interpretation: This represents Volume Support. In market theory, price trends accompanied by a rising SPI are considered to have stronger “organic” backing, as they are driven by capital deployment rather than leverage alone.
🔴 Negative SPI (Outflow)
- Technical State: Capital is rotating from crypto assets into stablecoins.
- Interpretation: This represents Defensive Positioning. Investors are increasing their cash/stablecoin holdings, often interpreted as a signal of caution or distribution.
⚪ Neutral SPI (Balance)
- Technical State: No significant shift in the ratio between stablecoins and crypto assets.
- Interpretation: The market is likely in a consolidation or equilibrium phase.
3. Divergence Analysis: The “Disbelief” Signal
The SPI is utilized to identify Price-Liquidity Divergences, often referred to in trading psychology as “climbing the wall of worry.”
- Scenario: Price is rising 📈 while SPI is Negative 📉.
- Interpretation: This divergence suggests that while asset prices are increasing, a significant portion of the market is actively moving to stablecoins (fear/caution).
- Technical Context: Historically, this market structure—where price climbs despite negative sentiment—can sometimes precede trend continuation, as the market is not yet “overheated” with leverage. However, it also indicates that the rally lacks broad capital support.
4. Integration with MMS V2
Within the MMS (Market Macro Score) algorithm, the SPI serves as a primary logic filter for identifying market phases:
- Trend Validation: The MMS logic prioritizes “Growth” phases when the SPI is positive, interpreting the move as being supported by verifiable capital inflow.
- Fragility Warning: If the price rises but the SPI turns negative, the MMS system may categorize the phase as “Distribution” or “Weak Rally.” This warns the user that the price appreciation is not supported by new liquidity entering the ecosystem.
5. Analytical Utility of SPI
Understanding liquidity flow is critical for assessing trend sustainability. The SPI allows analysts to:
- Distinguish Demand from Speculation: Verify if a price move is backed by the conversion of stablecoins into assets (Spot Buying) or if it is driven purely by derivatives.
- Identify Extremes:
- High SPI: Often correlates with periods of high sentiment (potential local top).
- Low SPI: Often correlates with periods of capitulation (potential local bottom), where cash holdings are at their maximum.
⚠️ RISK WARNING & AI DISCLOSURE
- This information is generated by Artificial Intelligence (AI) and complex algorithms. While advanced, these systems can contain errors or inaccuracies and are for educational purposes only.
- Technical analysis provides no guarantees; this information is purely informative.
- All discussed scenarios are hypothetical and do not constitute predictions or expectations.
- Past performance is not an indicator of future results.
- This is not financial advice and is not intended as a call-to-action for the reader.
- No implicit direction is claimed, and no specific behavior of market participants is suggested.