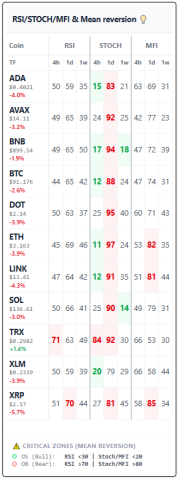
KPI: RSI/STOCH/MFI & Mean reversion
Momentum & Mean Reversion: The Oscillator Scanner
The RSI/STOCH/MFI & Mean Reversion KPI (Oscillator Scanner) is an analytical tool designed to identify market conditions that are statistically extended relative to historical averages. While trend-following indicators like EMAs assist in identifying market direction, oscillators are used to measure the velocity and magnitude of price movements.
By scanning multiple timeframes and momentum metrics, this KPI helps users visualize when an asset has deviated significantly from its mean price, a concept known in financial theory as “Mean Reversion.”
Understanding the Oscillator Scanner in Crypto Trading
An oscillator is a technical analysis tool that constructs high and low bands between two extreme values, building a trend indicator that fluctuates within these bounds. The Oscillator Scanner KPI specifically aggregates three core metrics:
- RSI (Relative Strength Index)
- Stoch (Stochastic Oscillator)
- MFI (Money Flow Index)
Market Context: Traders utilize these indicators to discover “overbought” or “oversold” conditions. When the Oscillator Scanner KPI shows that multiple metrics are reaching extreme levels simultaneously across various timeframes (4h, 1d, 1w), technical analysts monitor these zones for potential normalization (Mean Reversion) of price action.
The Three Components of the Scanner
To effectively utilize the Oscillator Scanner KPI, it is important to understand the inputs driving the algorithm:
- RSI (Relative Strength Index): Measures the speed and change of price movements. In standard technical analysis, values above 70 are traditionally defined as “overbought,” while values below 30 are “oversold.”
- Stoch (Stochastic Oscillator): Compares a specific closing price of an asset to a range of its prices over a certain period of time. It operates on the theory that momentum changes direction before price.
- MFI (Money Flow Index): Often referred to as “Volume-Weighted RSI.” Unlike standard RSI, MFI incorporates volume data to measure buying and selling pressure. This helps assess if price movement is supported by trading volume.
Note: Oscillators are historically most effective in non-trending (sideways) markets or during the maturation phase of a trend.
Identifying Mean Reversion Conditions
The core philosophy behind this KPI is Mean Reversion. Much like the EMA strategies, the Oscillator Scanner operates on the principle that prices tend to return to their average value over time.
The “Critical Zone” Concept: When the RSI/STOCH/MFI & Mean Reversion KPI enters a “Critical Zone,” it indicates that the price is significantly removed from its historical average momentum.
- Example: If the RSI reads 85 and the MFI reads 90 on the Daily timeframe, the market is technically considered “overheated” or extended. In historical data analysis, such extremes are often followed by a period of consolidation or correction, although this is not guaranteed.
Interpreting the Dashboard: Technical States
The dashboard provides a visual heat map to simplify the interpretation of these complex metrics:
- 🟢 Oversold Zone: (e.g., RSI < 30, Stoch < 20, MFI < 20).
- Interpretation: The asset has experienced significant downward selling pressure. Technical analysts often monitor these zones for potential exhaustion of sellers or a stabilization of price (relief bounce).
- 🔴 Overbought Zone: (e.g., RSI > 70, Stoch > 80, MFI > 80).
- Interpretation: The asset has experienced aggressive buying pressure. This state suggests the price may be overextended relative to the norm, increasing the statistical risk of a pullback or consolidation.
- ⚪ Neutral Zone: (Values between 40-60).
- Interpretation: Momentum is balanced. This is often characteristic of a healthy trend continuation or consolidation phase.
Integration with MMS V2 Strategies
The Oscillator Scanner KPI serves as a data input for the [Internal Link: MMS V2 (Market Macro Score)]. The system utilizes this data to categorize market conditions:
- Risk Filtering: The MMS V2 algorithm helps filter signals. For instance, it may downgrade a trend signal if the Oscillator Scanner shows extreme overbought levels, highlighting the risk of entering at the top of a range.
- Counter-Trend Analysis: When the MMS V2 identifies potential local bottoms, it cross-references with the Oscillator Scanner. An “Oversold” reading adds confluence to the theory that selling pressure may be diminishing.
Educational Concept: Divergence Theory
Important Note: An asset can remain “overbought” for extended periods during strong momentum trends. Relying solely on oscillators can be misleading.
Experienced analysts often look for Divergence—a scenario where the Price makes a Higher High, but the Oscillator Scanner makes a Lower High.
- Significance: In technical analysis theory, divergence is a primary signal that the underlying momentum of a trend is weakening, often preceding a shift in market structure.
⚠️ RISK WARNING & AI DISCLOSURE
- This information is generated by Artificial Intelligence (AI) and complex algorithms. While advanced, these systems can contain errors or inaccuracies and are for educational purposes only.
- Technical analysis provides no guarantees; this information is purely informative.
- All discussed scenarios are hypothetical and do not constitute predictions or expectations.
- Past performance is not an indicator of future results.
- This is not financial advice and is not intended as a call-to-action for the reader.
- No implicit direction is claimed, and no specific behavior of market participants is suggested.