KPI: LSS (Long/Short Matrix)
The LSS Long/Short Matrix is one of our kpi’s of our trader’s toolkit. While standard price action only shows you the result of trades, this matrix reveals the intent of market participants.
It provides a real-time “X-ray” of how different groups of traders are positioned. By breaking down positions into specific categories, this KPI helps you instantly identify if a move is being driven by “Smart Money” (Whales) or by “Retail” (the crowd). This distinction is critical for avoiding expensive traps and identifying high-probability reversal points.
In this article, we dive deep into how to read, interpret, and integrate the LSS Long/Short Matrix into your strategy.
The Three Tiers of the LSS Long/Short Matrix
To provide a complete picture of market sentiment, the matrix categorizes data into three distinct layers. Understanding this distinction is the key to success.
1. Global Accounts (The Retail Proxy)
This figure reflects the total number of individual accounts that are Long versus Short. Since every account gets one “vote” regardless of portfolio size, this serves as the perfect proxy for retail sentiment. It shows what the “crowd” is doing. When the LSS Long/Short Matrix shows extreme values here, caution is advised.
2. Top Accounts (The Professional Mood)
Here we zoom in on top-tier traders (often the top 20% by margin balance). It shows the percentage of these high-value accounts that are net Long or Short. This figure reflects the “mood” of experienced traders who are typically better informed than the masses.
3. Top Positions (The Heavy Capital)
This is the most critical metric within the LSS Long/Short Matrix. It measures the total value and size of positions held by top traders. It tells you where the actual “heavy money” is sitting. If the crowd is long, but the big money is short, you know who is likely to win.
Reading and Interpreting the Matrix
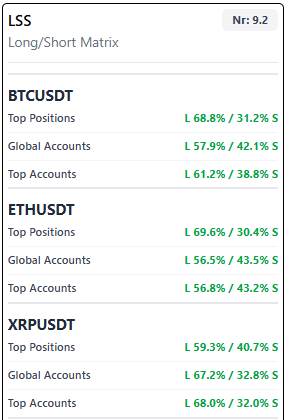
Each asset (such as BTC, ETH, or SOL) displays a percentage split for these three tiers. Here is how you interpret the data:
- L (Long %): Traders betting on a price increase.
- S (Short %): Traders betting on a price decrease.
- LSS Score (e.g., 9.2): A proprietary numerical score that aggregates total sentiment and pressure. A higher score in the LSS Long/Short Matrix typically indicates stronger bullish conviction across all tiers.
The Power of Divergence in the LSS Long/Short Matrix
The true value of this tool lies in spotting Divergence—the moment when different groups of traders disagree.
Bullish Divergence (Short Squeeze Setup)
Imagine if Global Accounts (Retail) are 70% Short, but Top Positions (Heavy Capital) are 70% Long. This is a classic recipe for a “Short Squeeze.” Institutional players are trapping retail shorts here, making it likely the price will shoot up violently.
Bearish Divergence (Long Flush)
If Global Accounts (Retail) are 80% Long (extreme greed), but Top Positions (Heavy Capital) are heavily Short, a crash or “Long Flush” is likely. This indicates institutions are dumping their “bags” onto retail buyers. The LSS Long/Short Matrix warns you of this early.
Convergence
When all three tiers are in agreement (e.g., all >60% Long), it signals a high-conviction trend that is likely to continue in the short term.
Integration with MMS V2
The LSS Long/Short Matrix does not work in isolation; it provides an essential “Human Sentiment” filter for the Market Macro Score (MMS).
- Contrarian Signal: When retail sentiment (Global Accounts) reaches extremes (>75% in one direction), the MMS will often flag a “Contrarian Warning.”
- Whale Tracking: If Top Positions suddenly flip from Long to Short, the MMS will preemptively trigger a
REDUCE_EXPOSUREwarning, even if the retail crowd is still fanatically “buying the dip.”
Summary and Trader’s Tip
Below is a quick overview of how to use each category:
| Category | Represents | Value to the Trader |
| Global Accounts | Retail Crowd | Used to identify “Crowded Trades” (Traps). |
| Top Accounts | Large Players | Confirms the bias of professional accounts. |
| Top Positions | Heavy Capital (Size) | Shows the real trend and institutional weight. |
Trader’s Tip: Always look for consistency within the LSS Long/Short Matrix. If an asset like XLM shows a majority Short (S) across all three tiers, the market is often “oversold.” A violent bounce (short squeeze) then becomes highly probable.
⚠️ RISK WARNING & AI DISCLOSURE
- This information is generated by Artificial Intelligence (AI) and complex algorithms. While advanced, these systems can contain errors or inaccuracies and are for educational purposes only.
- Technical analysis provides no guarantees; this information is purely informative.
- All discussed scenarios are hypothetical and do not constitute predictions or expectations.
- Past performance is not an indicator of future results.
- This is not financial advice and is not intended as a call-to-action for the reader.
- No implicit direction is claimed, and no specific behavior of market participants is suggested.