KPI: LPI (Leverage Pressure Index)
Assessing Market Fragility: The Leverage Pressure Index (LPI)
The Leverage Pressure Index (LPI) is a risk-management KPI designed to measure the estimated “weight” of speculative positions in the market. While price action indicates direction, the LPI analyzes the structure of that movement. It identifies periods where the market is statistically “over-leveraged,” a condition often associated with rapid price reversals known as Liquidation Cascades.
1. Core Concept: Market “Heaviness”
In the crypto market, high leverage (borrowed funds) is frequently utilized. When a significant concentration of traders is positioned in the same direction using high leverage, the market structure is technically considered “top-heavy.”
- Long Pressure: Occurs when a high volume of traders are leveraged long. In this state, a small price dip can trigger stop-loss orders or liquidations, potentially causing a cascade of selling (Long Squeeze).
- Short Pressure: Occurs when a high volume of traders are leveraged short. A small price increase can force buy-backs, potentially causing a rapid price spike (Short Squeeze).
The LPI quantifies this pressure, allowing analysts to monitor the potential for volatility events.
2. Technical Components
The LPI algorithm calculates pressure by correlating two primary data sources:
- Funding Rates: The periodic cost of holding a leveraged position.
- High Positive: Indicates strong demand for long positions (longs paying shorts).
- High Negative: Indicates strong demand for short positions (shorts paying longs).
- Open Interest (OI) Change: Measures the total number of outstanding derivative contracts. Rising OI indicates new capital (and potential leverage) entering the market.
By combining these metrics, the LPI assesses if price action is supported by Spot volume (historically more stable) or driven by Derivatives (historically more volatile).
3. Asset-Specific LPI
The dashboard provides a global LPI as well as asset-specific breakdowns to pinpoint risk concentration:
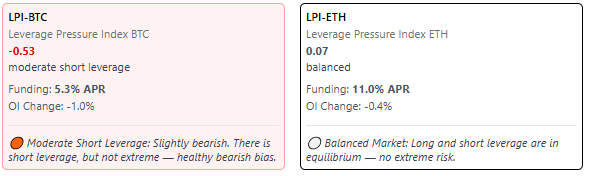
- LPI-BTC: Monitors leverage pressure specifically on Bitcoin futures.
- LPI-ETH: Monitors leverage pressure specifically on Ethereum futures.
Analytical Utility: It is common for Bitcoin to display a neutral LPI while Ethereum appears “overheated.” This data allows users to differentiate between broad market risk and asset-specific volatility risk.
4. Reading the LPI Signals
The LPI is displayed as a numerical value with color-coded status indicators:
🟢 Low Pressure (Negative/Low Score)
- Status: The market is not exhibiting signs of over-leverage.
- Interpretation: Price movements in this zone are statistically more likely to be driven by Spot demand rather than speculative positioning. Technical analysts often view this as a more stable environment for trend formation.
⚪ Neutral (Balanced)
- Status: Leverage is at sustainable levels relative to volume.
- Interpretation: No immediate leverage imbalance is detected.
🔴 High Pressure (Positive/High Score)
- Status: Elevated Risk. The market is showing signs of overcrowding in leveraged positions.
- Interpretation: Historically, high LPI scores correlate with an increased probability of a “flush” (volatility event) as the market seeks to reset open interest.
5. Integration with MMS V2
The LPI acts as a risk filter for the MMS (Market Macro Score) algorithm.
- Confidence Adjustment: If the MMS identifies a “Growth” trend but the LPI is Red, the system logic lowers the internal confidence score. This reflects the analysis that while the trend direction is bullish, the structure is “fragile” due to excessive leverage.
- Trend Exhaustion: In a mature trend phase, a rapidly rising LPI is often monitored as a potential signal of an approaching correction.
6. Summary of LPI Scenarios
| Price Action | LPI Status | Market Structure Interpretation |
| Price Rising | 🟢 Low LPI | Spot-Driven Rally: Movement supported by organic demand; often viewed as sustainable. |
| Price Rising | 🔴 High LPI | Leverage-Driven Rally: Movement supported by borrowing; technically susceptible to long squeezes. |
| Price Falling | 🔴 High LPI | Short Squeeze Potential: Market is heavily short; technically susceptible to a rapid upward reversion if shorts cover. |
⚠️ RISK WARNING & AI DISCLOSURE
- This information is generated by Artificial Intelligence (AI) and complex algorithms. While advanced, these systems can contain errors or inaccuracies and are for educational purposes only.
- Technical analysis provides no guarantees; this information is purely informative.
- All discussed scenarios are hypothetical and do not constitute predictions or expectations.
- Past performance is not an indicator of future results.
- This is not financial advice and is not intended as a call-to-action for the reader.
- No implicit direction is claimed, and no specific behavior of market participants is suggested.