KPI: EMA & Mean Reversion
Trend & Deviation Analysis: EMA & Mean Reversion
The EMA (Exponential Moving Average) and Mean Reversion KPIs are fundamental technical tools used to identify trend direction and potential price deviations. While the EMA identifies the current momentum, Mean Reversion logic analyzes the statistical probability of the price returning to its average value.
Together, these metrics assist traders in assessing whether a trend is sustainable or if the asset is statistically overextended.
1. EMA: Trend Identification
The Exponential Moving Average (EMA) is a moving average calculation that places greater weight on the most recent data points. This characteristic makes it more responsive to new price information compared to a Simple Moving Average (SMA).
- Bullish Alignment: In technical analysis, when the price is trading above the EMA, the trend is generally considered bullish.
- Bearish Alignment: When the price is trading below the EMA, the trend is generally considered bearish.
- The “Stack”: The system analyzes multiple EMAs (e.g., 20, 50, and 200). When shorter-term EMAs are positioned above longer-term EMAs, it is technically interpreted as a confirmation of upward momentum.
2. Mean Reversion: Statistical Deviation
Mean Reversion is a financial theory suggesting that asset prices and historical returns eventually return to their long-term mean or average level.
The Deviation Concept:
- Expansion: As price moves further away from the EMA, the “deviation” increases.
- Normalization: Historically, extreme deviations are often followed by a return to the average (the EMA).
- Overextended (High): Price is significantly above the EMA; statistical analysis suggests a higher potential for a pullback or consolidation.
- Overextended (Low): Price is significantly below the EMA; statistical analysis suggests a higher potential for a relief rally.
3. Key Metrics & Interpretation
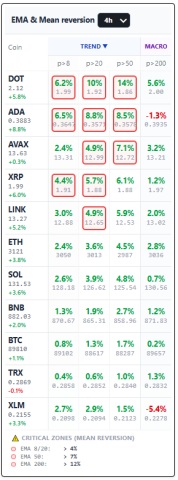
The dashboard provides a status based on the calculated distance between the current price and the EMA anchors:
- 🟢 Healthy Trend: Price is trending above the EMA with a moderate distance. This is typically interpreted as sustainable growth.
- 🟡 Overextended: Price has moved significantly away from the EMA. In technical theory, this state suggests the asset is “extended” relative to its norm, often preceding a cooling-off period.
- 🔴 Mean Reversion Trigger: The distance has reached an extreme historical level. The algorithm identifies this as a statistical outlier where price has historically tended to revert toward the mean.
4. Market Scenarios & Technical Context
| Price vs. EMA | Distance | Signal | Technical Interpretation |
| Above EMA | Small/Medium | 🟢 Trend Strength | Uptrend continuation supported by momentum. |
| Above EMA | Large (Extreme) | 🟡 Overbought | Price is extended; increased volatility risk. |
| Below EMA | Small/Medium | 🔴 Trend Weakness | Downtrend continuation supported by momentum. |
| Below EMA | Large (Extreme) | 🟢 Oversold | Price is deviated to the downside; potential for normalization. |
5. Integration with MMS V2
The EMA and Mean Reversion data are fed directly into the MMS (Market Macro Score) algorithm to filter signals:
- Signal Validation: The MMS logic is designed to reduce signal strength (e.g., avoiding “Strong Buy”) if the price is already extremely overextended from the Daily EMA, as the technical risk/reward profile is considered less favorable.
- Strategy Adjustment: If the market is in a “Growth” phase but Mean Reversion triggers are active, the MMS may shift its internal status to “HOLD” or “DCA” to await a technical retracement closer to the average.
6. Sync & Correlation
The system also monitors the correlation of Mean Reversion signals across the market:
- Sector Rotation: If Bitcoin (BTC) is flagged as overextended but the Total3 (Altcoin Market Cap) is still close to its EMA, the system may interpret this as a potential for capital rotation into the altcoin sector.
Educational Concept: Trend Persistence
In technical analysis, it is a common adage not to “fight the trend.” If the price is consistently trending below the EMA, attempting to buy the bottom before a confirmed reclaim of the EMA is considered a high-risk strategy. While prices statistically revert to the mean, trends can persist in overextended states for longer than anticipated.
⚠️ RISK WARNING & AI DISCLOSURE
- This information is generated by Artificial Intelligence (AI) and complex algorithms. While advanced, these systems can contain errors or inaccuracies and are for educational purposes only.
- Technical analysis provides no guarantees; this information is purely informative.
- All discussed scenarios are hypothetical and do not constitute predictions or expectations.
- Past performance is not an indicator of future results.
- This is not financial advice and is not intended as a call-to-action for the reader.
- No implicit direction is claimed, and no specific behavior of market participants is suggested.