DIV – Divergences
Momentum Analysis: The 🔁 DIV Tab
A common analogy in technical analysis compares price momentum to a car driving up a hill. If the driver takes their foot off the gas pedal, the car may continue moving forward for a moment due to inertia, but it will eventually slow down and reverse.
This phenomenon in markets is known as Divergence. It occurs when price continues to rise, but the underlying momentum and volume are fading. The 🔁 DIV tab in AiTraderView automates the Divergence Trading Strategy by scanning five distinct indicators simultaneously—RSI, MACD, OBV, Stoch, and Volume—to identify potential signals of reversal or continuation.
What is a Divergence Trading Strategy?
A Divergence Trading Strategy involves identifying a disagreement between price action and technical indicators.
- Bullish Divergence: Price makes a Lower Low, but the Indicator makes a Higher Low.
- Technical Signal: Momentum is strengthening despite price dropping, often indicating potential exhaustion of sellers.
- Bearish Divergence: Price makes a Higher High, but the Indicator makes a Lower High.
- Technical Signal: Momentum is weakening despite price rising, often indicating potential exhaustion of buyers.
The 🔁 DIV tab automates this process by cross-referencing this logic across five data points.
The 5 Pillars of the 🔁 DIV Tab
While basic analysis often relies solely on RSI, the 🔁 DIV tab analyzes a broader spectrum of data to confirm trend validity:
1. RSI (Relative Strength Index)
- Function: Standard momentum oscillator.
- Interpretation: If price is rising but RSI is falling, it indicates the rate of change is slowing. This is a classic signal of trend deceleration.
2. MACD (Moving Average Convergence Divergence)
- Function: Trend-following momentum indicator.
- Interpretation: MACD divergence is often viewed as a significant structural signal. A Bearish MACD divergence suggests that the short-term momentum is decoupling from the longer-term trend.
3. OBV (On Balance Volume)
- Function: Tracks cumulative volume flow to estimate buying vs. selling pressure.
- Interpretation: If price is flat or dropping, but OBV is rising, technical analysts interpret this as Accumulation. This suggests that volume is entering the asset even if price hasn’t reflected it yet.
4. Stoch (Stochastic Oscillator)
- Function: Momentum indicator sensitive to closing prices.
- Interpretation: Useful for spotting divergences in ranging (sideways) markets. It assists in pinpointing momentum shifts within defined overbought or oversold conditions.
5. VOL (Volume Divergence)
- Function: Analyzing raw volume bars relative to price action.
- Interpretation: Based on the “Effort vs. Result” principle. If price makes a new High (Result), but Volume is lower than the previous high (Less Effort), it is a Volume Anomaly. This suggests the breakout lacks broad participation.
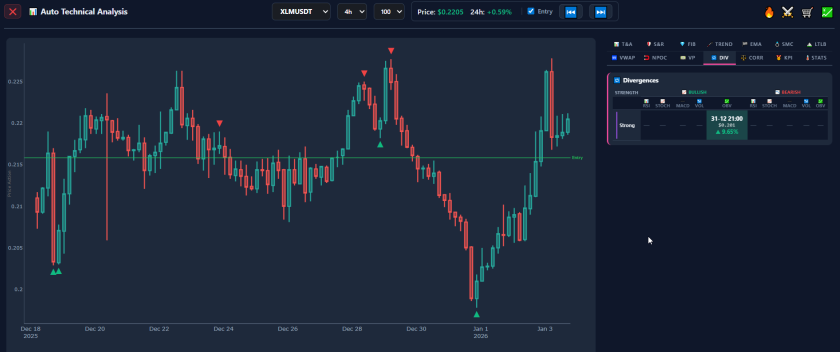
Interpreting the Matrix
The 🔁 DIV tab presents these indicators in a matrix format.
- Prominent Signal (Bold/Color): The algorithm has detected a clear divergence based on its parameters.
- Weak Signal: A minor divergence is detected. Traders often wait for further confirmation.
- The Power of Confluence: The most robust analysis relies on confluence.
- Scenario: If only Stoch shows divergence, it may be a short-term fluctuation.
- Scenario: If RSI, MACD, and VOL all show Bearish Divergence simultaneously, the technical weight of the signal increases significantly. The 🔁 DIV tab allows users to identify this “Cluster” instantly.
Technical Concepts Using the 🔁 DIV Tab
Here is how these insights are applied in market analysis:
Concept 1: Volume Analysis (VOL & OBV)
- The Check: Price is breaking out to a new high.
- The Signal: VOL and OBV are flashing “Bearish.”
- Interpretation: This indicates the price is rising on declining volume. Technical analysts often view this as a False Breakout or “Bull Trap,” looking for price to fail and return to the previous range.
Concept 2: Momentum Reversal (RSI & MACD)
- The Check: The market is in a steep sell-off.
- The Signal: The 🔁 DIV tab shows “Bullish Divergence” on RSI and MACD.
- Interpretation: This indicates that while price is still dropping, the selling pressure is diminishing. This is often used to time entries for Mean Reversion strategies.
Concept 3: Hidden Divergence (Trend Continuation) The tool also detects “Hidden Divergence,” which signals trend continuation rather than reversal.
- Bullish Hidden: Price makes a Higher Low, but RSI makes a Lower Low.
- Interpretation: This is technically viewed as a signal to join the existing uptrend (“Buy the Dip”), suggesting the oscillator is resetting while price structure remains bullish.
Conclusion
Technical indicators serve as the compass for price action. The 🔁 DIV tab provides directional data by automating the Divergence Trading Strategy.
By monitoring RSI, MACD, OBV, Stoch, and Volume simultaneously, AiTraderView ensures that traders are not analyzing price in a vacuum. While price represents the current value, Divergence reveals the underlying strength—or weakness—of the move.
⚠️ RISK WARNING & AI DISCLOSURE
- This information is generated by Artificial Intelligence (AI) and complex algorithms. While advanced, these systems can contain errors or inaccuracies and are for educational purposes only.
- Technical analysis provides no guarantees; this information is purely informative.
- All discussed scenarios are hypothetical and do not constitute predictions or expectations.
- Past performance is not an indicator of future results.
- This is not financial advice and is not intended as a call-to-action for the reader.
- No implicit direction is claimed, and no specific behavior of market participants is suggested.