KPI: Correlation & Lag
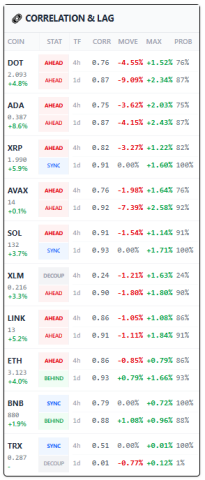
Correlation & Lag is one of predictive engine designed to identify “Alpha” by pinpointing assets that are currently lagging behind or leading the broader market trend. In the fast-paced world of cryptocurrency, timing is everything. While assets in a highly correlated market tend to move in the same direction, they rarely move at the same speed.
By calculating the mathematical relationship between an altcoin and Bitcoin, this KPI reveals which coins are primed to “catch up” and which are already exhausted.
Understanding the Core Correlation & Lag Metrics
To master this strategy, you must first understand the data. The dashboard provides a multi-timeframe view (4h and 1d) of the lead-lag relationship. Here is how the Correlation & Lag engine breaks down the market data:
1. Corr (Correlation)
This is a value between 0.00 and 1.00 representing the strength of the relationship. A score of 0.90+ means the asset is moving in near-perfect lockstep with the benchmark. High correlation is essential for this strategy to work effectively.
2. Move (The Lag Distance)
This is the most critical number in the Correlation & Lag system. It represents the percentage difference between the asset’s performance and the benchmark’s performance:
- Positive % (e.g., +1.08%): The asset is lagging. It has moved less than the benchmark and has “room” to move up to reach synchronization.
- Negative % (e.g., -4.55%): The asset is leading. It has moved more than the benchmark and is currently overextended relative to the market.
3. Prob (Probability)
This reflects statistical confidence. It is derived directly from the Correlation & Lag strength. Higher correlation equals a higher probability that the “Lag” will eventually close.
4 Market States: Interpreting the Status
The algorithm categorizes each asset into one of four states. Understanding these is vital for executing a profitable Correlation & Lag strategy.
- BEHIND (🔴 Lagging): The asset is undervalued relative to the current trend. This is a high-potential “Catch-up” trade opportunity.
- AHEAD (🚀 Leading): The asset has outperformed the benchmark. It is currently the market leader but may be nearing exhaustion.
- SYNC (🟢 In-Step): The asset and the benchmark are moving perfectly together. There is currently no lead or lag edge.
- DECOUP (⛓️ Decoupled): The correlation is too low (e.g., < 0.40). The asset is ignoring the broader market trend and moving on its own fundamentals.
Note:Check current Bitcoin price action hereto establish the baseline benchmark before analyzing alts.
How to Trade the “Catch-Up” Play
The most profitable use of the Correlation & Lag KPI is identifying BEHIND signals with High Correlation. This is where the “easy money” is often found.
- Look for BEHIND: Find a coin with a positive Move percentage (e.g., ETH 1d at +0.79%).
- Check Correlation: Ensure the Corr is high (e.g., 0.90+). This confirms the asset wants to follow the benchmark.
- Confirm Probability: A high Prob (90%+) indicates that the statistical likelihood of the coin rising to “sync” with the market is very high.
Integration with Market Macro Score (MMS)
Advanced traders use Correlation & Lag as the “Timing” layer for the [Internal Link: Market Macro Score (MMS)].
- Asset Rotation: When the MMS indicates a “Risk-On” environment, use this KPI to rotate capital into coins marked as BEHIND.
- Exhaustion Warning: If the market is in a Distribution Phase and your assets are marked as AHEAD, it signals that the local top is likely near because the leaders have run out of lag to fill.
Summary of Trading Actions
| Coin Status | TF | Move % | Action |
| BEHIND | 4h/1d | Positive (+) | High probability of a catch-up rally. |
| AHEAD | 4h/1d | Negative (-) | Asset is leading; wait for pullback. |
| SYNC | 4h/1d | 0.00% | No immediate edge. |
| DECOUP | 4h/1d | Variable | Macro analysis does not apply. |
Trader’s Tip: Always check the 1d Timeframe for high-conviction swing trades. If you see a coin like DOT or ADA marked as BEHIND on the Daily with a +2.0% Move, it is one of the strongest statistical signals that a catch-up pump is probably imminent.
⚠️ RISK WARNING & AI DISCLOSURE
- This information is generated by Artificial Intelligence (AI) and complex algorithms. While advanced, these systems can contain errors or inaccuracies and are for educational purposes only.
- Technical analysis provides no guarantees; this information is purely informative.
- All discussed scenarios are hypothetical and do not constitute predictions or expectations.
- Past performance is not an indicator of future results.
- This is not financial advice and is not intended as a call-to-action for the reader.
- No implicit direction is claimed, and no specific behavior of market participants is suggested.