CORR – Altcoins vs Bitcoin Correlation
Analyzing Asset Correlation: The ⚖️ CORR Tab
In cryptocurrency markets, Bitcoin frequently dictates the broader market trend, a phenomenon known in finance as Systematic Risk. Trading an alternative asset (altcoin) without analyzing its correlation to the market leader can lead to unquantified exposure.
The ⚖️ CORR tab in AiTraderView is designed to quantify this relationship. By utilizing Pearson Correlation and Beta metrics, this tool analyzes how closely a specific asset tracks Bitcoin’s price action.
This tab provides two layers of analysis: mathematical coefficients (raw data) and a visual overlay (The “Ghost Chart”) for detecting relative strength or weakness.
1. The Bitcoin Ghost Chart 👻
When you open the ⚖️ CORR tab, the interface displays a comparative dual-layer chart.
- Foreground: The standard candlesticks of the selected asset (e.g., Ethereum or Solana).
- Background (Ghost): A transparent overlay of Bitcoin’s (BTC) price action on the identical timeframe.
Analytical Utility: This allows for instant visual comparison.
- Lag Identification: If the overlay (BTC) moves significantly while the asset remains flat, a visual divergence is identified.
- Relative Strength: If the overlay (BTC) declines while the asset holds support, the asset is displaying Relative Strength, a key metric in trend analysis.
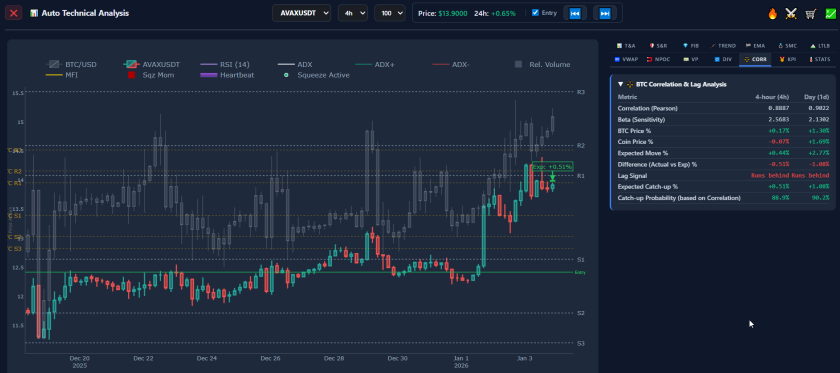
2. Understanding the Correlation Matrix
The data table below the chart quantifies the relationship:
Correlation (Pearson Coefficient)
This metric measures the linear relationship between the two assets.
- Range: -1.0 to +1.0.
- High Positive (> 0.8): The asset is statistically tethered to Bitcoin. Historically, directional moves in BTC are likely to be mirrored by this asset.
- Negative (< 0.0): The asset is moving inversely to Bitcoin. This data is often used for hedging strategies.
Beta (Sensitivity) Beta measures the asset’s volatility relative to Bitcoin.
- Beta = 1.0: The asset historically matches Bitcoin’s percentage moves (1:1 ratio).
- Beta > 1.0 (e.g., 2.56): The asset is “High Beta.” Technically, if BTC moves 1%, the asset is statistically expected to move 2.56%.
- Strategy Context: In “Risk-On” environments, traders often seek High Beta assets to maximize exposure to the trend.
Expected Move % vs. Actual Move The algorithm calculates the theoretical price performance based on Beta.
- Example:
- BTC Price %: +1.30%
- Beta: 2.13
- Theoretical Move: +2.77%
- Actual Move: +1.69%
The “Lag Signal” (Performance Gap) The tool compares the Theoretical Move against the Actual Move.
- Gap: -1.08% (The asset is underperforming its statistical Beta).
- Signal: Runs behind.
- Interpretation: Traders analyzing this data might identify the asset as “undervalued” relative to the market leader, hypothesizing a potential Mean Reversion where the asset catches up to its expected price.
3. Correlation-Based Strategies
Concept 1: The “Lag” Play (Mean Reversion)
- Scan: Identify an asset with High Correlation (> 0.85) and High Beta.
- Trigger: Bitcoin executes a significant move.
- Check: The specific asset has not yet reflected this move (Signal: Runs behind).
- Theory: If the correlation holds, the asset may statistically be due for a rapid price adjustment to realign with Bitcoin.
Concept 2: Relative Strength (Divergence)
- Trigger: Bitcoin (Ghost Chart) experiences a drawdown (-5%).
- Check: The selected asset shows resilience (e.g., down only -1%), with the signal Runs ahead.
- Theory: The asset is displaying demand independent of Bitcoin. Technical analysis suggests that if the broader market stabilizes, assets showing Relative Strength are often the first to outperform.
Conclusion
The ⚖️ CORR tab reduces reliance on guesswork regarding market cycles. It provides mathematical data on which assets are statistically tethered to Bitcoin and which are deviating.
By analyzing Beta and Lag metrics, traders can make data-driven decisions, focusing on assets that demonstrate either clear statistical inefficiency (Lag) or verifiable demand (Relative Strength).
⚠️ RISK WARNING & AI DISCLOSURE
- This information is generated by Artificial Intelligence (AI) and complex algorithms. While advanced, these systems can contain errors or inaccuracies and are for educational purposes only.
- Technical analysis provides no guarantees; this information is purely informative.
- All discussed scenarios are hypothetical and do not constitute predictions or expectations.
- Past performance is not an indicator of future results.
- This is not financial advice and is not intended as a call-to-action for the reader.
- No implicit direction is claimed, and no specific behavior of market participants is suggested.