CME Gap Bitcoin
Institutional Gap Analysis: The 🕳️ CME Tab
A common observation among Bitcoin analysts is the tendency for price to revisit specific price ranges left open by the futures market, known as CME Gaps. While not a mathematical certainty, historical data indicates a statistical tendency for these gaps to “fill” over time.
The 🕳️ CME tab in AiTraderView is a specialized tool designed exclusively for Bitcoin (BTC). It tracks the price gaps created by the operating hours of the Chicago Mercantile Exchange (CME). While crypto markets operate 24/7, institutional futures markets close on weekends, creating potential price disparities that analysts monitor closely.
In this article, we explain the mechanics of CME Gap Analysis and how to interpret the data in the 🕳️ CME tab.
What is a CME Gap?
Crypto spot markets trade 24/7/365. However, traditional institutional markets (like the CME) pause trading from Friday evening to Sunday evening.
- The Mechanism: If Bitcoin’s price moves significantly (e.g., from $50,000 to $55,000) over the weekend, the CME chart will still reflect Friday’s closing price of $50,000. When the CME market reopens on Monday, the chart begins at $55,000, creating a literal “gap” in price action between $50k and $55k.
- The Theory: Market efficiency theory suggests that price often reverts to these gaps to bridge the discontinuity between the futures close and the spot price. This process is technically referred to as “filling the gap.”
What You See in the 🕳️ CME Tab
Because this phenomenon is specific to institutional Bitcoin futures, the 🕳️ CME tab is only active when analyzing Bitcoin (BTC).
1. The CME Chart The chart visualizes the CME Bitcoin Futures price action.
- The Gaps: Highlighted rectangular zones indicate price ranges where no trading occurred on the futures chart.
- The Fill: Once a candle wick enters and traverses the empty zone, the gap is technically considered “Filled” and is removed from the active target list.
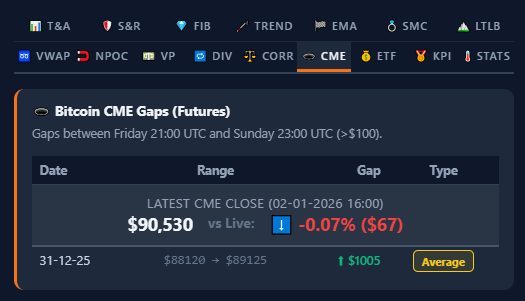
2. The Gap Table Below the chart, a table lists all currently Open (Unfilled) Gaps.
- Type: Indicates the gap’s position relative to the current price (e.g., Below Price implies a potential downside target; Above Price implies a potential upside target).
- Range: The specific dollar values defining the gap (e.g., $24,500 – $25,200).
- Distance: The percentage distance between the current live price and the gap.
Strategies for CME Gap Analysis
Analysts use CME data to identify potential areas of interest for price reversion.
Concept 1: The Opening Reversion
- Scenario: A significant gap forms over the weekend (e.g., Friday close $30k, Monday open $32k).
- Analysis: Traders monitor early week price action for weakness. If momentum fades, the gap at $30k is often viewed as a technical target for mean reversion.
Concept 2: Historical Gap Targeting Some gaps remain open for extended periods.
- The Check: Review the 🕳️ CME tab table for unfilled gaps within a reasonable percentage distance.
- Analysis: If Bitcoin begins a trend towards an open gap, technical analysts often caution against assuming support will hold before the gap is completely filled. Limit orders are frequently clustered at the closure of the gap rather than the start.
Concept 3: Technical Confluence A CME Gap serves as a stronger signal when aligned with other technical factors.
- Execution: Analysts check if a gap level coincides with a Fibonacci Golden Pocket (from the 💎 FIB tab) or a Support Zone (from the 🛡️ S&R tab). The overlap of institutional targets and technical support creates a “High Confluence” setup.
Conclusion
The 🕳️ CME tab provides an institutional perspective on Bitcoin’s price action. While retail spot charts show continuous movement, the futures chart reveals structural inefficiencies.
By utilizing CME Gap Analysis, traders can identify precise price levels that algorithmic models may target to resolve market discontinuities. If a gap exists, it remains a statistically significant zone of interest until resolved.
⚠️ RISK WARNING & AI DISCLOSURE
- This information is generated by Artificial Intelligence (AI) and complex algorithms. While advanced, these systems can contain errors or inaccuracies and are for educational purposes only.
- Technical analysis provides no guarantees; this information is purely informative.
- All discussed scenarios are hypothetical and do not constitute predictions or expectations.
- Past performance is not an indicator of future results.
- This is not financial advice and is not intended as a call-to-action for the reader.
- No implicit direction is claimed, and no specific behavior of market participants is suggested.