Summary
Enhancing Trade Discipline with the Summary Module
In high-speed trading environments, maintaining a structured process is essential for consistency. The Summary Module in AiTraderView is designed to support this discipline by providing a pre-execution overview of market conditions.
In this article, we explain how this analytical tool works and how it aggregates critical data points—such as Regime Scores, RSI, and technical patterns—to assist in your decision-making process.
What is the Summary Module?
The Summary Module is an informational popup that can be triggered before finalizing a decision within the AiTraderView dashboard. Instead of focusing solely on execution, the system aggregates real-time technical health metrics for the specific asset you are analyzing.
This function acts as a Confirmation Aid, allowing users to verify that their personal trade thesis aligns with the current technical data displayed by the platform.
The 3 Pillars of the Summary Module
When you open the module (by clicking the cart icon 🛒), the tool scans the available data and categorizes findings into three distinct sections for review.
1. ✅ Market Environment
This section aggregates data regarding the broader trend and technical support.
- Regime Score: Displays the calculated trend direction based on the algorithm. A positive regime score suggests the asset is currently in an uptrend according to the system’s logic.
- S&R Proximity: The module verifies if the current price is near a calculated Support or Resistance level. In technical analysis, defined support levels are often used as reference points for risk management.
- Momentum Status: Analyzes oscillators like the Relative Strength Index (RSI). If the RSI is below 30, the system flags this as a potential “Mean Reversion” or oversold condition.
2. ⚖️ Contextual Data
This section provides background context on market dynamics.
- Volatility Squeeze: Detects if volatility is compressing (e.g., Bollinger Bands narrowing). In technical theory, periods of low volatility are often followed by periods of expansion.
- ETF Flows (Net): For major assets, this field displays available data on institutional inflows or outflows.
- Open Interest (OI): Displays changes in Open Interest, allowing users to see if capital is entering or leaving the derivatives market.
3. 🛑 Risk Indicators
This section highlights technical data that may contradict a bullish thesis.
- Overextended Conditions: Checks if the RSI or MFI is above 70. Historically, high oscillator values are associated with an increased probability of a pullback or consolidation.
- Pattern Recognition: Detects specific Price Action (PA) patterns that may suggest local exhaustion.
- Bearish Reversals: The system scans for specific candlestick formations, such as Dark Cloud Cover or Evening Star. These patterns are traditionally interpreted in technical analysis as potential reversal signals.
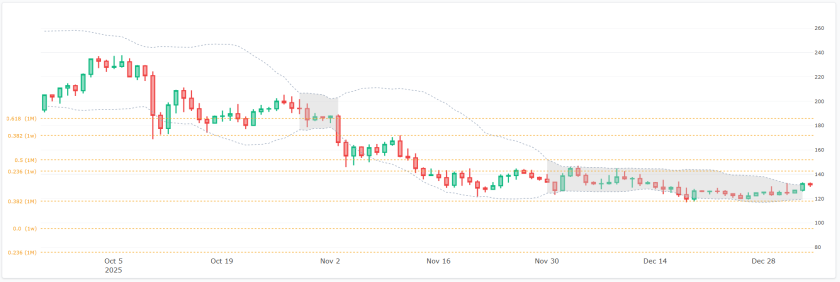
Interactive Charting Features
The Summary Module includes a fully interactive candlestick chart within the interface, allowing for a final visual check without leaving the window.
Users can toggle technical overlays to validate the data:
- Fibonacci Levels: Overlay 4h, 1d, 1w, or 1M retracement lines to visualize potential structural levels.
- Bollinger Bands (BB): Visualize volatility expansion and contraction.
- S&R Levels: Display calculated Support (S1-S3) and Resistance (R1-R3) levels to assess the distance to the next technical barrier.
How to Use the Summary Module Effectively
- Select Your Asset: Click the Summary button for your desired symbol.
- Wait for Data: The system will fetch real-time metrics (indicated by hourglass icons ⏳).
- Review Data:
- Confirm Trend: Does the Regime Score align with your analysis?
- Assess Risk: Are there active “Risk Indicators” such as bearish reversal patterns?
- Execute: If the data aligns with your strategy, you can proceed to the execution phase via the Confirm button.
Conclusion
In professional trading, capital preservation is a core objective. The Summary Module is designed to reduce impulsive behavior by introducing a structured review step. By validating a thesis against objective data points—rather than emotion—traders can maintain a more consistent and disciplined workflow.
⚠️ RISK WARNING & AI DISCLOSURE
- This information is generated by Artificial Intelligence (AI) and complex algorithms. While advanced, these systems can contain errors or inaccuracies and are for educational purposes only.
- Technical analysis provides no guarantees; this information is purely informative.
- All discussed scenarios are hypothetical and do not constitute predictions or expectations.
- Past performance is not an indicator of future results.
- This is not financial advice and is not intended as a call-to-action for the reader.
- No implicit direction is claimed, and no specific behavior of market participants is suggested.