
#7 Crypto Cockpit:CoinStats 与信息标签页
#7 Crypto Cockpit:CoinStats 与信息标签页
这两个标签页让你鸟瞰所有币种(CoinStats),并查看当前所浏览币种的文字摘要(信息)。两者都位于 **图表** 主标签页内。
## CoinStats:完整的币种表格
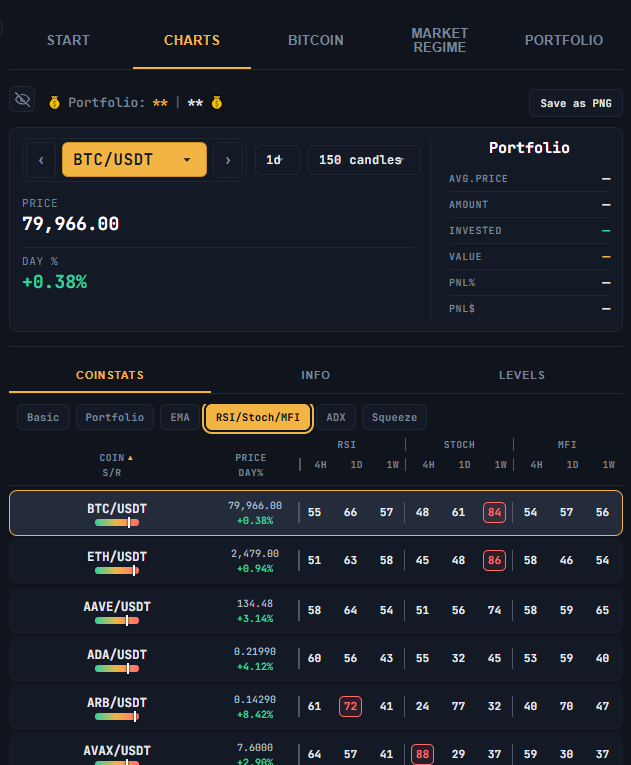
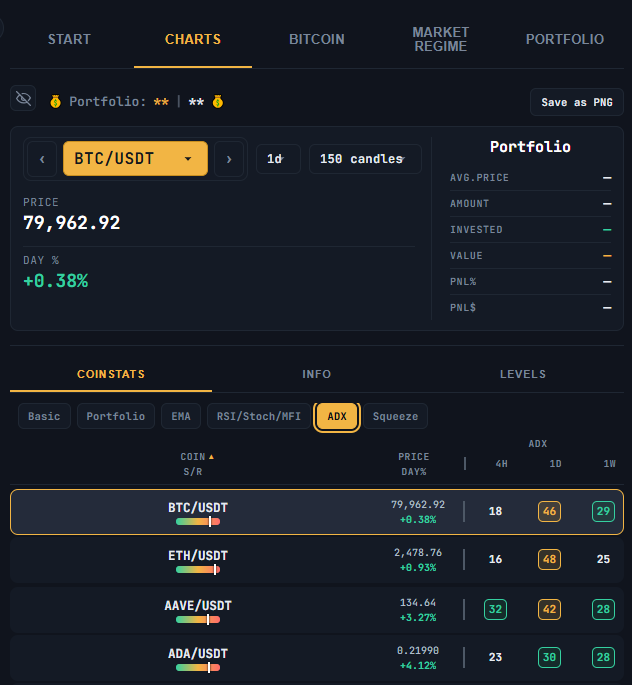
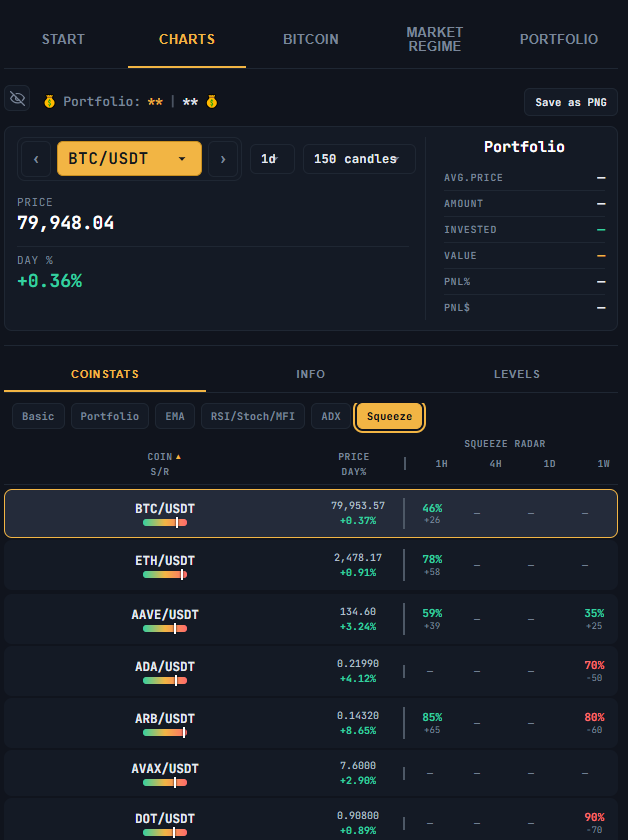
该 **CoinStats** 标签页在一张可排序的表格中显示你跟踪的每个币种,并有多个子标签页添加不同的列:
[SCREENSHOT: The CoinStats tab with the sub-tab row: Basic / Portfolio / EMA / RSI/Stoch/MFI / ADX / Squeeze]
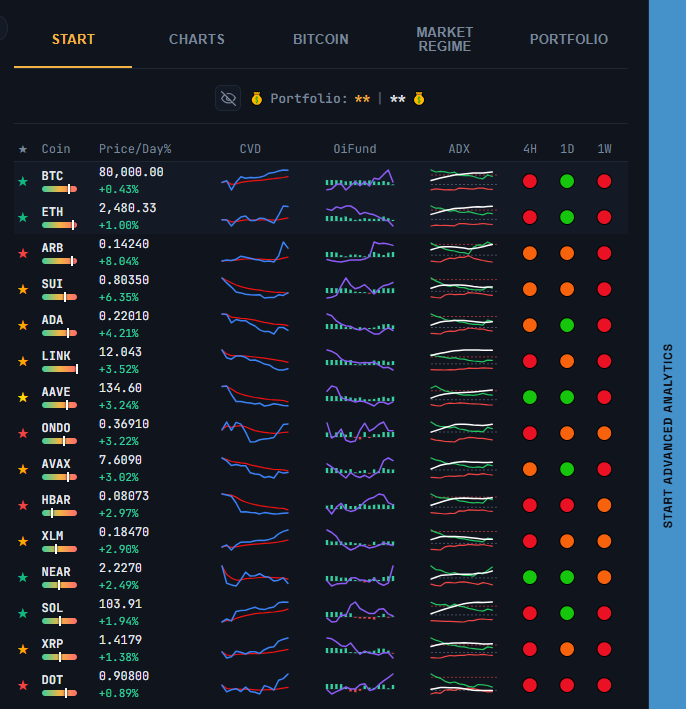
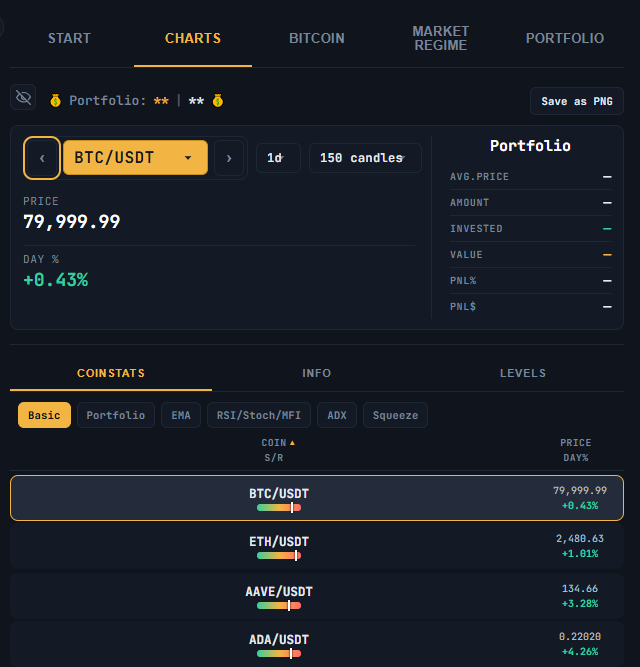
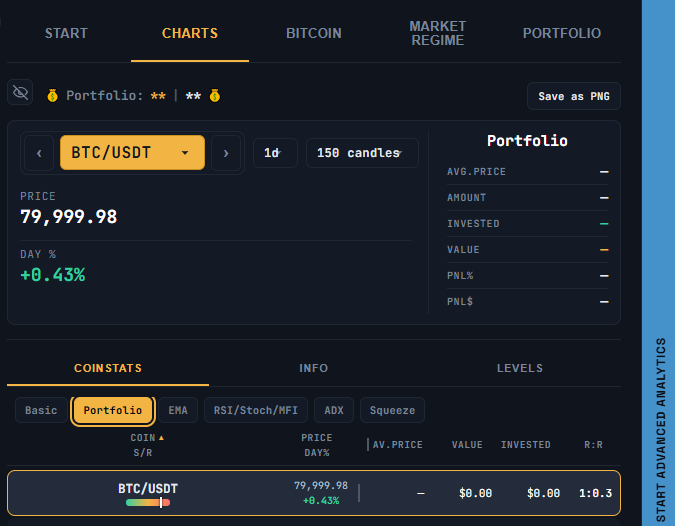
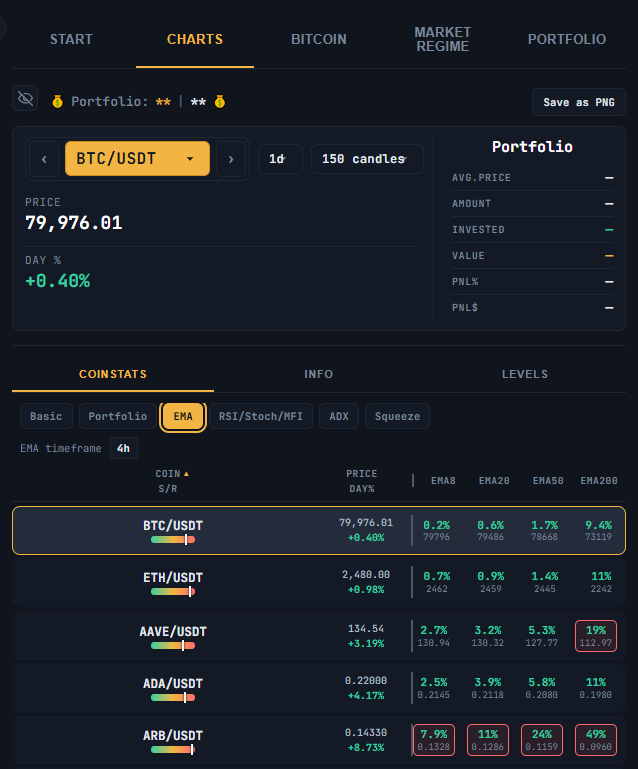
– **基础** — 币种、S/R(支撑与阻力之间的位置)、价格和日涨跌幅 %
– **投资组合** — 添加你的平均买入价、当前价值、投入金额和风险/回报比(来自 Crypto Portfolio)
– **EMA** — 显示价格与其 EMA8/20/50/200 的距离,可选择时间周期(4h/1d/1w)。距离超过设定阈值(例如,距 EMA8/20 超过 4%、距 EMA50 超过 7%、距 EMA200 超过 12%)即被视为“偏离”
– **RSI/Stoch/MFI** — 4h/1d/1w 的 RSI、随机指标和资金流量指数读数。一般参考区间:RSI/MFI 低于 20-30 通常被认为超卖,高于 70-80 为超买;随机指标低于 20 为超卖,高于 80 为超买
– **ADX** — 4h/1d/1w 的趋势强度(低于 20 通常被视为“无趋势”,高于 25 为“强趋势”,高于 40 为“非常强”,高于 50 为“极端”)
– **挤压** — 1h/4h/1d/1w 的 Squeeze Radar 读数
点击任意列标题即可按该列排序。点击某个币种的行可直接跳转到其图表。
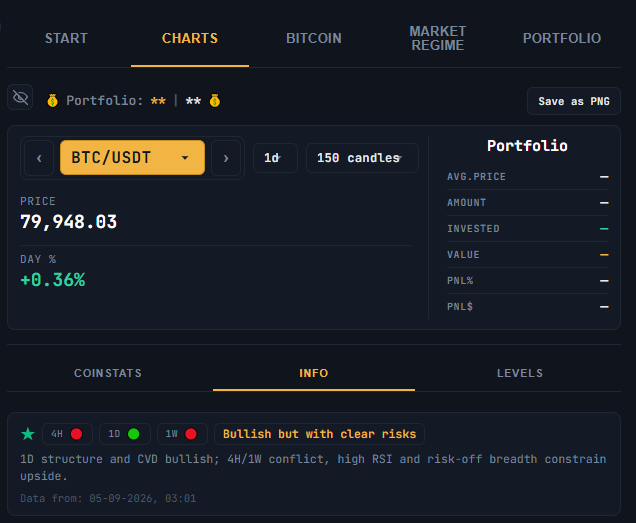
## 信息标签页:文字摘要
该 **信息** 标签页显示当前所选币种的简短文字摘要 — 其 4H/1D/1W 趋势、分类和描述,以及此分析上次生成的时间。
## 关于这些数字的说明
上文提到的超卖/超买和趋势强度区间是常用的技术分析惯例,而不是市场必须遵守的规则。此处所有数据和文字摘要都反映了对当前及近期市场数据的自动解读 — 仅供参考,不是个性化建议,也不能保证未来的价格表现。
⚠️ RISK WARNING & AI DISCLOSURE
- This information is generated by Artificial Intelligence (AI) and complex algorithms. While advanced, these systems can contain errors or inaccuracies and are for educational purposes only.
- Technical analysis provides no guarantees; this information is purely informative.
- All discussed scenarios are hypothetical and do not constitute predictions or expectations.
- Past performance is not an indicator of future results.
- This is not financial advice and is not intended as a call-to-action for the reader.
- No implicit direction is claimed, and no specific behavior of market participants is suggested.