
Discover how professional traders analyze ETH/USDT by layering advanced metrics like SMC, Orderflow, and VWAP. A technical deep dive powered by AiTraderView.
Disclaimer: The content provided in this article is for educational and informational purposes only. It does not constitute financial, investment, or trading advice. Trading cryptocurrencies involves significant risk and volatility. All analysis is based on historical data and technical indicators. Please conduct your own due diligence and consult with a certified financial advisor before making any investment decisions. This content adheres to general market commentary standards.
In the complex world of cryptocurrency trading, looking at a naked price chart is like driving with one eye closed. To understand the true market structure, you need to peel back the layers.
Today, we are analyzing the current state of Ethereum (ETH/USDT). We will start with a basic chart and progressively add advanced technical layers using the AiTraderView.com suite to demonstrate how a complete market thesis is formed.
1. The Raw Price Action: Tradingview.com (Image 1)
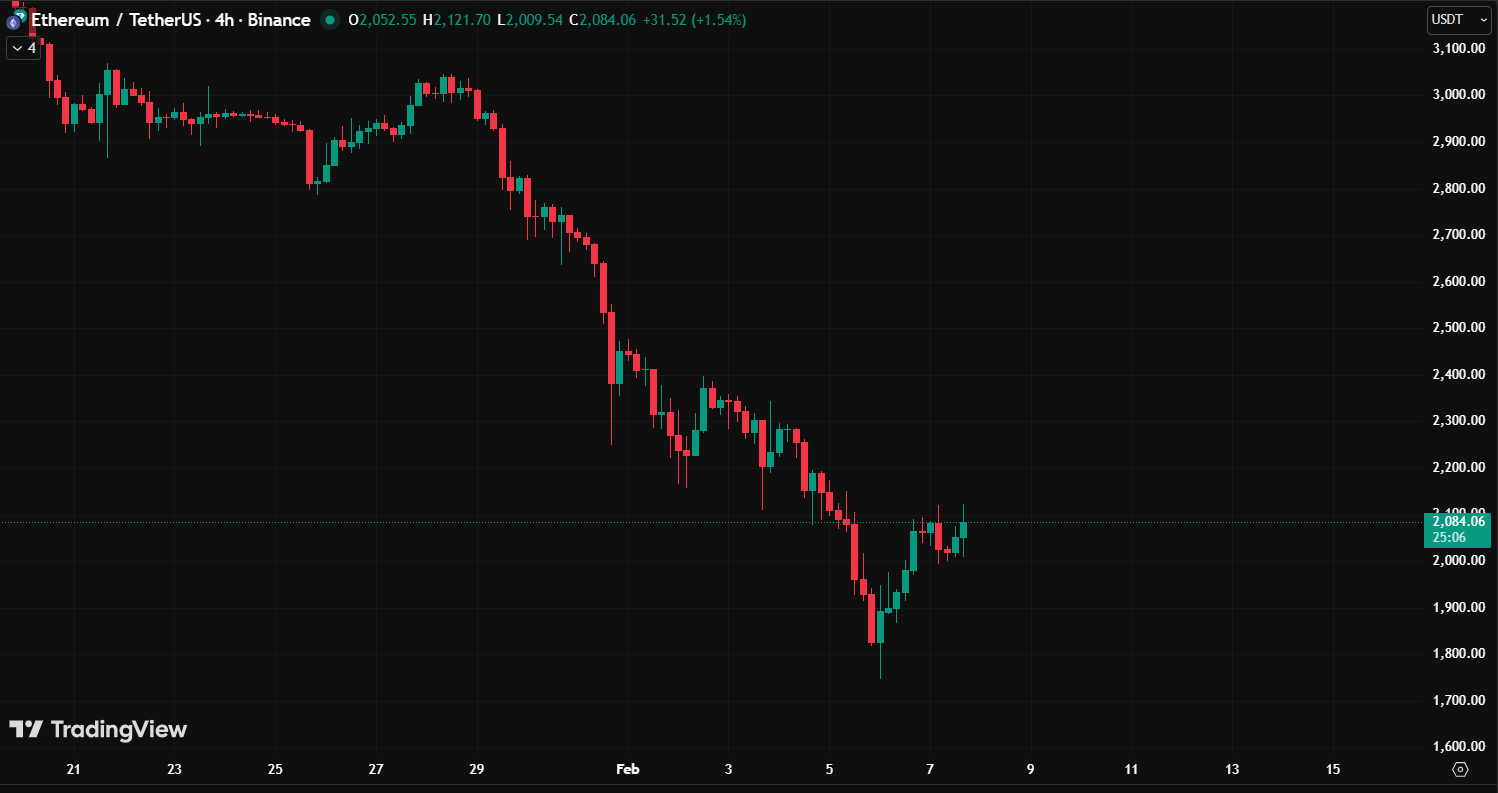
What the chart shows: We begin with the standard 4-hour chart. The trend is undeniably bearish. We observe a steep capitulation where ETH dropped from the $3,000 region to a low near $1,800. Currently, the price is staging a minor relief bounce, trading around $2,084.
The Limitation: This image tells us what happened (a crash), but it offers zero insight into why price stopped there or the strength of the current bounce. It is raw data without context.
2. Support, Resistance & Momentum (Image 2)
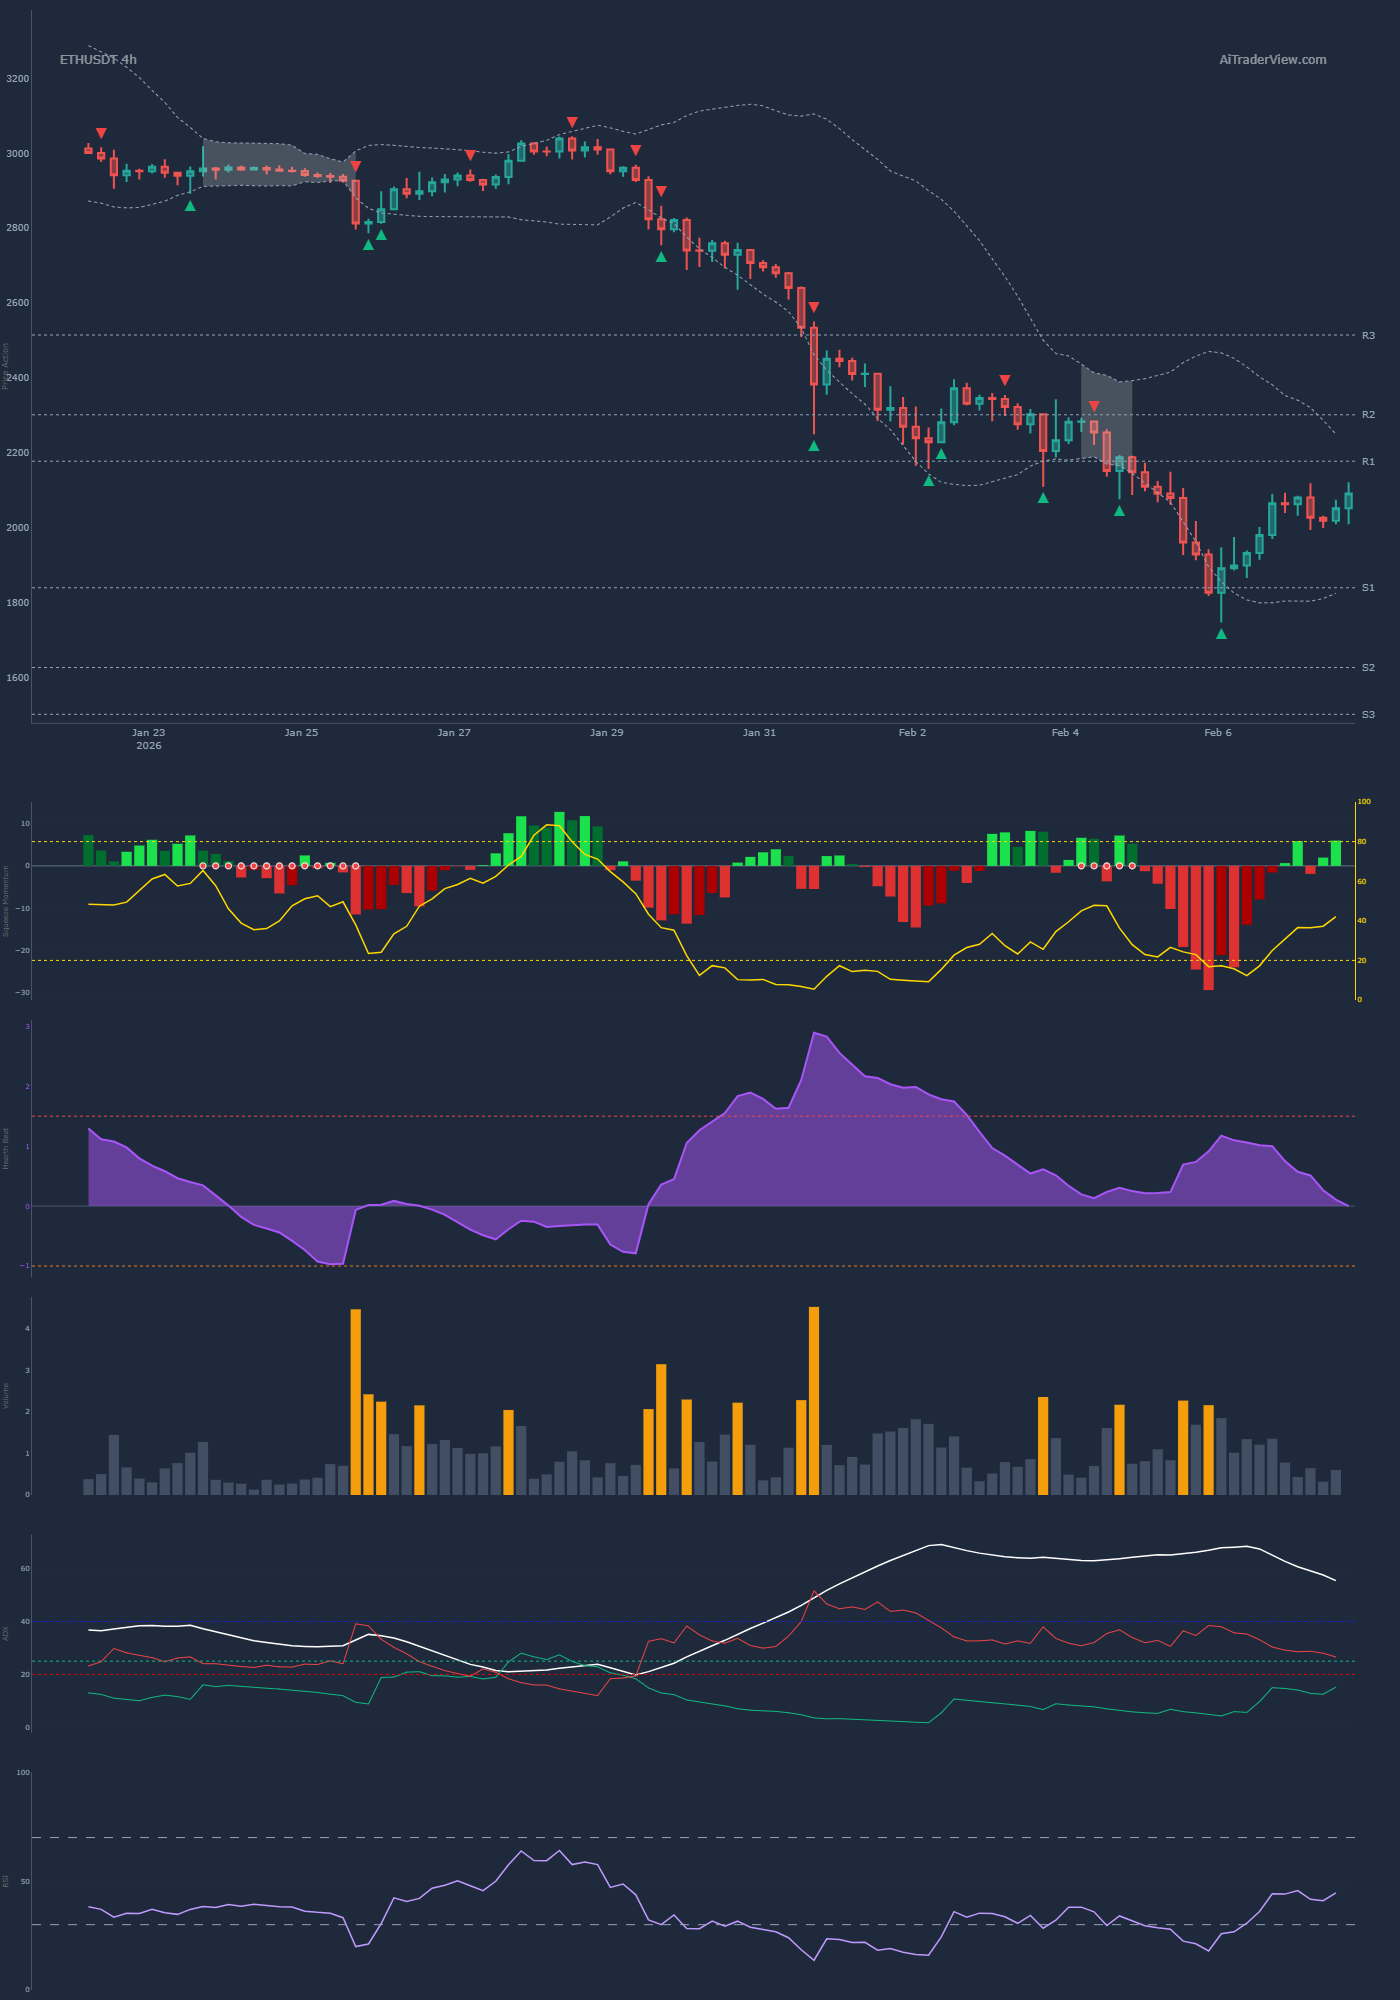
What AiTraderView adds: We overlay Support and Resistance (S&R) zones along with momentum oscillators (RSI, MACD).
- The New Insight: The bounce wasn’t random; it coincided with RSI hitting extreme oversold levels, signaling a statistical probability for a mean reversion.
- The Context: We can now see the “R1, R2, R3” levels overhead. These act as immediate ceilings. Without this layer, you wouldn’t know that despite the bounce, momentum is still resetting from a “max pain” scenario, and significant resistance lies just above at the R1 level.
3. Fibonacci Levels (Image 3)
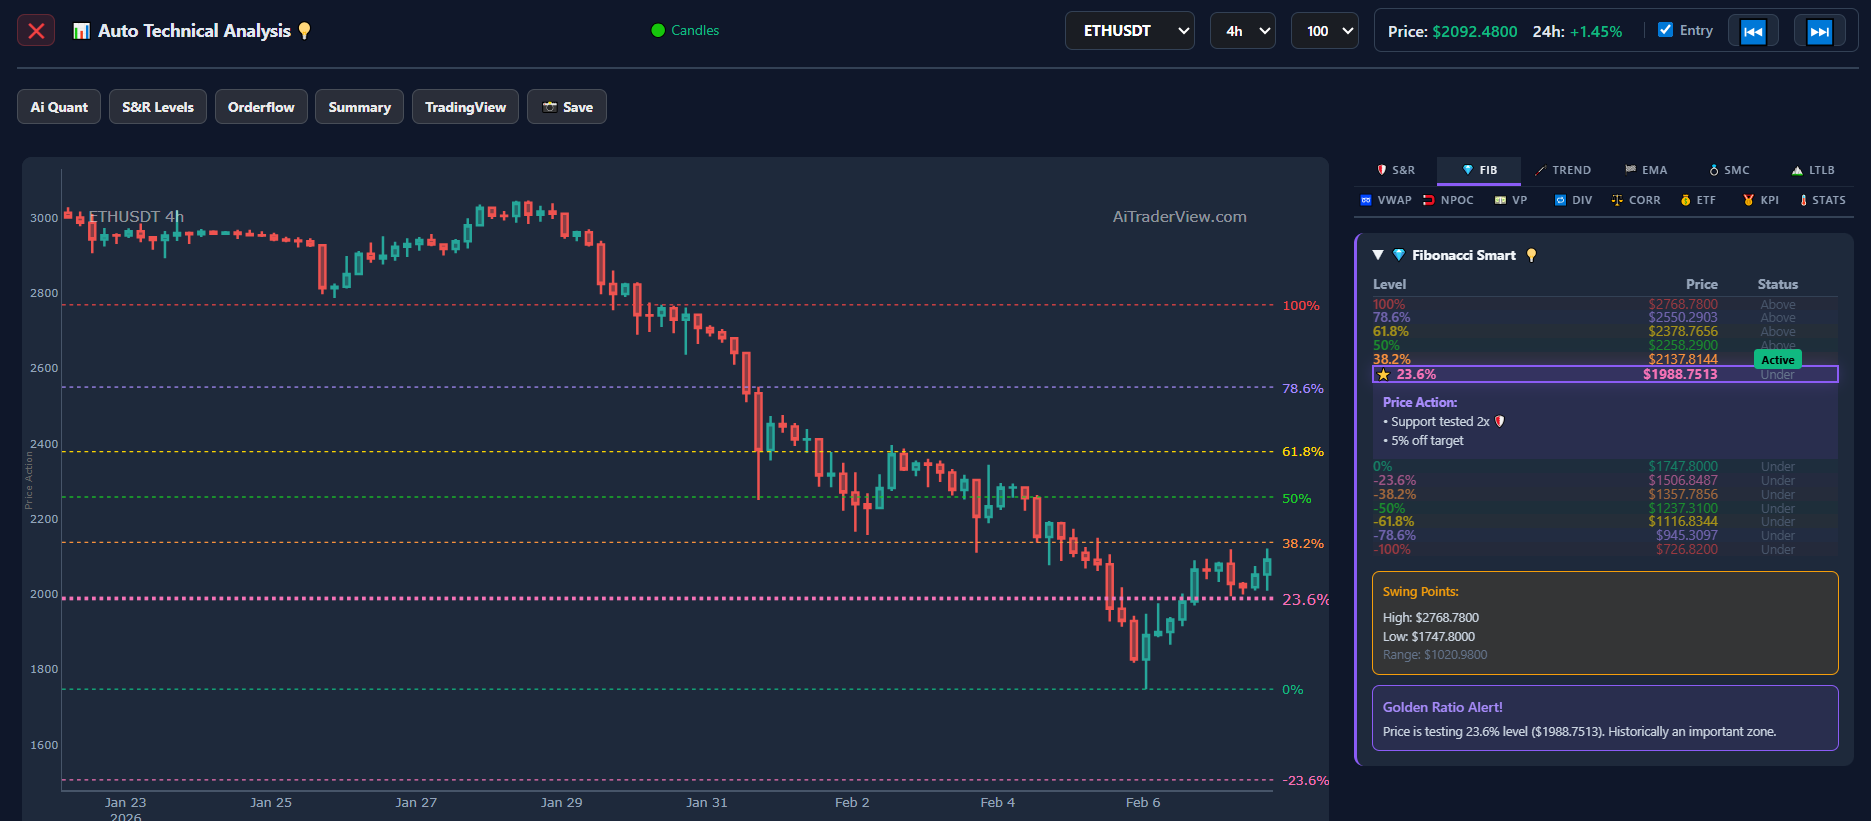
What AiTraderView adds: We apply the “Fibonacci Smart” tool to measure the retracement.
- The New Insight: The software automatically maps the swing high ($2,768) to the swing low ($1,747). Crucially, the price is currently testing the 23.6% Fibonacci level ($1,988).
- The Context: This specific level is highlighted as an “Active” zone. If ETH cannot hold above this 23.6% level, the bounce is technically invalid. Without this image, $1,988 is just a number; with it, we know it’s the minimum requirement for a continued recovery toward the 38.2% target ($2,137).
4. Trendline Structure (Image 4)
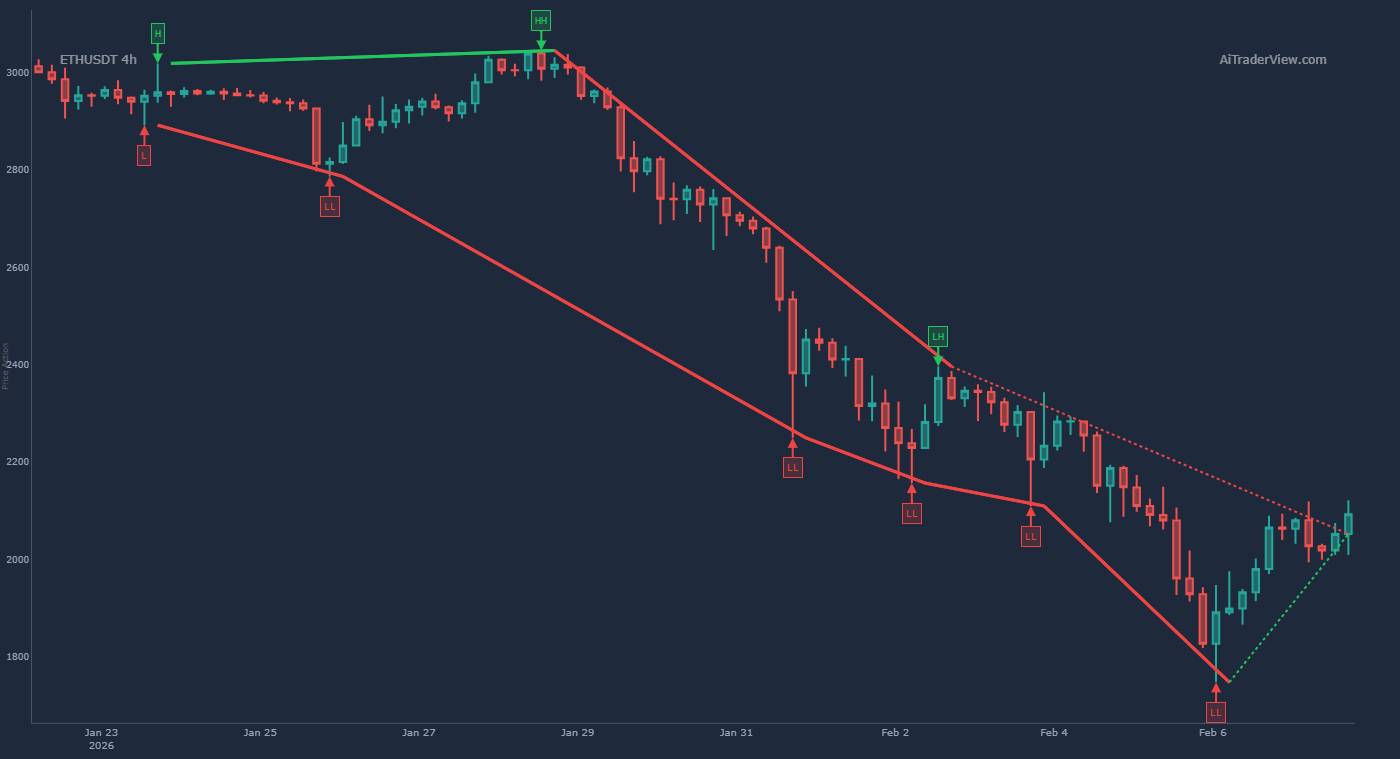
What AiTraderView adds: Here, we visualize dynamic market structure through automated trendlines.
- The New Insight: The market is moving in a clearly defined descending wedge/channel. The chart marks “LL” (Lower Lows) and “LH” (Lower Highs).
- The Context: While the price is bouncing, it is still trapped within this bearish structure. We can see the price approaching the upper diagonal trendline. Without this view, a trader might mistake a test of resistance for a breakout. This layer confirms the downtrend remains intact until a higher high is printed.
5. Moving Averages (EMAs) (Image 5)
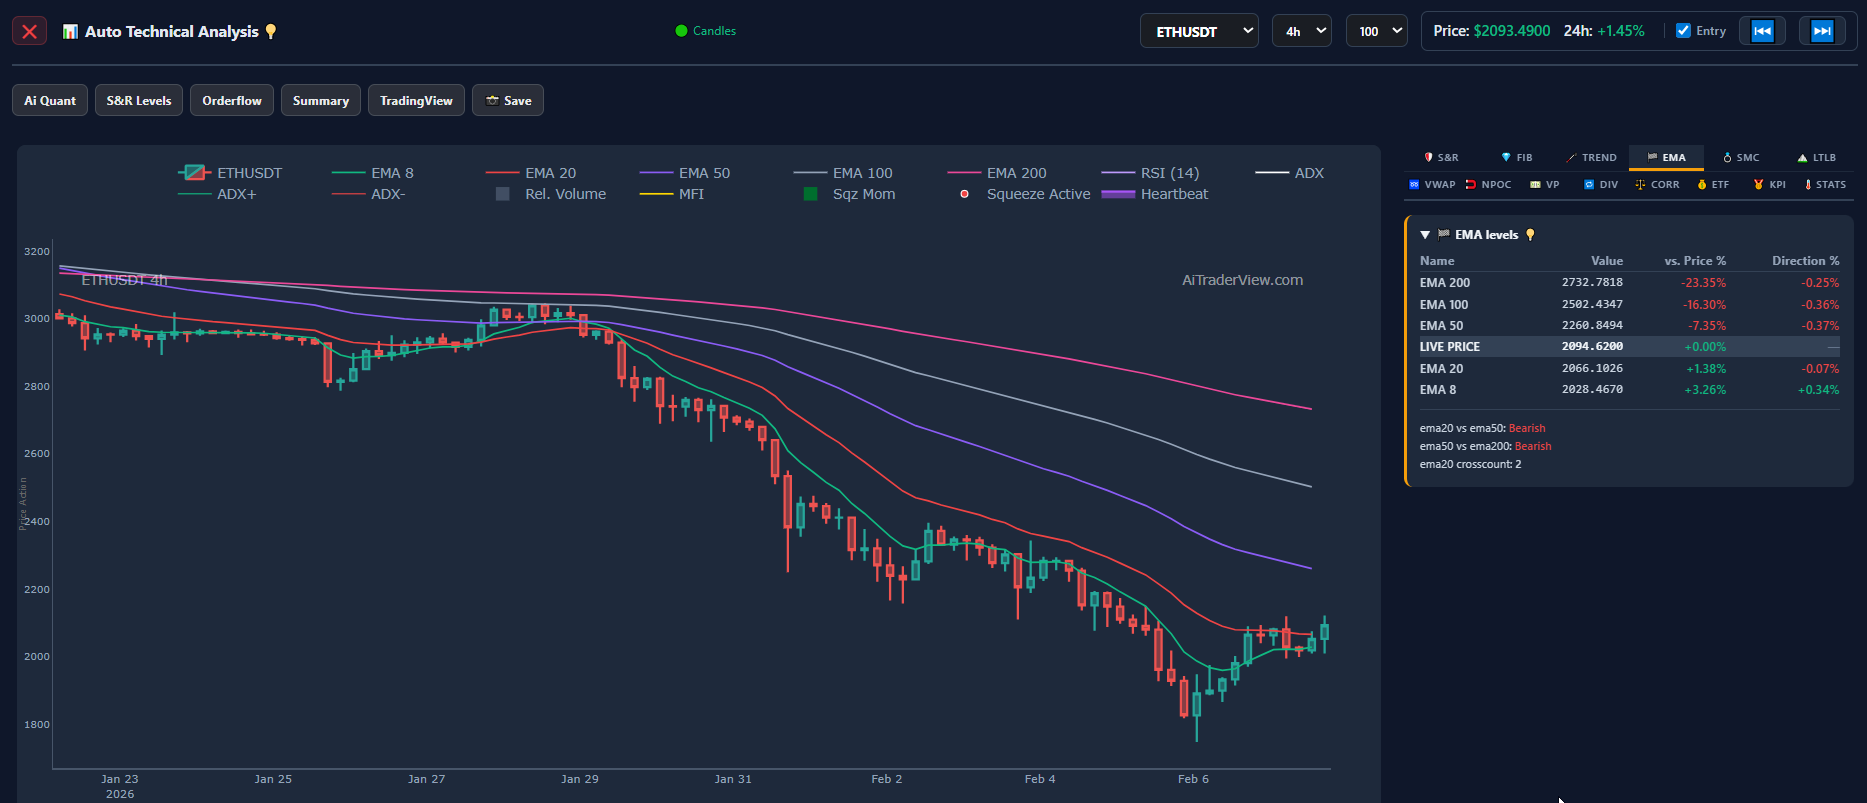
What AiTraderView adds: We analyze the Exponential Moving Averages to gauge trend strength.
- The New Insight: Price is trading well below the long-term ribbons (EMA 50, 100, 200), confirming a macro downtrend. However, on the 4H timeframe, price has reclaimed the EMA 8 and is fighting the EMA 20.
- The Context: The “fan” separation between the EMAs indicates strong selling momentum. The EMA 200 is sitting far above at $2,732. This tells us that any rally will likely face heavy institutional selling pressure at the mean.
6. Smart Money Concepts (SMC) (Image 6)
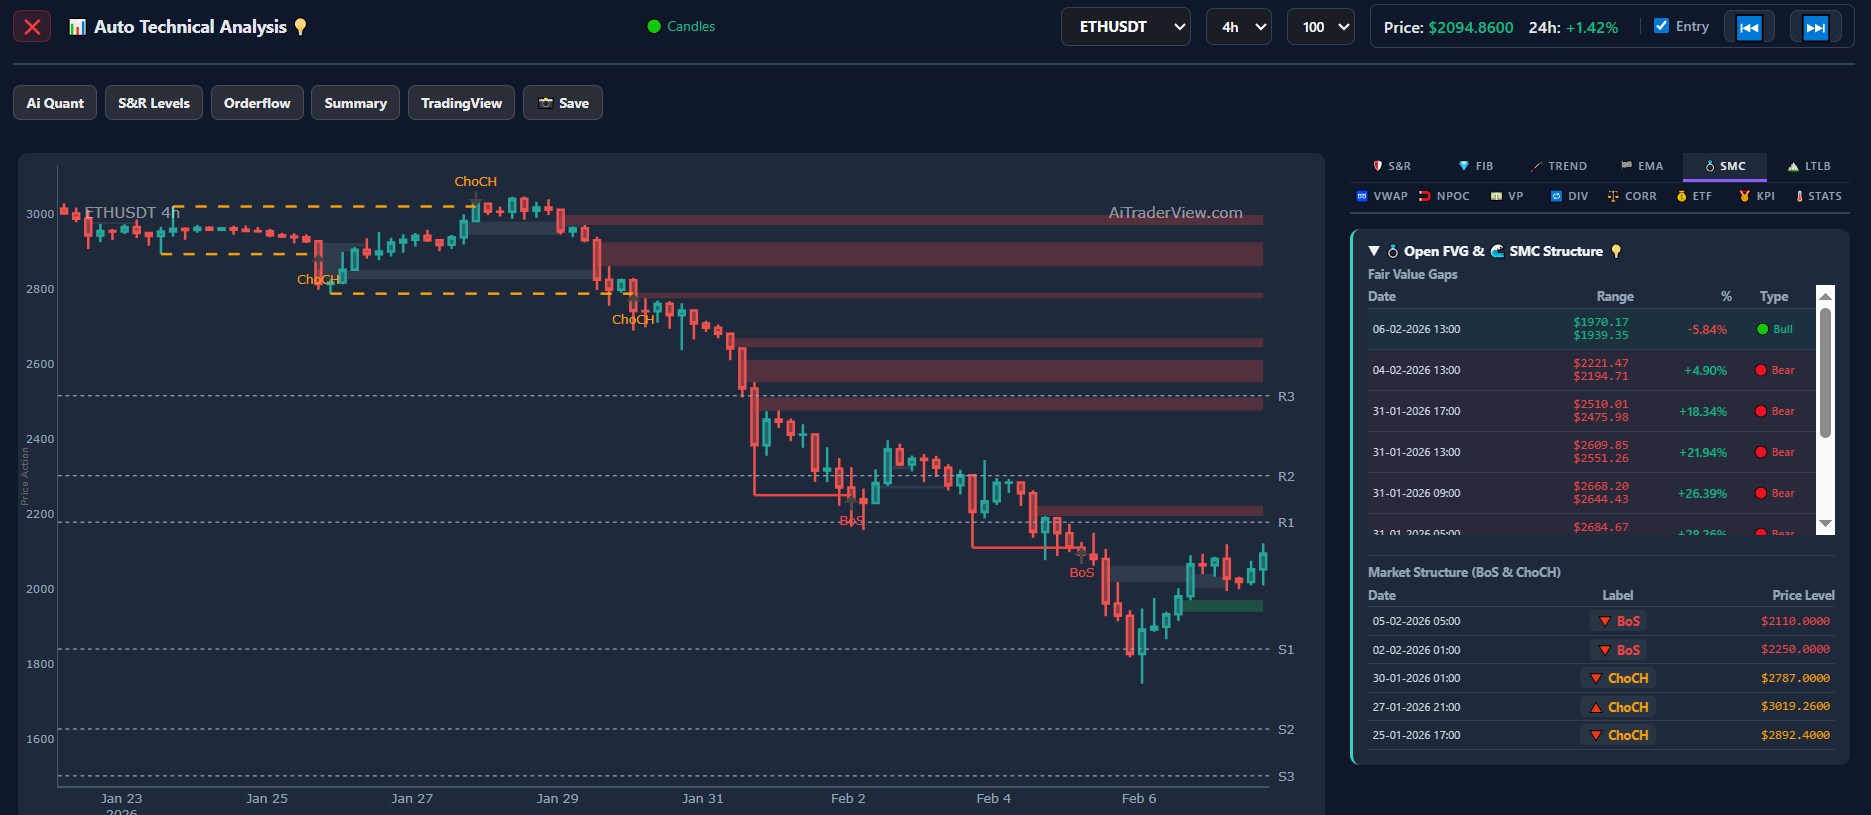
What AiTraderView adds: This layer reveals institutional footprints: Fair Value Gaps (FVG), Breaks of Structure (BoS), and Change of Character (ChoCH).
- The New Insight: We see a “BoS” to the downside, validating the bearish bias. More importantly, there are massive Bearish Fair Value Gaps (Red Zones) above current price.
- The Context: These gaps often act as magnets. Price tends to move up to “fill” these inefficiencies before continuing down. Without this, you wouldn’t see where the “smart money” has left pending liquidity that needs to be rebalanced.
7. Multi-Timeframe VWAP (Image 7)
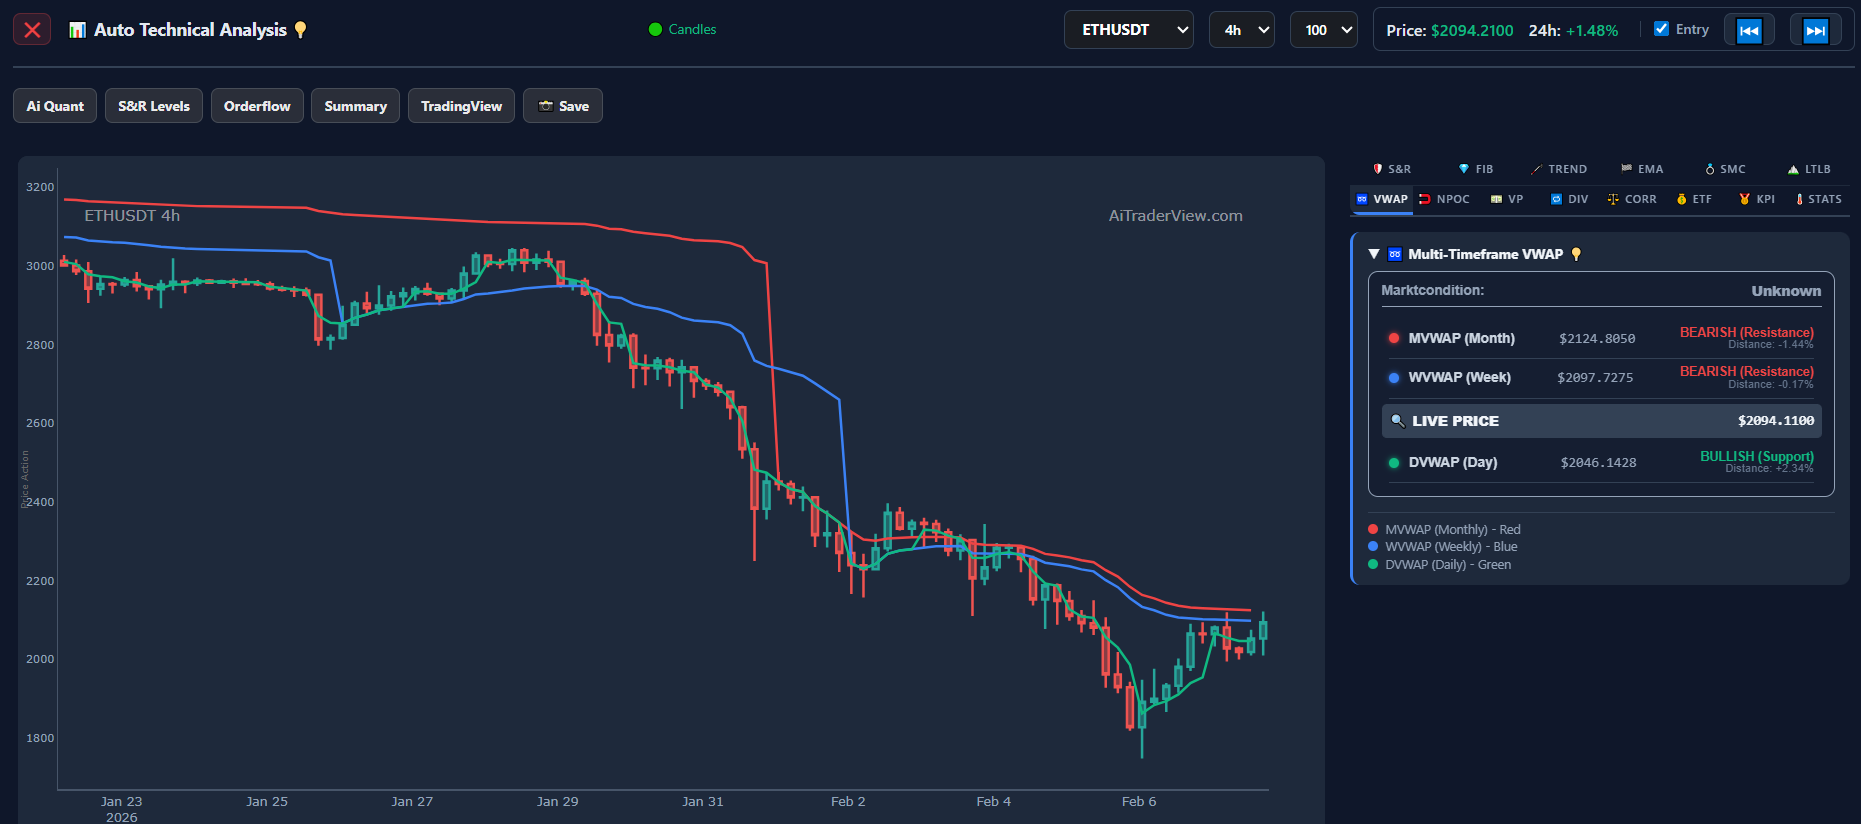
What AiTraderView adds: The Volume Weighted Average Price (VWAP) shows the “fair value” across different timeframes.
- The New Insight: A divergence is visible. The Daily VWAP (Green) is at $2,046, providing short-term support. However, the Weekly (Blue) and Monthly (Red) VWAPs are trending downwards above the price.
- The Context: This creates a sandwich effect. Day traders are supporting the price, but higher timeframe participants are effectively “underwater.” This layer helps identify the conflict between short-term bulls and long-term bears.
8. Naked Point of Control (NPOC) (Image 8)
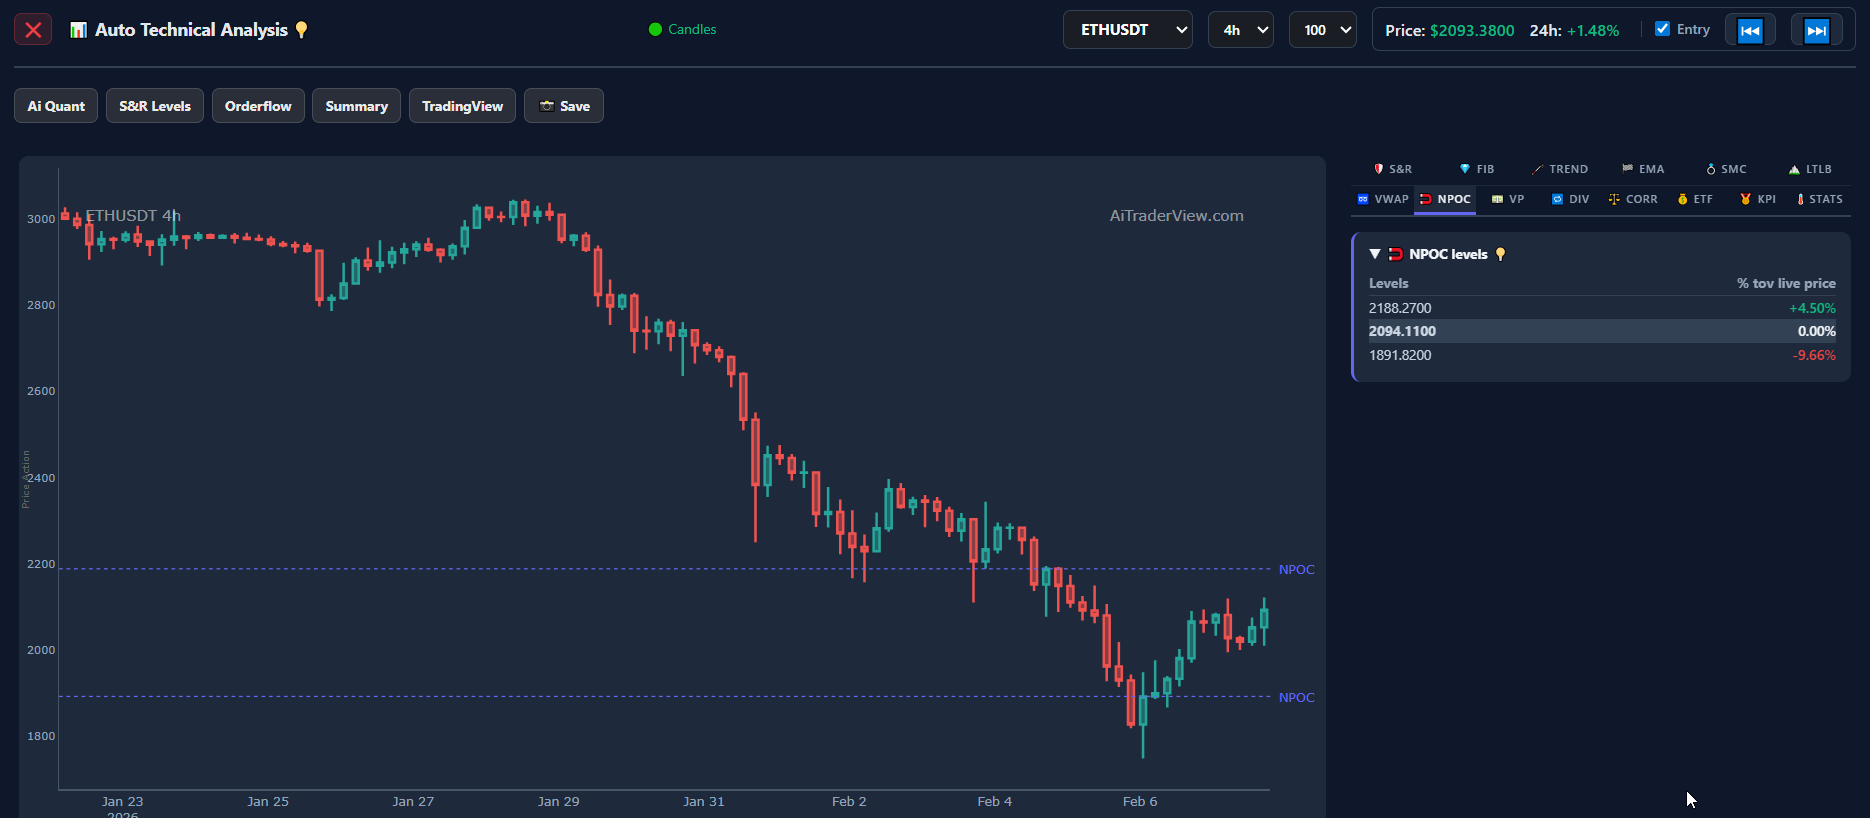
What AiTraderView adds: NPOCs are historical price levels with the highest volume that have not been re-tested.
- The New Insight: The software highlights a critical volume node exactly at $2,094, which is precisely where the price is currently stalling.
- The Context: Markets rarely move in a straight line; they gravitate toward volume. Without this chart, the current consolidation looks confusing. With it, we understand the market is simply returning to equilibrium at a high-volume node before choosing a direction.
9. Orderflow Analysis – 4 Hour (Image 9)
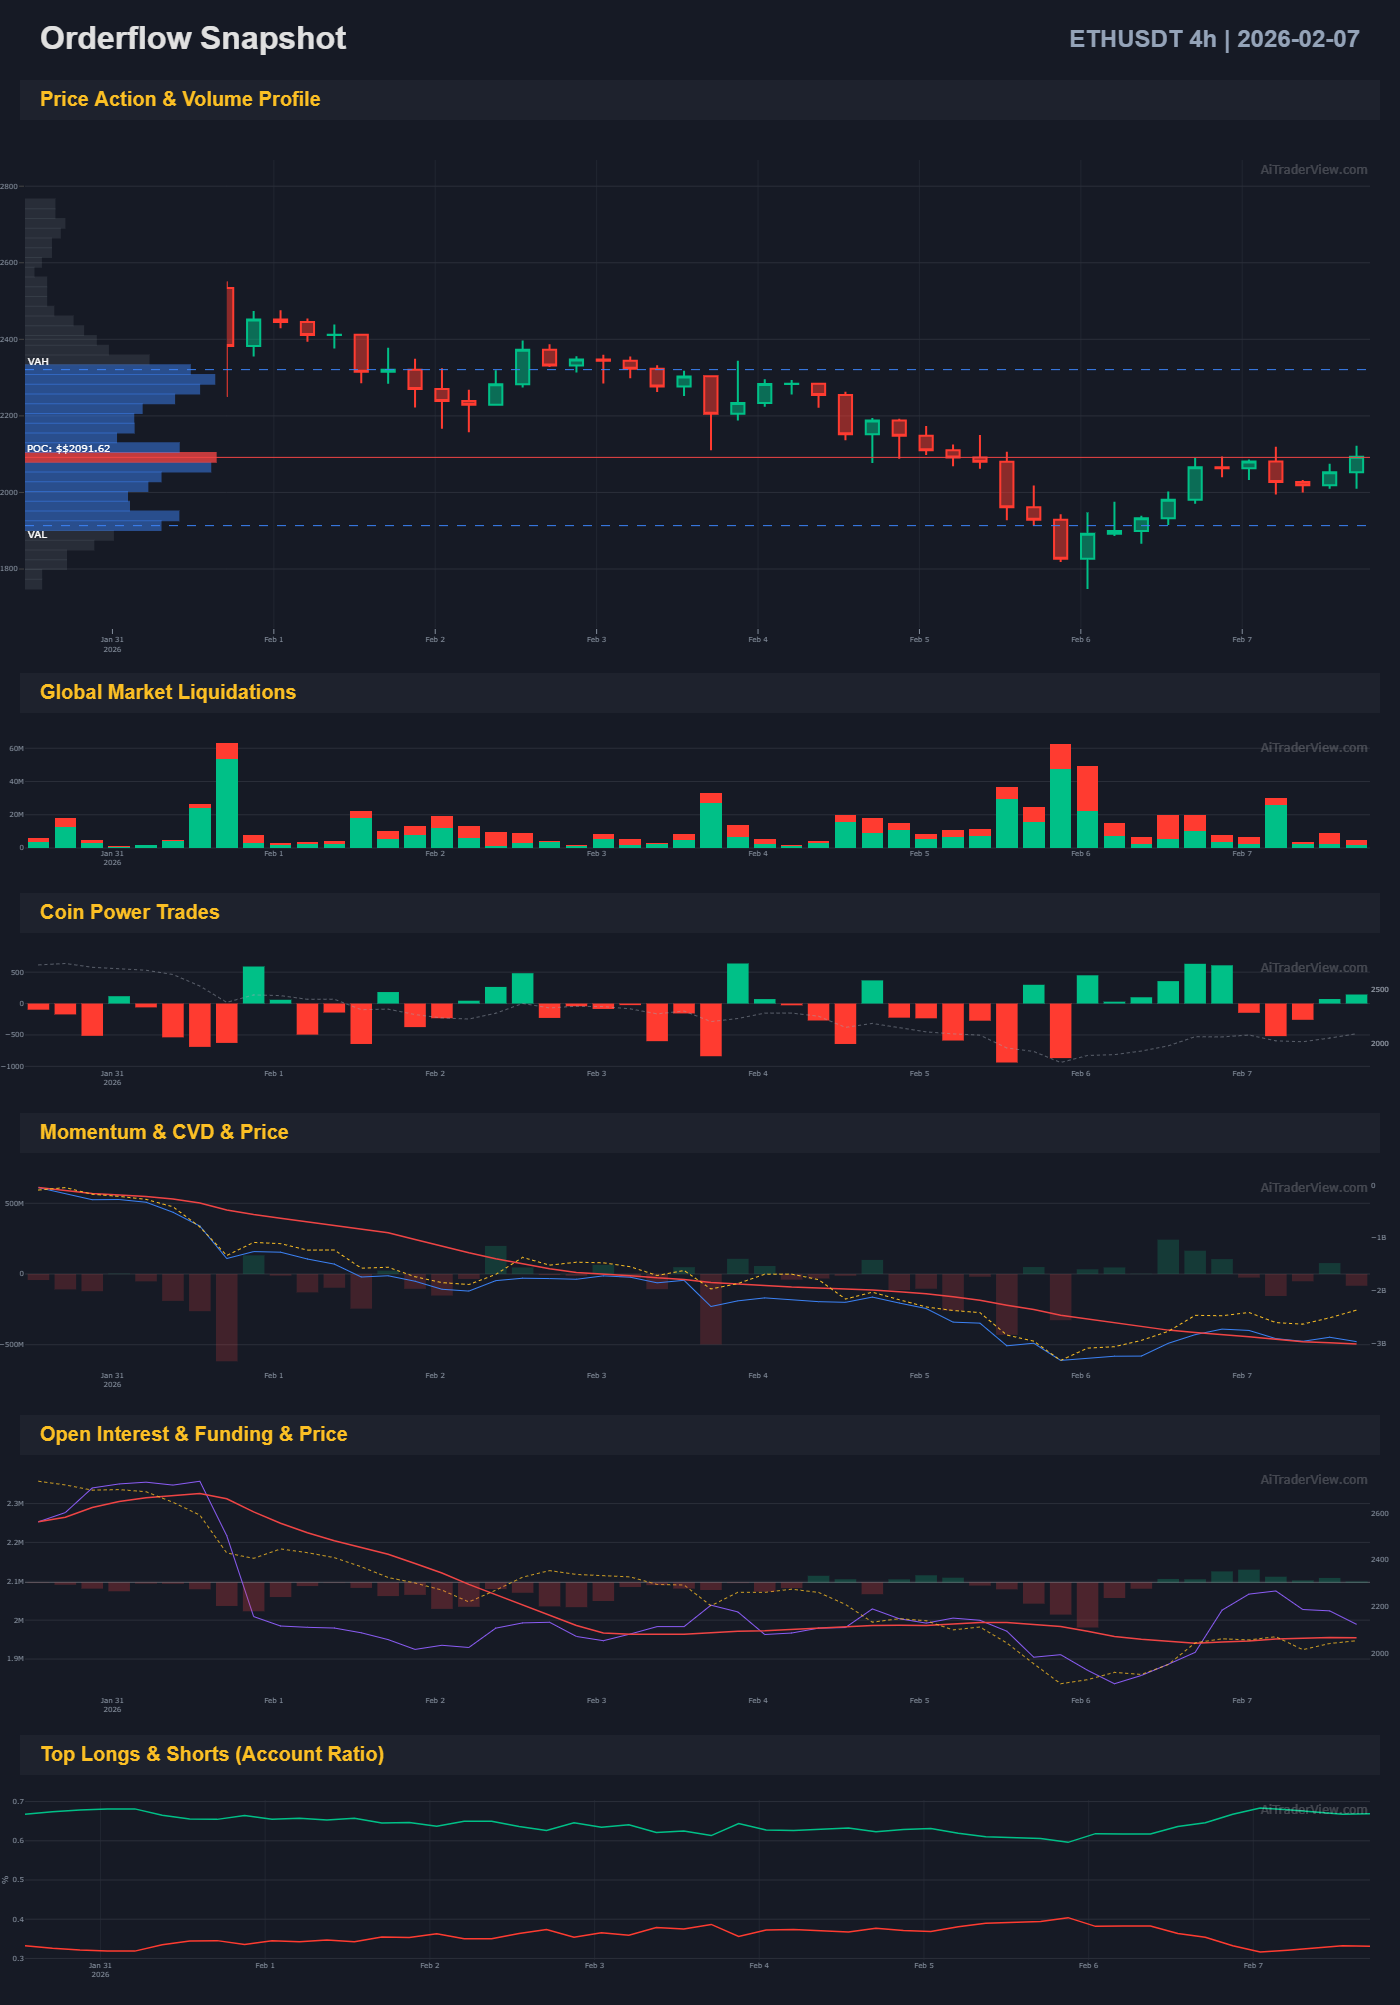
What AiTraderView adds: Now we look “under the hood” at the aggressive buying and selling data.
- Global Market Liquidations: The chart reveals massive Long Liquidations (Red bars) during the drop. This “flush” often marks a local bottom as over-leveraged long positions are wiped out, transferring supply to stronger hands.
- Coin Power Trades: We can see distinct clusters of large automated trades. The presence of buy-side power trades at the bottom wick suggests absorption by whales.
- Open Interest (OI) & Funding: The Open Interest panel shows a significant drop. This indicates that leverage has left the system, making the market lighter and less prone to manipulation.
- The Context: Without this Orderflow data, you are blind to the intent of the market. We now know the bounce is fueled by a lack of sellers (exhaustion) and a reset in leverage, rather than just random noise.
10. Macro Orderflow – 1 Day (Image 10)
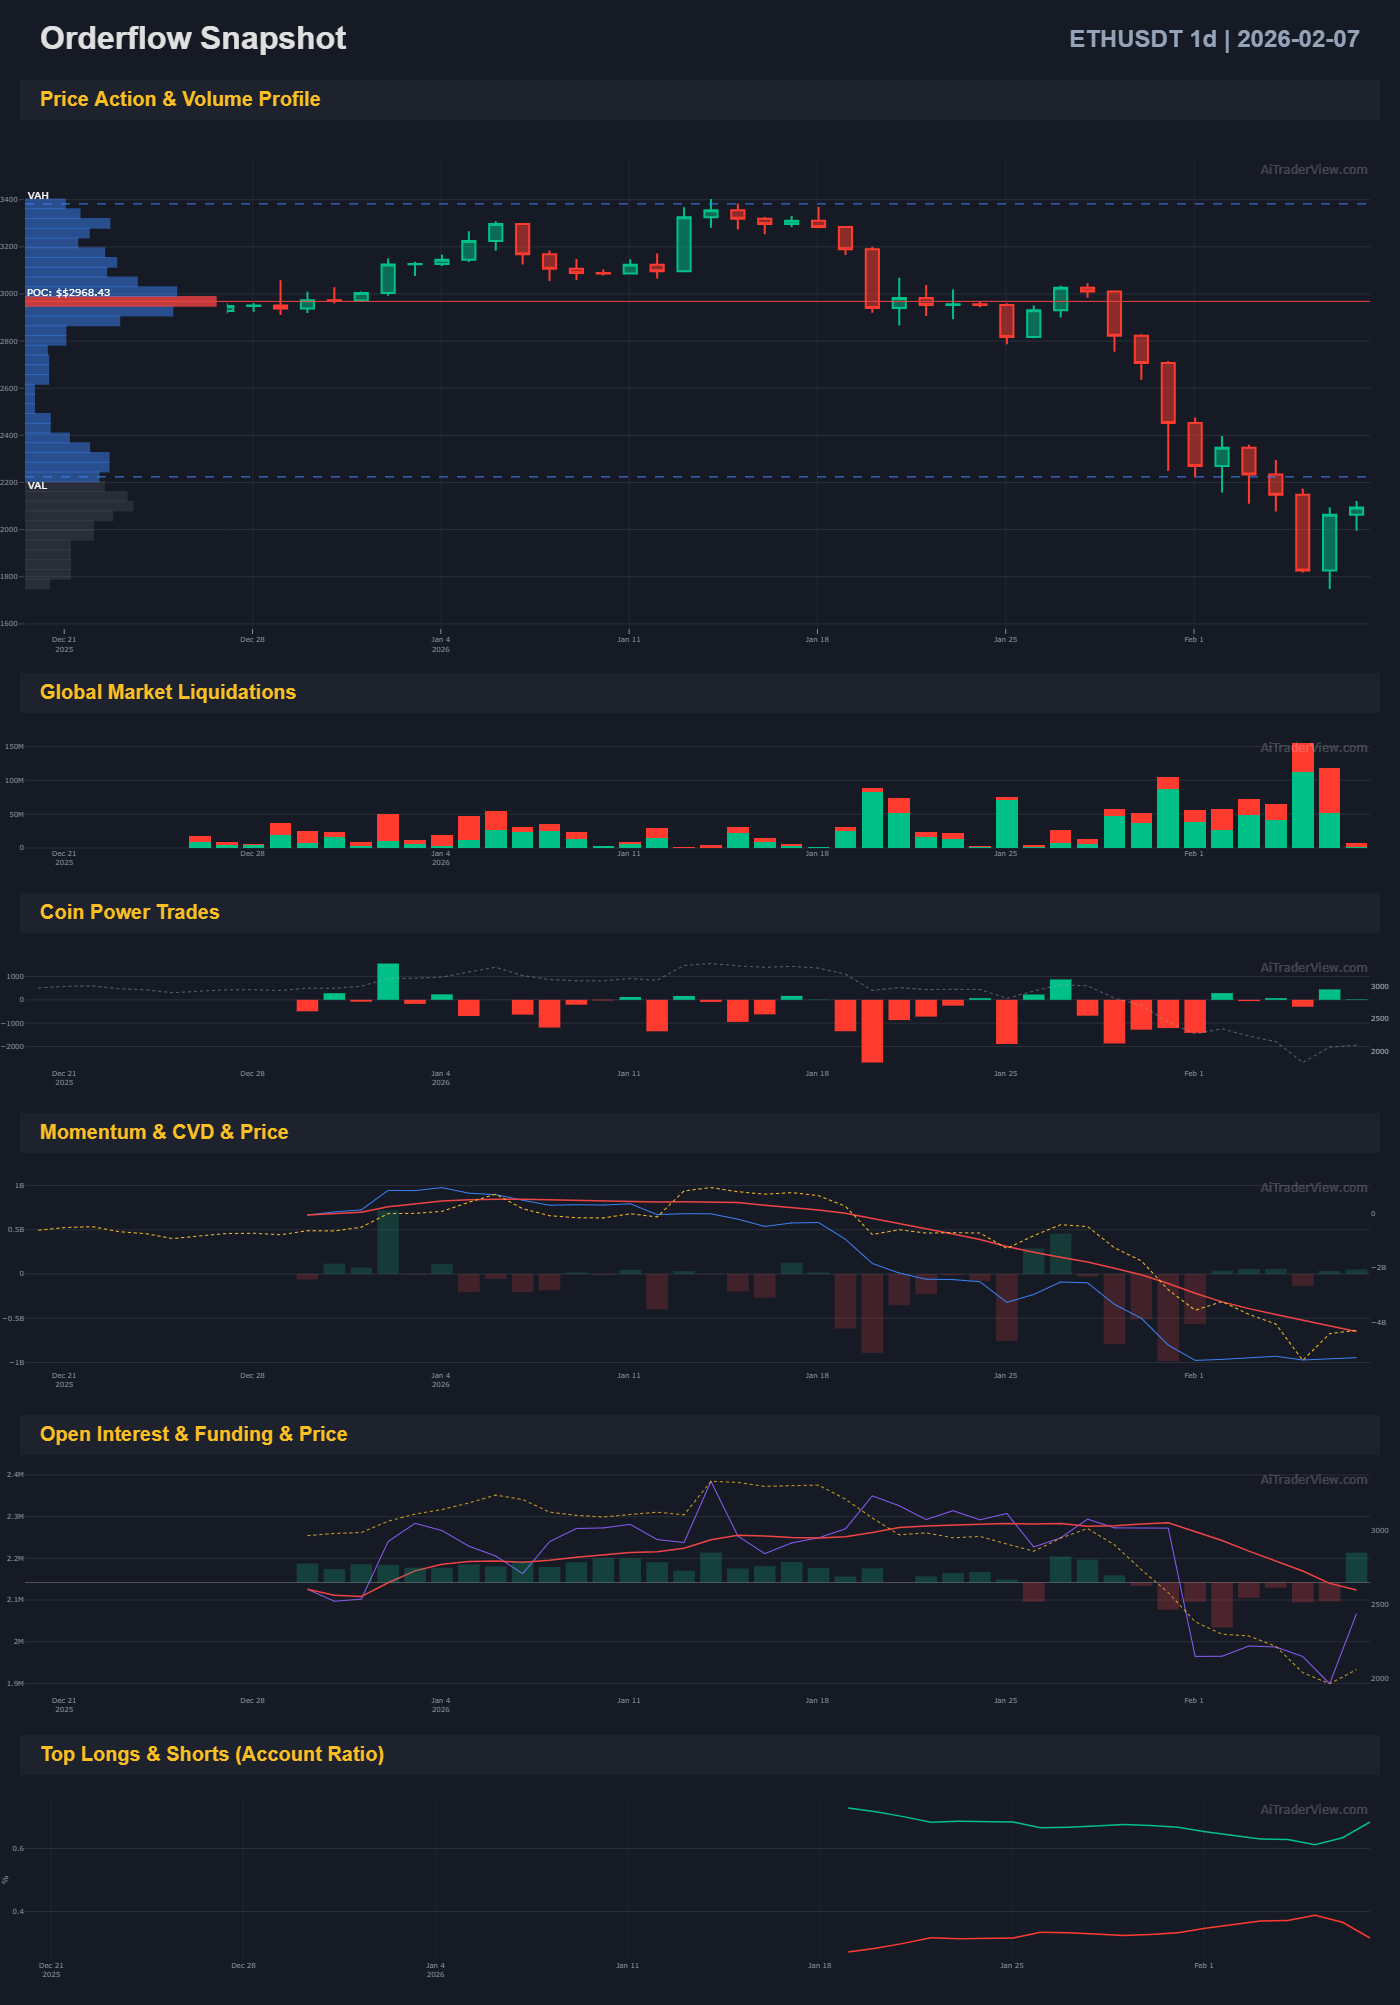
What AiTraderView adds: Finally, the daily Orderflow provides the macro sentiment.
- Volume Profile: The Value Area (VA) shows the bulk of trading occurred much higher (POC at $2,968). We are currently trading below the Value Area Low (VAL).
- Momentum & CVD: The Cumulative Volume Delta (CVD) shows that while price is dropping, the selling aggression is starting to flatten.
- Account Ratio (Longs vs Shorts): The bottom panel helps us analyze sentiment. If the Long/Short ratio climbs too high while price drops, it suggests retail traders are fighting the trend (usually bearish).
- The Context: This is the ultimate confirmation layer. It tells us that while the immediate “panic” selling has subsided (shown by the liquidation flush), the market has not yet accepted price back into the previous value range.
11. Squeeze Radar (Image 11)
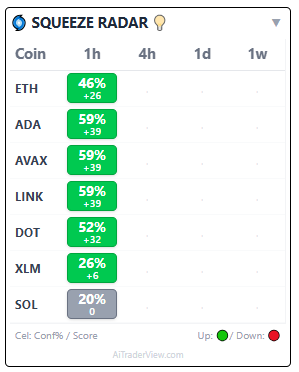
The Insight: The Squeeze Radar detects periods of low volatility that often precede a violent move. The Value: ETH is flashing a Green (46%) signal on the 1-hour timeframe. This indicates that short-term energy is building up for a potential breakout, and the green color suggests the immediate momentum is leaning bullish.
12. Japanese Candlesticks (Image 12)
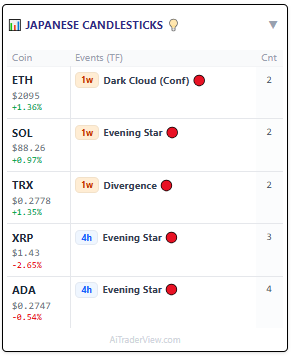
The Insight: The AI scanner identifies specific candle patterns across timeframes. The Value: While the short-term looks steady, the Weekly timeframe (1w) is flashing a “Dark Cloud Cover (Conf)” pattern. This is a classic bearish reversal signal. It serves as a warning: do not mistake the 4-hour relief bounce for a Weekly trend reversal yet.
13. EMA & Mean Reversion Oscillators (Image 13)
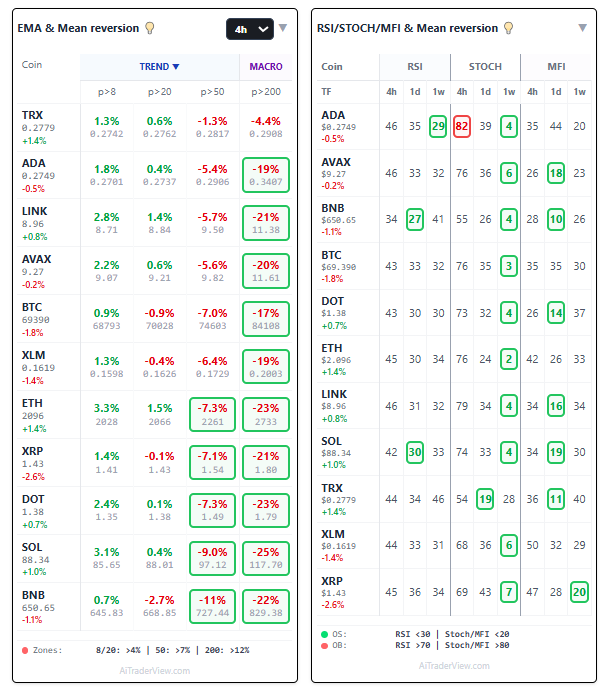
The Insight: This statistical dashboard quantifies how “stretched” the price is. The Value:
- EMA Reversion: ETH is trading 23% below its 200 EMA. Historically, such wide gaps tend to close (mean reversion).
- Oscillators: The Weekly Stochastic is at a reading of 2 (scale 0-100) and Weekly MFI is at 4. These are extremely rare “green box” oversold conditions, suggesting a potential macro bottom could be forming purely on statistical probability.
14. ETH ETF Dashboard (Image 14)
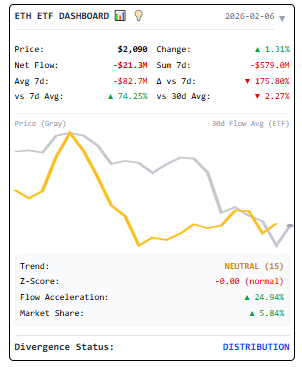
The Insight: Finally, we look at the fundamental flow of funds via ETFs. The Value: The dashboard shows a Net Flow of -$21.3M, indicating institutional distribution (selling). However, the “vs 7d Avg” is up +74.25%, which implies that while selling continues, the intensity of the selling pressure might be decreasing compared to the previous week.
Final Conclusion (Technical Analysis Only — Not Financial Advice)
Based on the combined technical signals across all the analytical layers, the current market movement aligns more closely with a statistical mean‑reversion bounce than with a confirmed trend reversal. This interpretation is derived from observable market structure, orderflow behavior, and institutional activity, without making predictions about future price direction.
Macro Trend Context
The broader market structure remains downward‑sloping. Price continues to trade below the macro Value Area Low and inside a descending channel. Higher‑timeframe indicators—such as the Weekly “Dark Cloud Cover” pattern and repeated rejections at the Weekly and Monthly VWAP—suggest that sellers still maintain structural control. Negative ETF net flows (‑$21.3M) indicate ongoing institutional outflows, which historically limit sustained upside momentum.
Why a Bounce Occurred
The recent upward movement appears driven by mechanical and statistical factors rather than a shift in long‑term trend. Price was trading significantly below the 200 EMA, and multiple oscillators (Weekly Stochastics at 2, MFI at 4) reached extreme levels associated with seller exhaustion. The 1‑hour Squeeze Radar (46% green) reflects short‑term volatility expansion following this oversold condition.
Large clusters of long liquidations created a “flush,” clearing excessive leverage. Power Trades at the wick lows show passive absorption by larger market participants, which often stabilizes price temporarily.
Orderflow Signals: Bounce, Not Breakout
While price has rebounded, the Cumulative Volume Delta (CVD) has not confirmed strong spot‑buying pressure. This divergence suggests the move is driven more by a reduction in selling than by aggressive accumulation. Open Interest remains depressed, which is typical after a liquidation event but not typical of a V‑shaped recovery where new positions rapidly re‑enter the market.
Key Technical Levels
The market found short‑term balance around the $2,094 NPOC. From here, the next structural signals depend on how price interacts with the following areas:
- Potential bullish continuation: Holding the 23.6% Fibonacci level ($1,988) and breaking above the Daily VWAP ($2,046) would open the path toward higher inefficiencies such as bearish Fair Value Gaps.
- Potential bearish continuation: Losing the EMA 20 or being rejected at trendline resistance, the EMA 200, or the 38.2% Fibonacci retracement would align with the prevailing macro downtrend.
These are technical reference points, not predictions or recommendations.
Overall Assessment
The current movement reflects a volatility‑driven relief rally within a still‑intact macro downtrend. Until price reclaims major value levels and orderflow metrics (such as CVD) turn decisively positive, the structure remains consistent with a temporary bounce rather than a confirmed V‑shape recovery.
This analysis is strictly informational and based on observable technical data. It does not constitute investment advice or a recommendation to buy or sell any asset.
⚠️ RISK WARNING & AI DISCLOSURE
- This information is generated by Artificial Intelligence (AI) and complex algorithms. While advanced, these systems can contain errors or inaccuracies and are for educational purposes only.
- Technical analysis provides no guarantees; this information is purely informative.
- All discussed scenarios are hypothetical and do not constitute predictions or expectations.
- Past performance is not an indicator of future results.
- This is not financial advice and is not intended as a call-to-action for the reader.
- No implicit direction is claimed, and no specific behavior of market participants is suggested.