
After a tumultuous week that saw Ethereum (ETH) plummet to levels not seen in months, the second-largest cryptocurrency by market capitalization is staging a dramatic comeback. As of Saturday morning, February 7, ETH/USDT is printing a textbook “V-Shape Recovery” on intraday timeframes, bouncing aggressively from a swing low near $1,760.
While the immediate panic seems to have subsided, Orderflow data and institutional market profiles suggest that the bulls are not out of the woods yet. A major liquidity barrier looms overhead, and the battle between short-term momentum and long-term structural weakness is just beginning.
Here is a comprehensive technical breakdown of Ethereum’s current market structure.
1. The Anatomy of the Flush: A “Leverage Wipeout”
To understand the current recovery, we must first analyze the crash. The sharp decline leading into this weekend was not merely spot selling; it was a liquidation cascade.
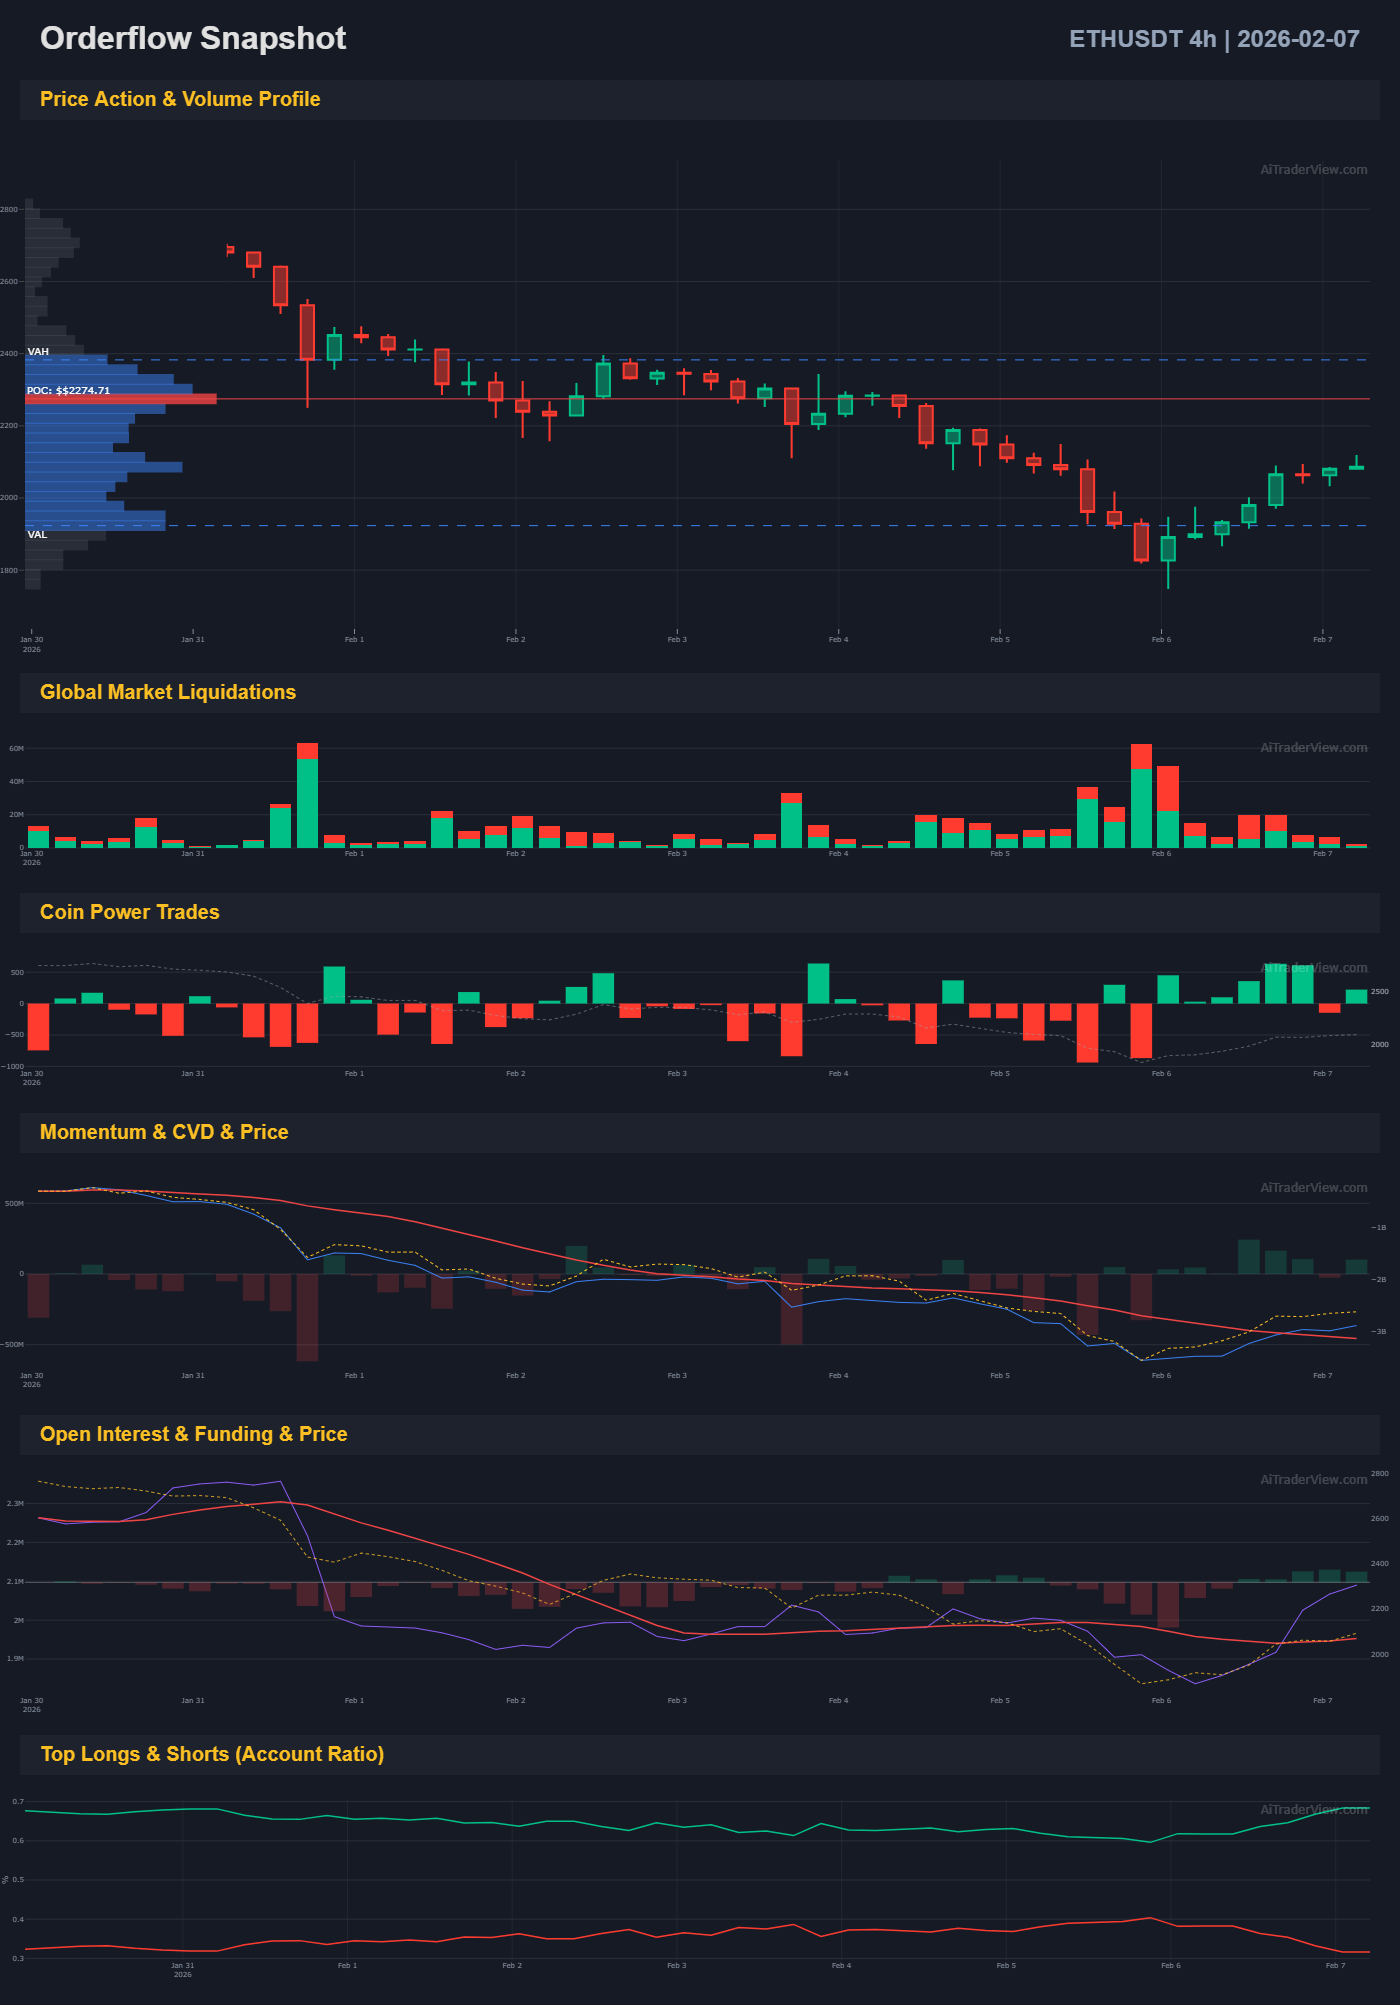
Looking at the Global Market Liquidations data (Chart 1), we can see massive spikes in both long and short liquidations over the last 48 hours. The magnitude of these red and green bars indicates a “capitulation event.”
- The Flush: Over-leveraged long positions were forcibly closed as the price dived under $2,000.
- The Reset: Coinciding with this price drop, Open Interest (OI) has seen a significant reset.
Why this matters: In crypto markets, a healthy recovery is difficult when Open Interest is at historic highs (too much leverage). The fact that OI has flushed out suggests the market is now “lighter” and cleaner. The weak hands have been shaken out, potentially paving the way for organic spot-driven accumulation.
2. Orderflow Analysis: The $2,274 Barrier
While price action (candles) tells us where price is, Orderflow tells us why it is there. The Volume Profile Visible Range (VPVR) on the 4-hour chart provides critical insight into where the “smart money” is positioned.
Currently, Ethereum is trading in a low-volume pocket, trying to re-enter the main value area.
- The POC (Point of Control): The most critical level on the chart is $2,274.71. This red line represents the price level where the highest volume of ETH has changed hands in recent weeks.
- The Implication: As long as ETH trades below $2,274, the bears statistically hold the advantage. This level acts as a magnet; price will likely be drawn toward it, but breaking above it will require significant buying pressure.
- The Value Area Low (VAL): ETH is currently fighting to reclaim the lower boundary of the value area. Acceptance back into this range is the first step toward targeting the POC.
3. Momentum Shift: The 1-Hour Chart
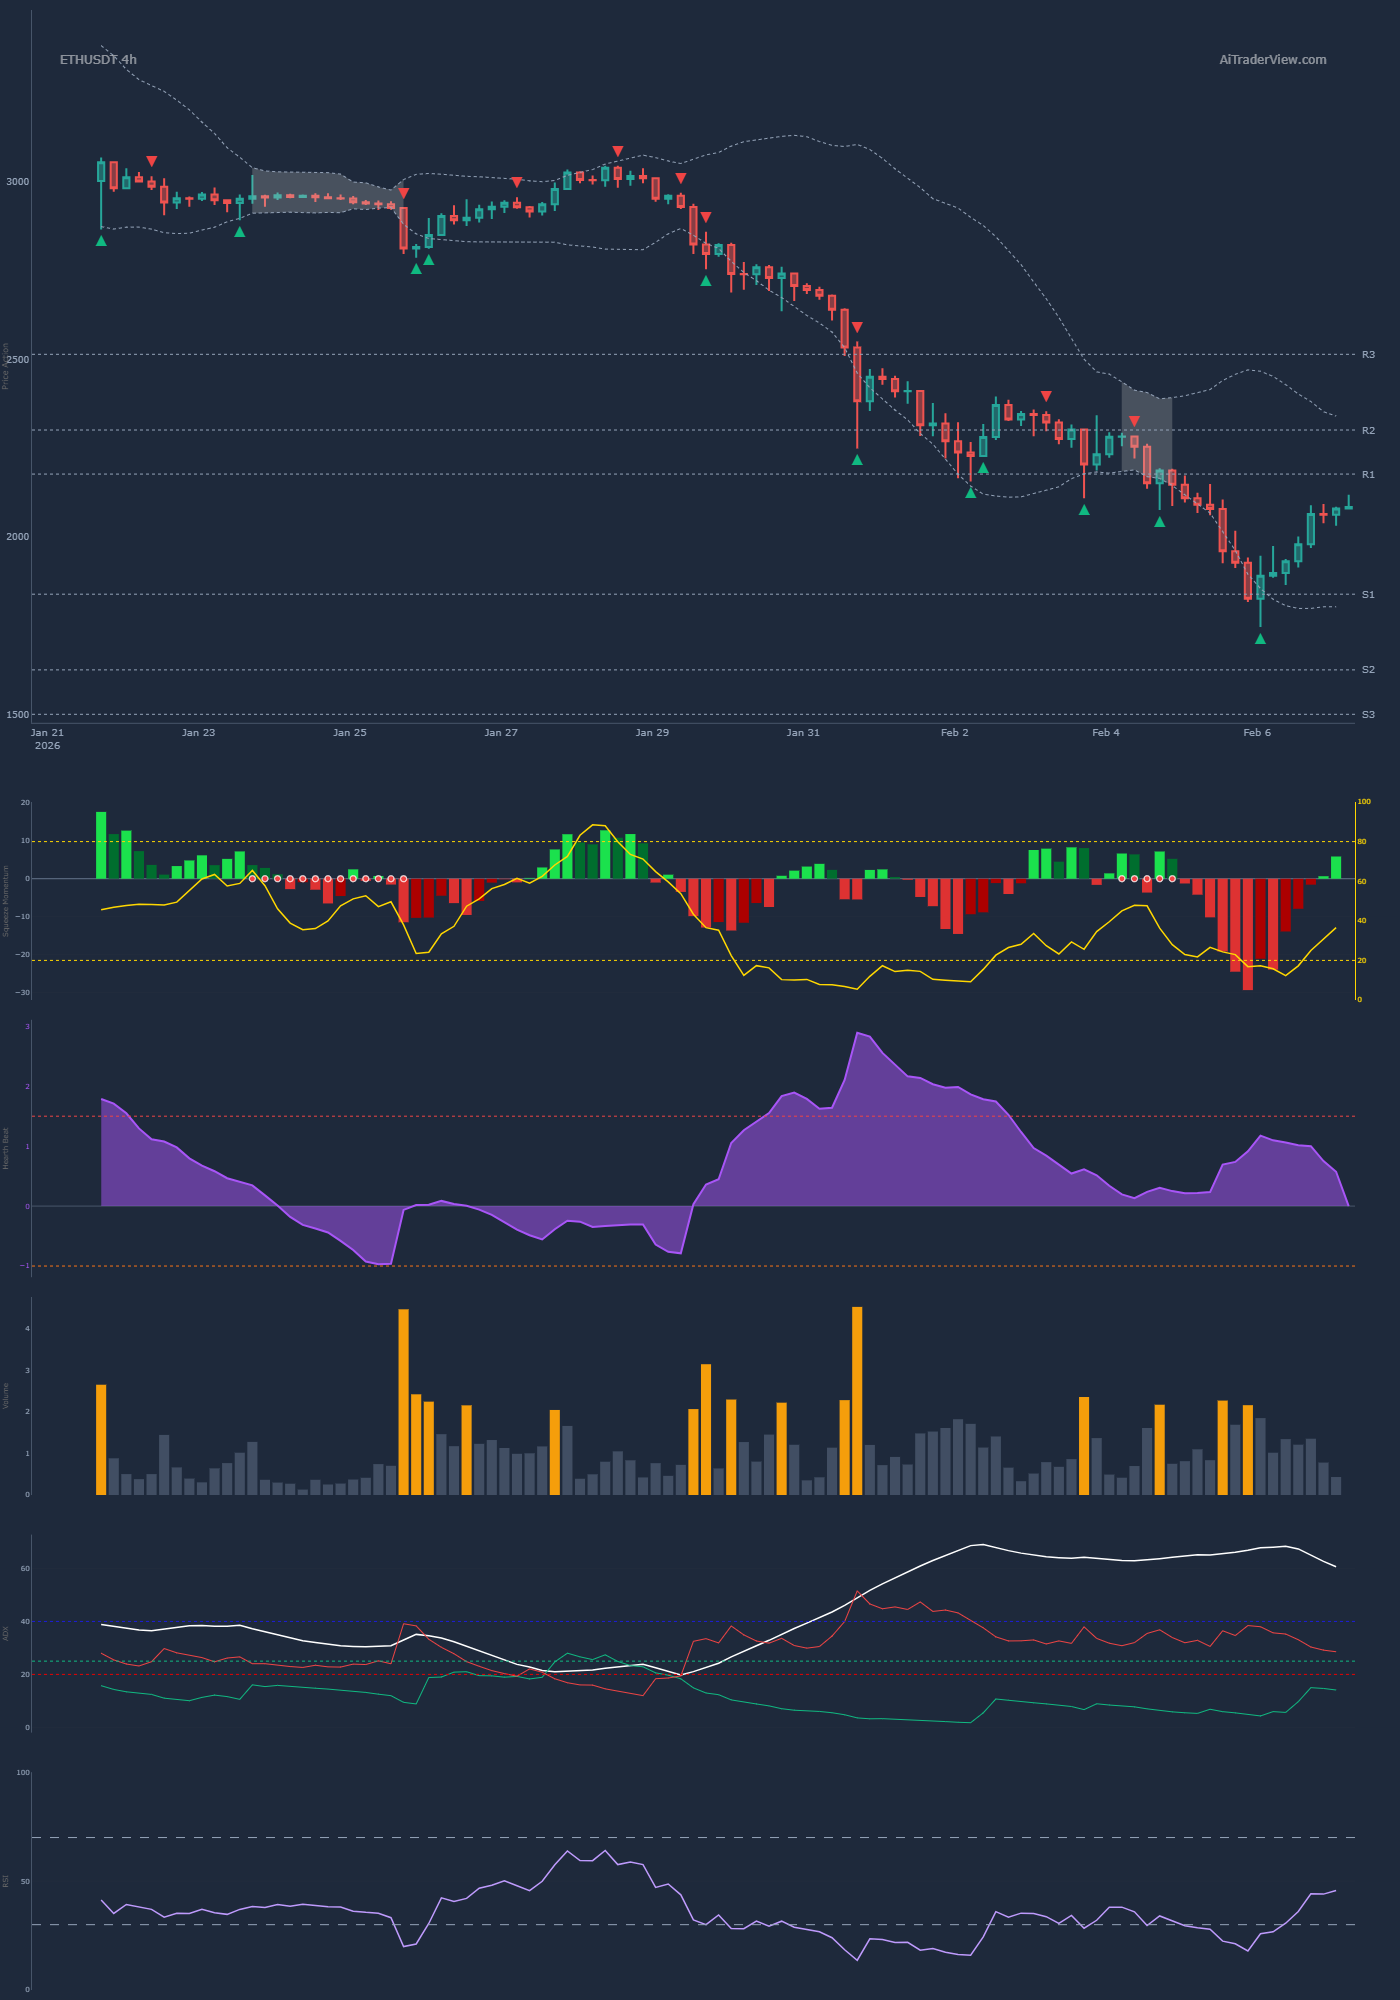
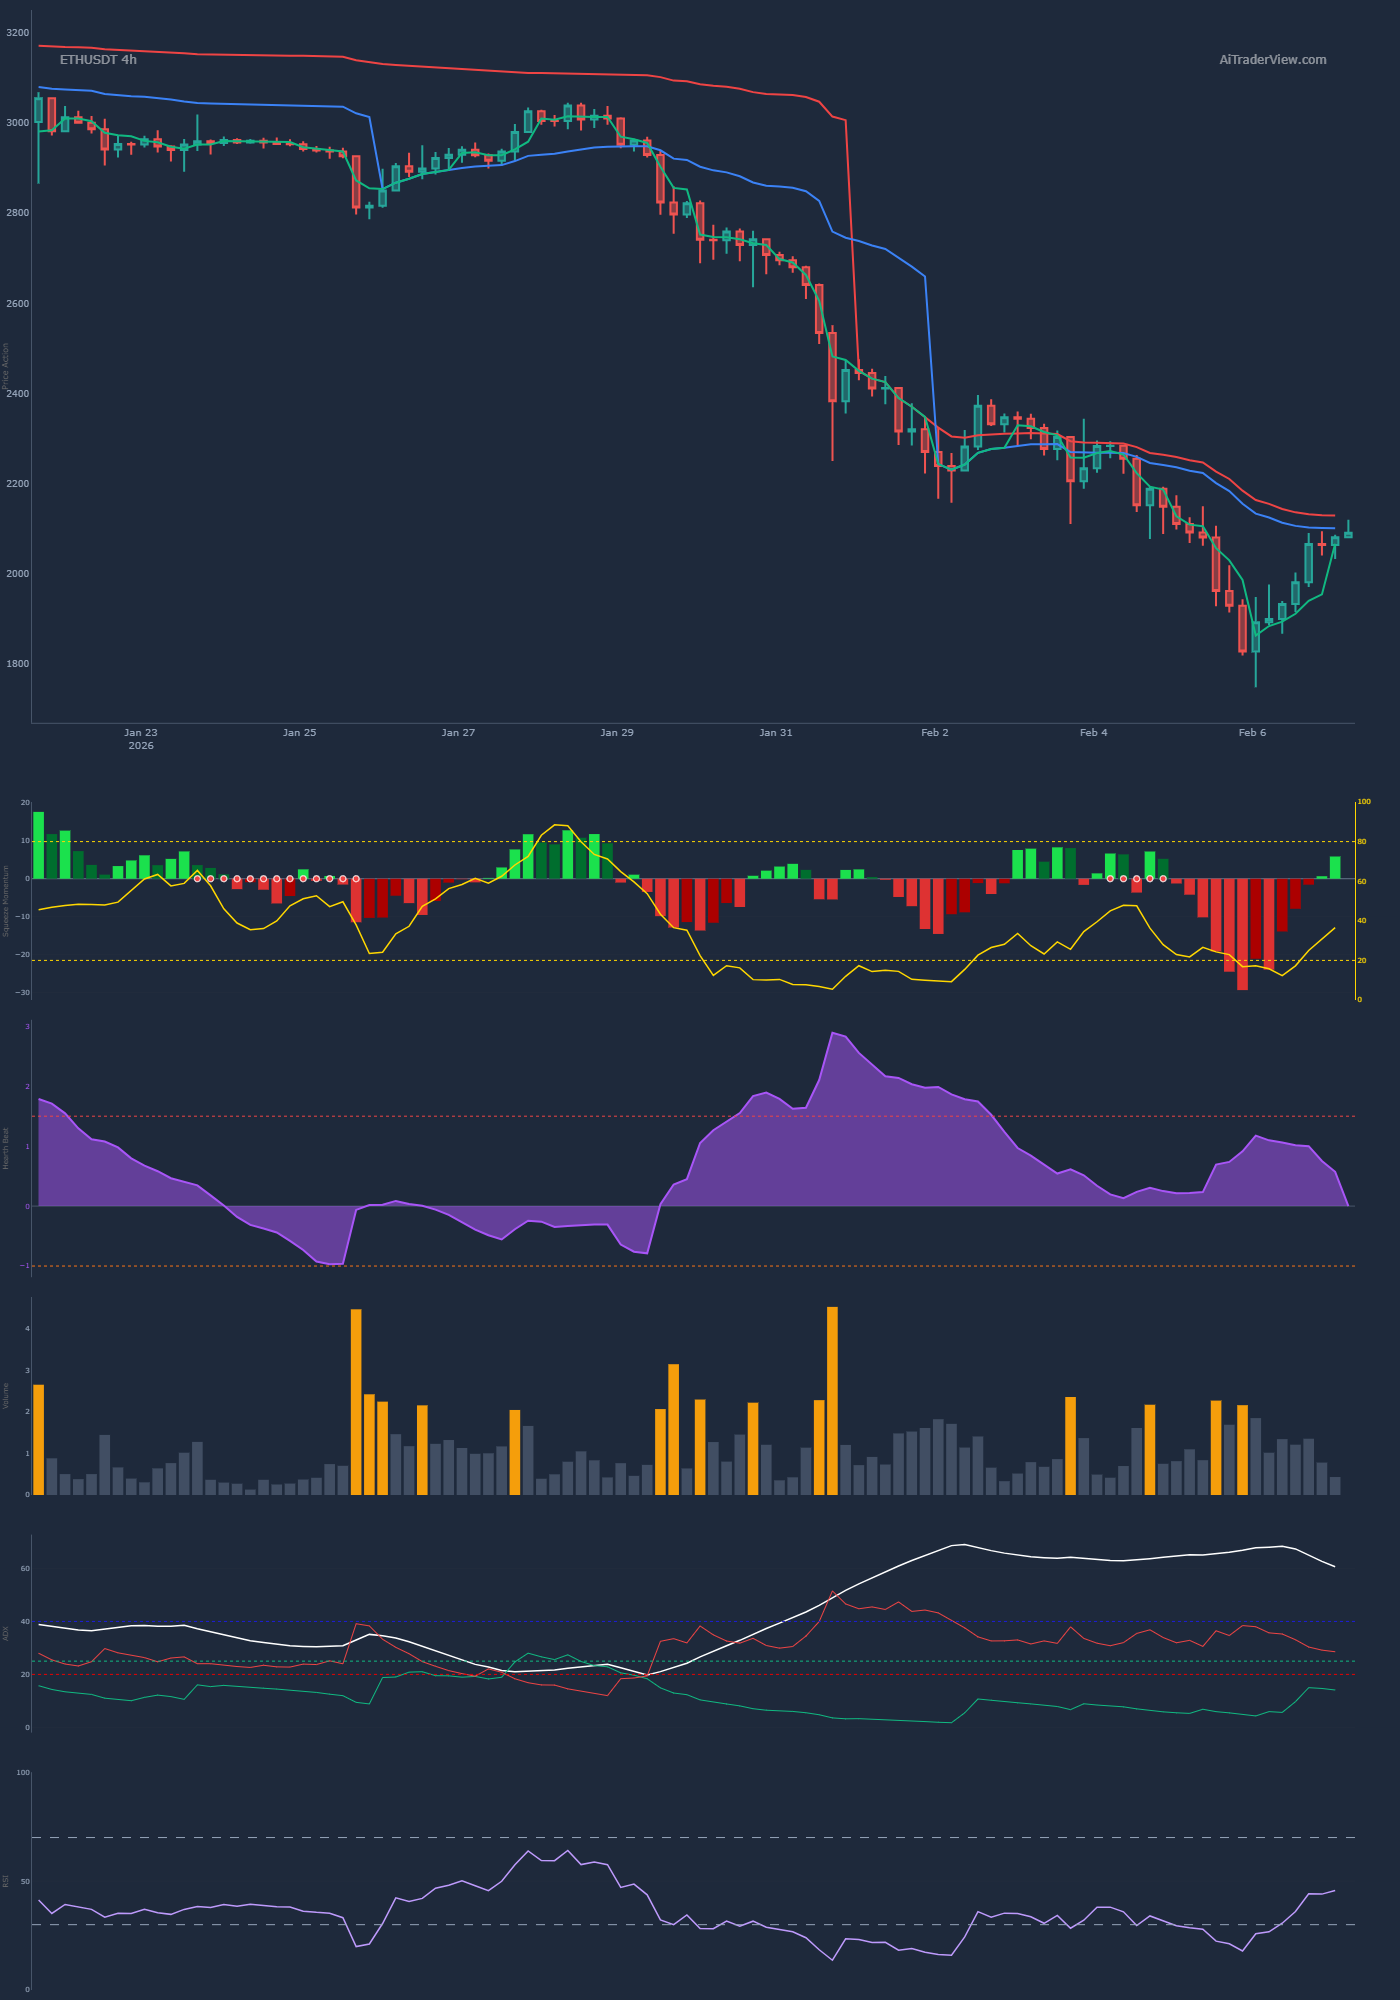
Zooming into the hourly charts (1H), the short-term trend has undeniably flipped bullish. The technical indicators are screaming “recovery.”
The Squeeze Release
The TTM Squeeze Momentum indicator (shown in the sub-panels) displays a transition from dark red (heavy selling pressure) to bright green histograms. This confirms that the bearish momentum has exhausted itself and buyers have stepped in with conviction.
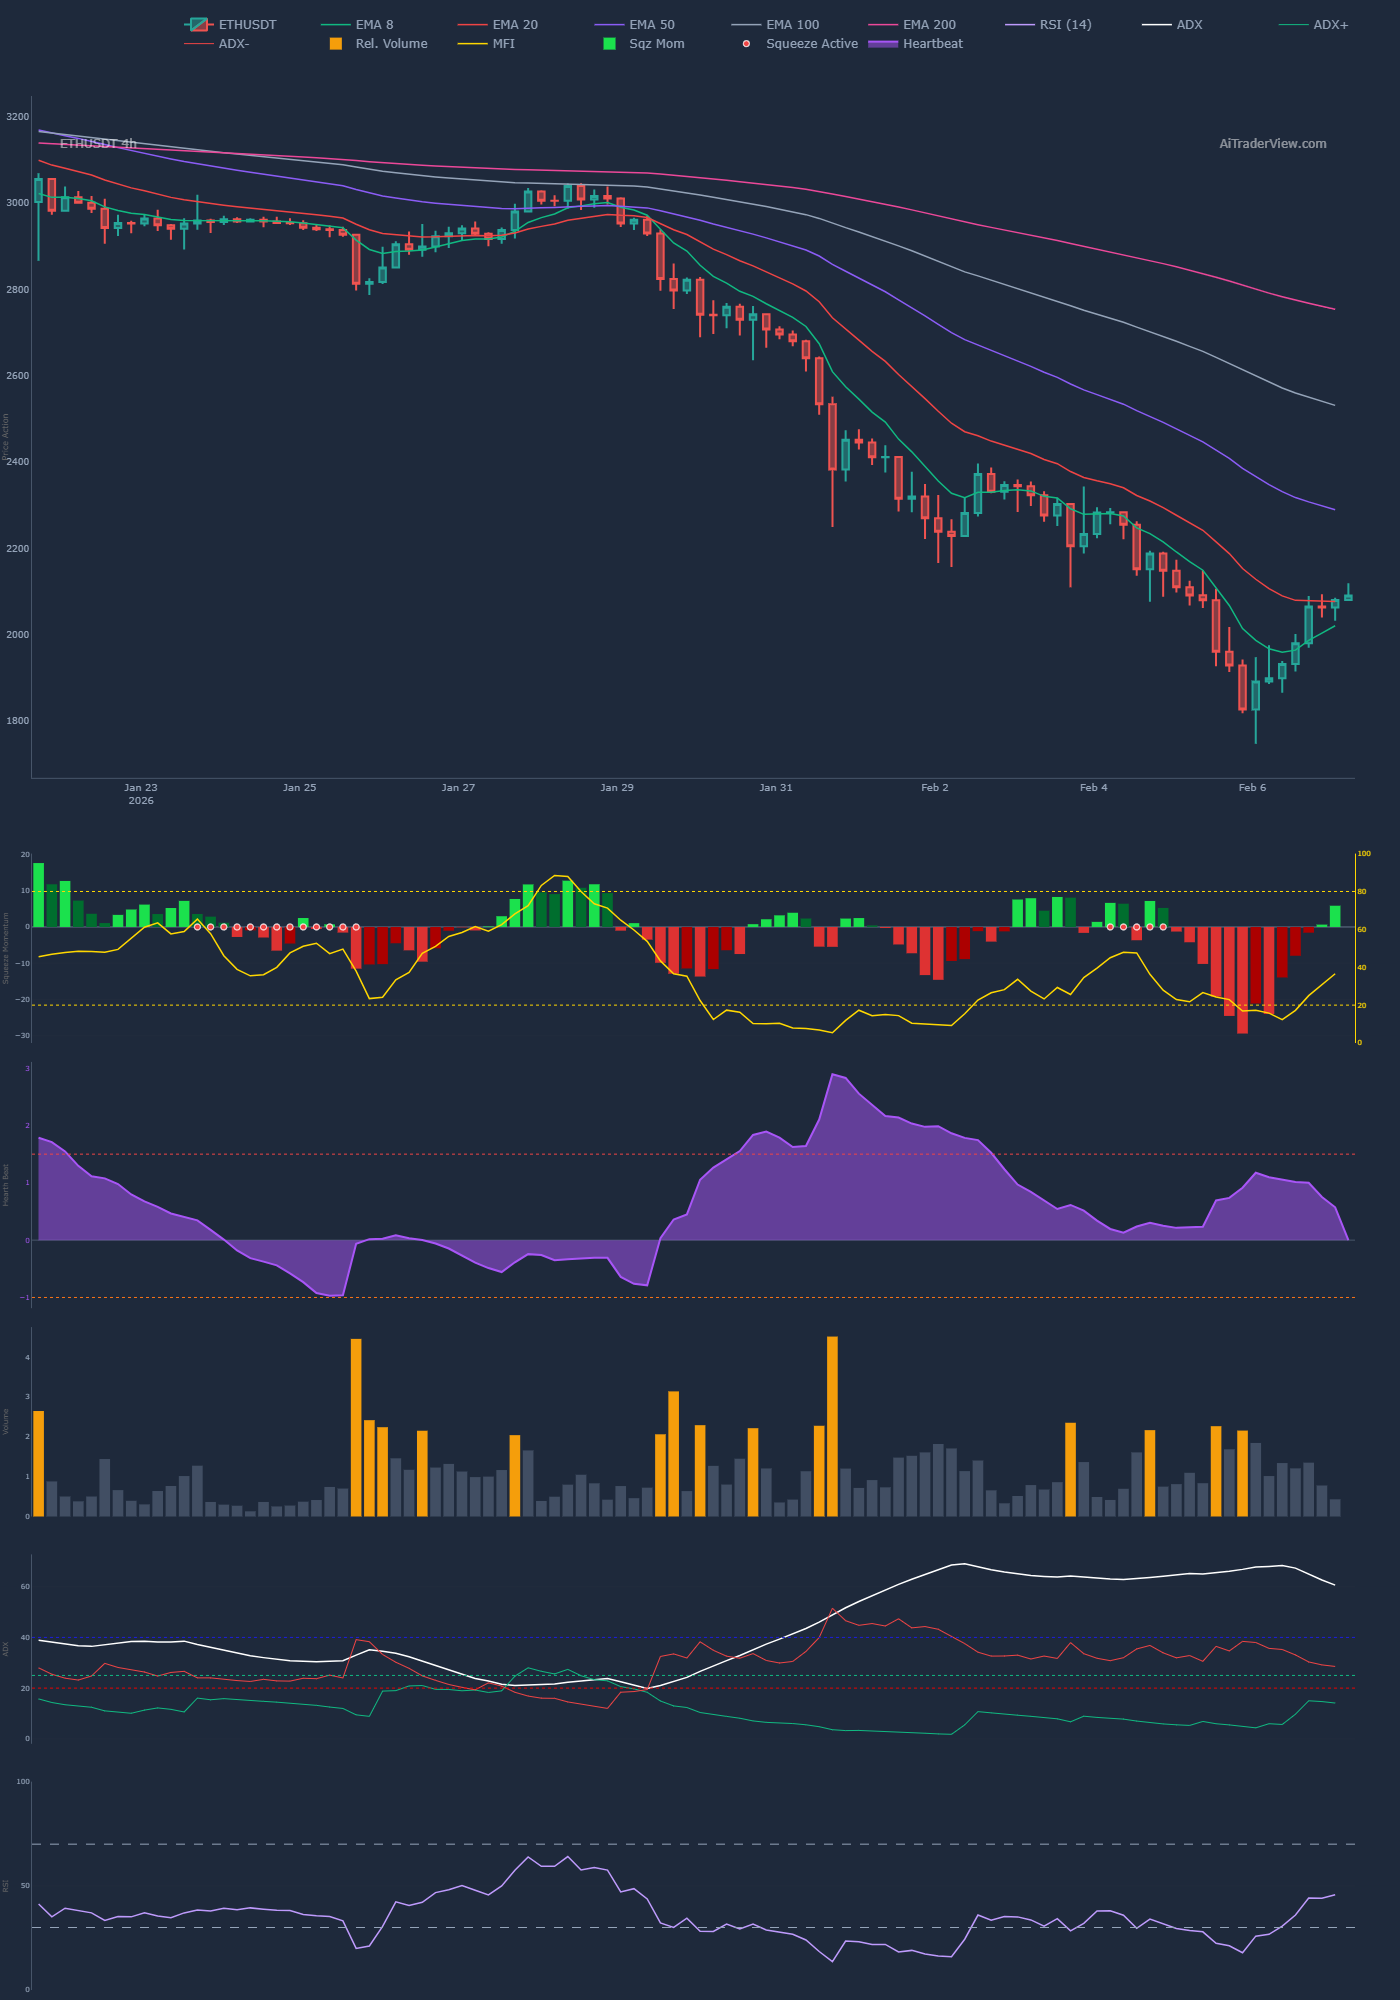
Moving Averages (EMA Ribbon)
Price action has successfully reclaimed the short-term Exponential Moving Averages (EMAs):
- EMA 8 & 20: Price is holding above these fast-moving averages, which are now beginning to slope upwards, providing dynamic support.
- EMA 50: The price is currently testing the 50-period EMA. A 4-hour candle close above this level is the confirmation traders are waiting for to target higher resistance zones.
RSI Reset
The Relative Strength Index (RSI) dipped into deep oversold territory during the crash (sub-30 levels). It has since rebounded sharply, currently hovering in neutral territory. This implies there is still room for upside before the indicator flashes “overbought” signals again.
4. The Macro Warning: Don’t Ignore the Weekly Trend
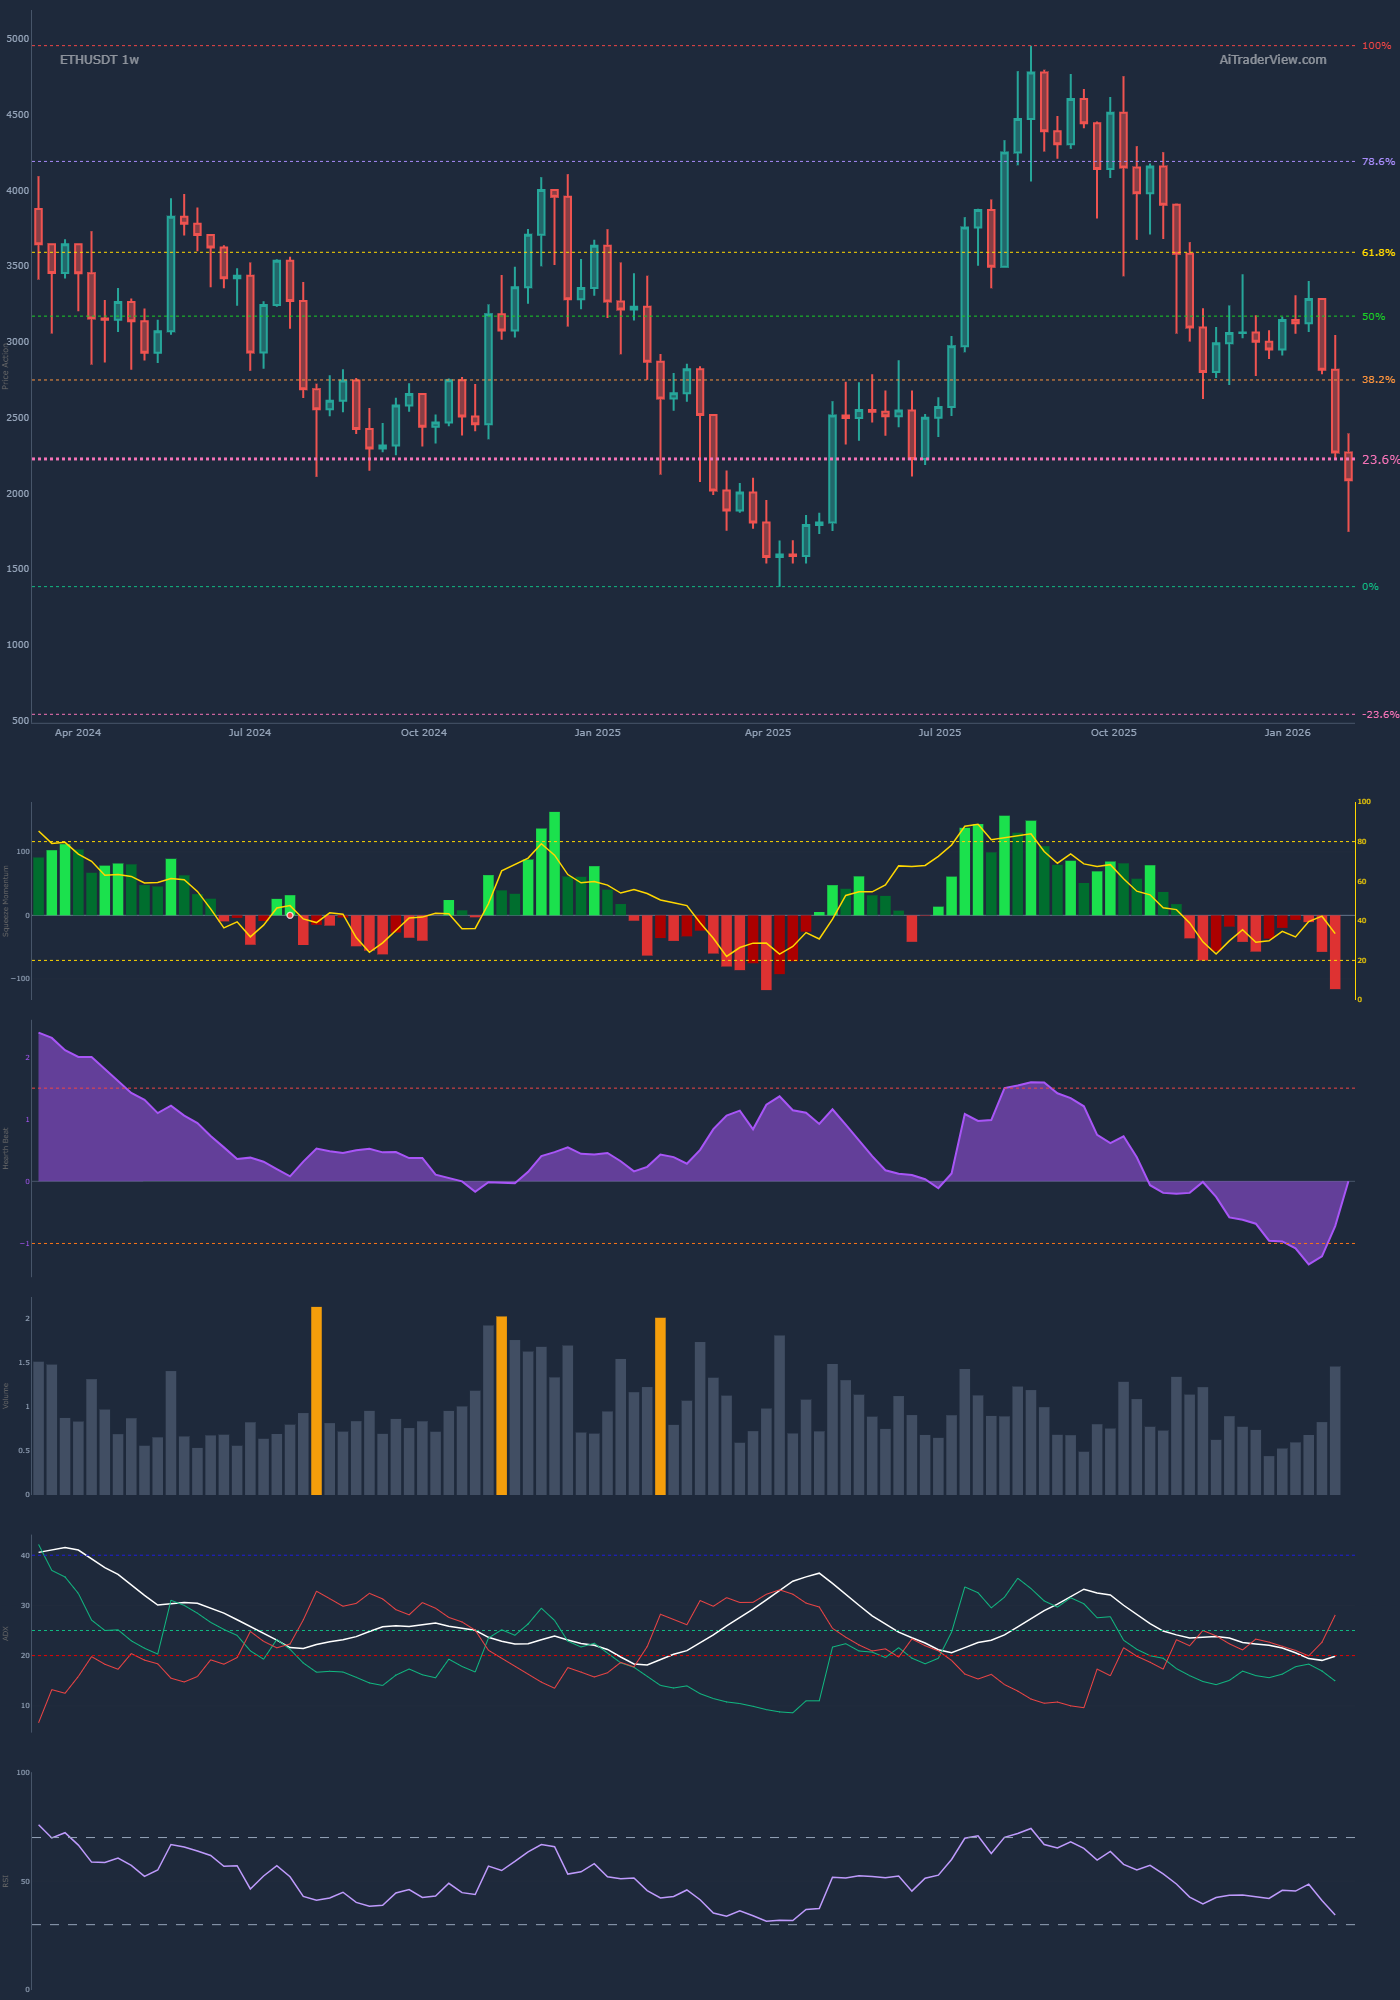
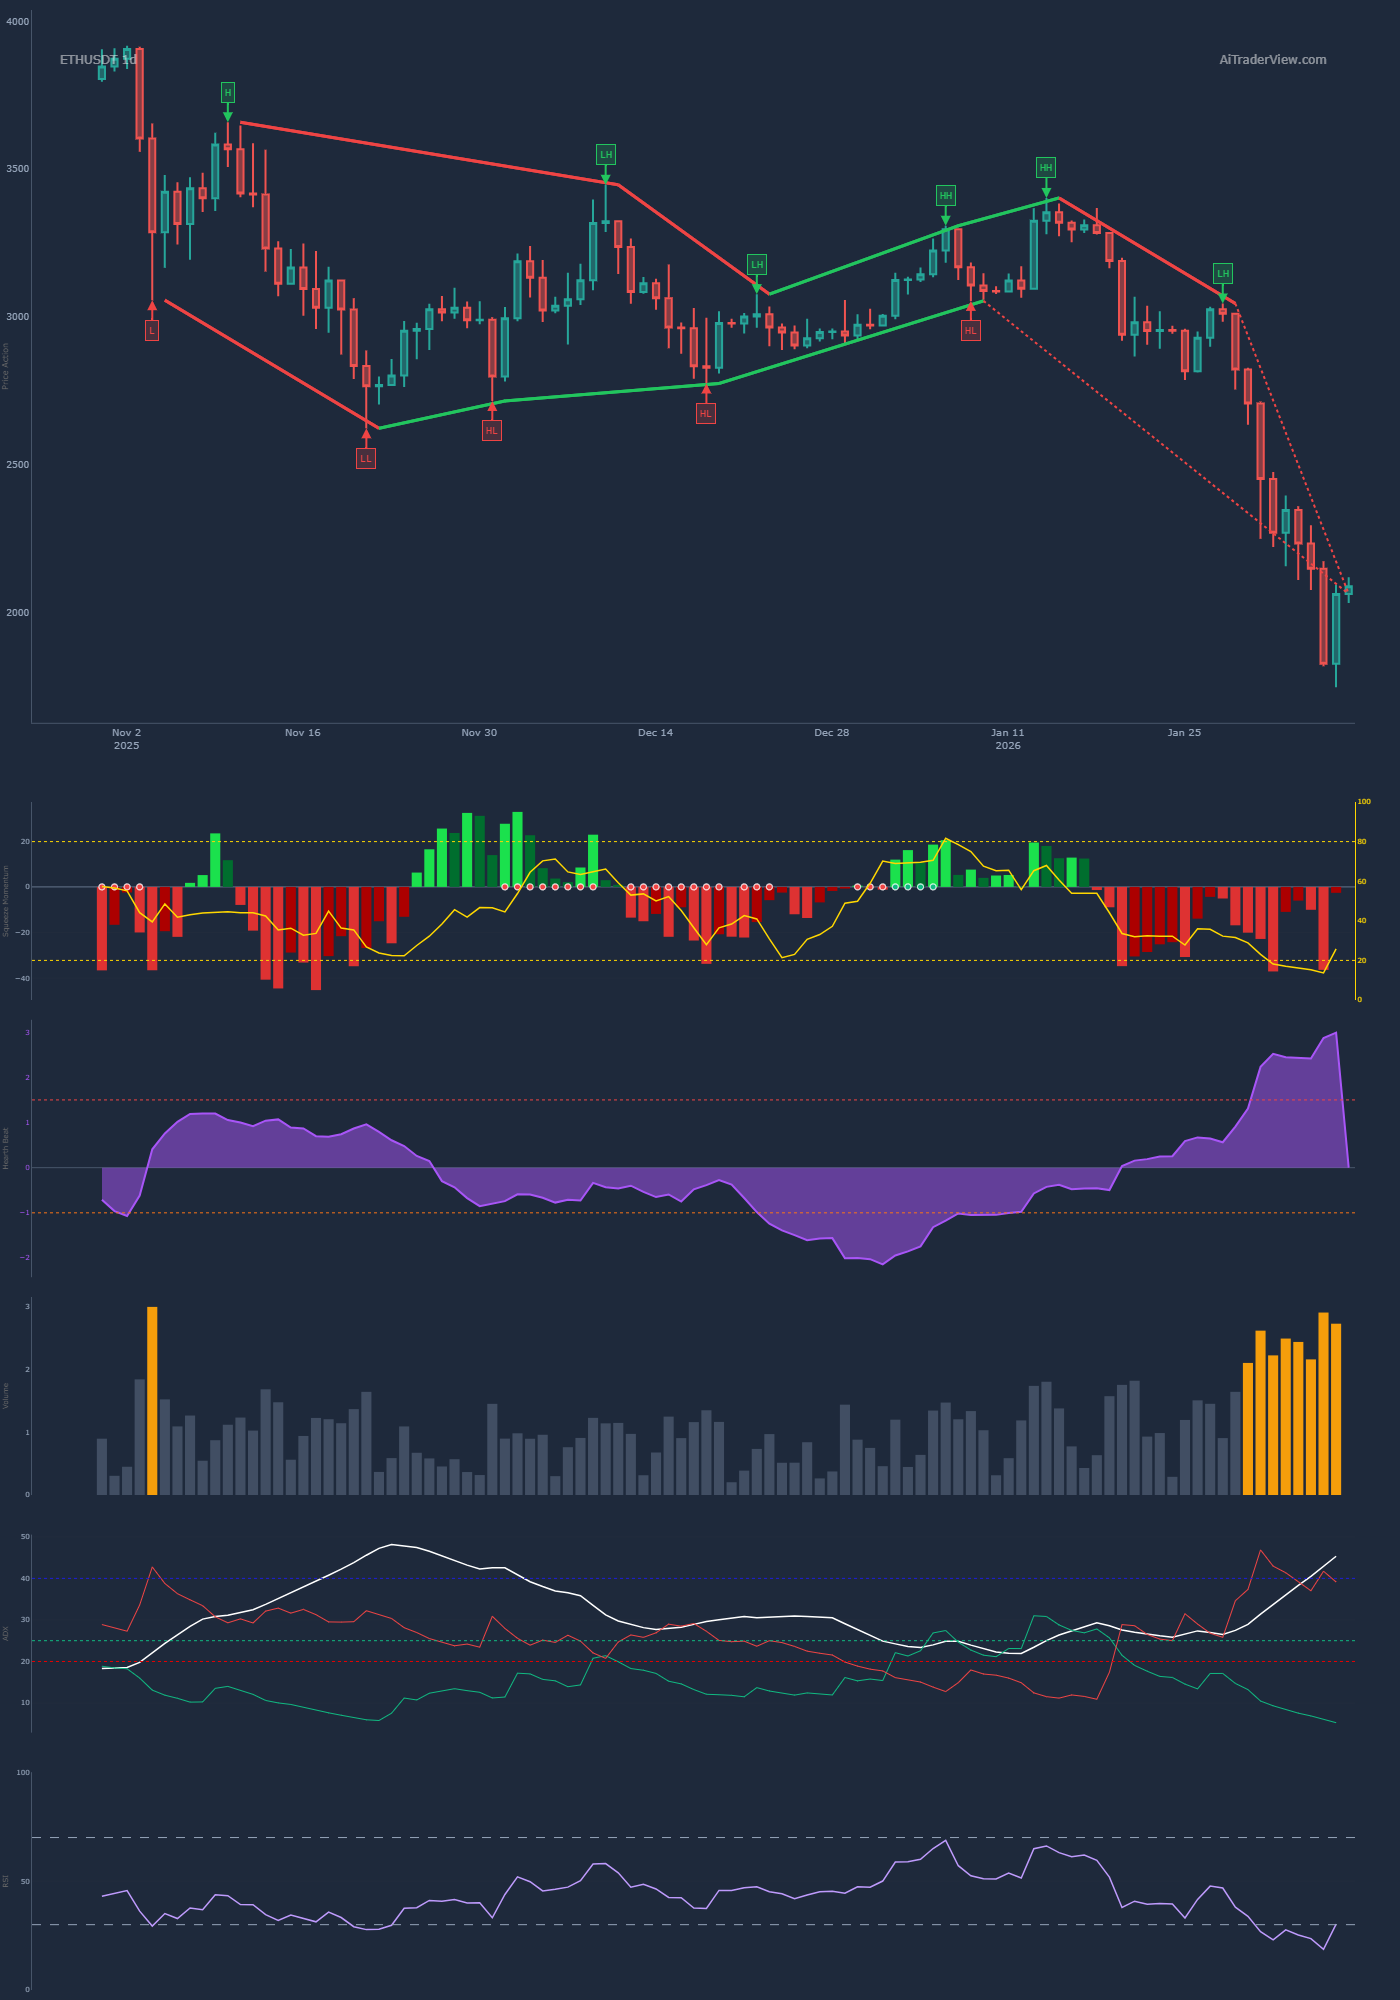
While the hourly charts invoke optimism, the Daily and Weekly timeframes (Charts 3 & 4) serve as a sobering reality check.
The broader market structure for Ethereum remains bearish.
- Lower Highs & Lower Lows: Since the peak above $3,500, ETH has been stuck in a rigorous downtrend. The market structure is defined by a series of lower highs.
- Trend Definition: For a true trend reversal (and not just a “dead cat bounce”), ETH must do more than recover to $2,200. It must structurally break the previous Lower High, which sits roughly between $2,400 and $2,500.
Until that structural break occurs, conservative traders will view the current rally as a selling opportunity within a larger downtrend.
5. Scenarios & Key Levels to Watch
As we head into the remainder of the weekend and the weekly close, here are the pivot points that will define the next move.
🟢 Bullish Scenario (The V-Shape Completion)
If bulls can sustain the momentum and push through the immediate resistance, the targets are:
- $2,150: The first major intraday resistance.
- $2,274 (The POC): The primary target. Reclaiming this flips the bias to neutral-bullish.
- $2,440: The structural Lower High. Breaking this invalidates the macro downtrend.
🔴 Bearish Scenario (Rejection & Continuation)
If the price gets rejected at the EMA 50 or the $2,150 level, we could see a retest of the lows:
- $2,000: Psychological support.
- $1,880: Key Fibonacci support level.
- $1,760: The recent panic low. Losing this level would be catastrophic and likely trigger a move toward $1,500.
Conclusion
Ethereum is currently offering a textbook example of market psychology: panic, capitulation, and a snap-back recovery. The leverage flush has cleansed the market, making the current price action healthier than it was a week ago.
However, traders should exercise extreme caution. We are currently trading below the Point of Control in a macro downtrend. While the V-shape recovery is promising, it remains a “relief rally” until proven otherwise by a reclaim of the $2,274 level.
Disclaimer: This analysis is for informational purposes only and does not constitute financial advice. Cryptocurrency markets are highly volatile. Always conduct your own research before trading.
⚠️ RISK WARNING & AI DISCLOSURE
- This information is generated by Artificial Intelligence (AI) and complex algorithms. While advanced, these systems can contain errors or inaccuracies and are for educational purposes only.
- Technical analysis provides no guarantees; this information is purely informative.
- All discussed scenarios are hypothetical and do not constitute predictions or expectations.
- Past performance is not an indicator of future results.
- This is not financial advice and is not intended as a call-to-action for the reader.
- No implicit direction is claimed, and no specific behavior of market participants is suggested.