Visualizing the Invisible: The Orderbook Heatmap
Visualizing the Invisible: The Orderbook Heatmap
Most traders make decisions based solely on what has already happened (Price Action). But to truly understand where the market is going, you need to see what is waiting to happen. You need to see the pending orders.
The Orderbook Heatmap in AiTraderView is one of the most advanced tools in our suite. It takes the raw, chaotic data of the “Order Book” (Level 2 Data) and visualizes it as a historical map. It reveals the “Liquidity Walls” that act as gravity for the price, showing you exactly where the big players are positioning themselves before the move occurs.
1. What is an Orderbook Heatmap?
Imagine looking at a standard price chart. You see where the price is now. The Orderbook Heatmap adds a new dimension: Depth.
- The Limit Orders: It visualizes all the Buy and Sell Limit orders sitting on the exchange.
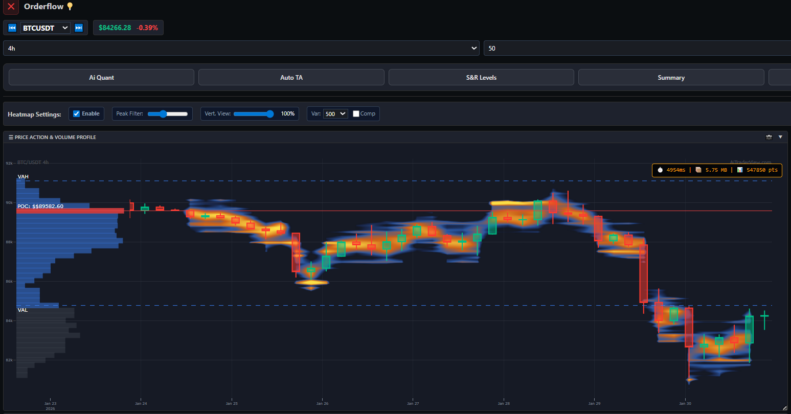
- The Visualization: Instead of boring numbers, it uses color intensity.
- Bright Colors (Red/Yellow/White): Represent massive “Walls” of liquidity. Millions of dollars are waiting to be bought or sold here.
- Dark Areas (Blue/Black): Represent low liquidity zones. There is no resistance here; price can move through these zones like a knife through butter.
Unlike a standard Order Book which only shows the “now,” the Heatmap records history. This allows you to see if a Buy Wall has been sitting there for days (Real Demand) or if it just appeared 5 seconds ago (Potential Spoofing).
2. Key Mechanics: Walls & Magnets
Understanding the Heatmap requires understanding two core behaviors of liquidity:
- The Magnet Effect: Price is often drawn toward large liquidity clusters. Market Makers need liquidity to fill their orders. If there is a massive Buy Wall just below the price, the market will often dip specifically to tap into that liquidity before reversing.
- The Barrier Effect: A massive Sell Wall acts as a ceiling. If you see a bright red band at $50,000, it means thousands of Bitcoins need to be bought to break that level. Unless there is massive aggressive buying, the price will likely bounce off this wall.
3. Interactive Features: The Range Slider
The Heatmap in AiTraderView is dynamic. Because crypto volatility is extreme, a static view is often useless.
- Custom Depth Range: Our tool includes a specialized slider (e.g., 5% to 50%) that allows you to filter the depth.
- Zoom In: Focus on the orders immediately close to the price for scalping.
- Zoom Out: See the massive institutional orders sitting 20% away for swing trading.
4. Detecting “Spoofing” (Fake Orders)
One of the biggest advantages of the Heatmap is the ability to spot manipulation. Large players often place massive Sell Walls to scare retail traders into selling, only to pull the wall right before the price hits it.
- The Ghost Wall: On a standard order book, the wall just disappears. But on the Heatmap, you see the history. If a bright line suddenly vanishes without the price touching it, you have identified Spoofing. This is a bullish signal, as it implies the “resistance” was fake.
5. Strategies Using the Heatmap
Strategy 1: The Liquidity Bounce
- The Setup: Price is dropping fast.
- The Check: Look at the Heatmap below the current price. Is there a solid, bright horizontal line that has been there for hours?
- The Trade: Place your limit buy order just above that wall. You are using the “Whale’s” wall as your shield. If the price hits it, the massive liquidity is likely to absorb the selling pressure, causing a bounce.
Strategy 2: The Breakout (Wall Absorption)
- The Setup: Price is pushing up against a bright Sell Wall.
- The Signal: Instead of rejecting, the price stays pinned against the wall. The bright color starts to fade or turn dark (the orders are being consumed/filled).
- The Trade: This is an Absorption Breakout. Buyers are aggressively eating through the wall. Once the color disappears, the path is clear, and price often explodes upward.
Conclusion
Price charts tell you the history of the market. The Orderbook Heatmap gives you a glimpse into its future. By visualizing the “Invisible Hand” of the market, you stop guessing where support and resistance might be and start seeing exactly where the money is waiting.
Don’t trade blindly against a wall. Open the Heatmap and see the battlefield clearly.
⚠️ RISK WARNING & AI DISCLOSURE
- This information is generated by Artificial Intelligence (AI) and complex algorithms. While advanced, these systems can contain errors or inaccuracies and are for educational purposes only.
- Technical analysis provides no guarantees; this information is purely informative.
- All discussed scenarios are hypothetical and do not constitute predictions or expectations.
- Past performance is not an indicator of future results.
- This is not financial advice and is not intended as a call-to-action for the reader.
- No implicit direction is claimed, and no specific behavior of market participants is suggested.