STATS – Statistics
Detailed Statistical Analysis: The 🌡️ STATS Tab
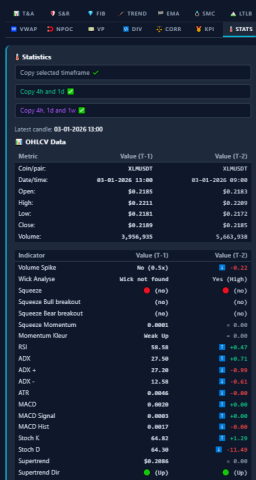
While visual charts are effective for identifying patterns, analytical decision-making often requires raw numerical data. The 🌡️ STATS tab in AiTraderView functions as the “Data Center” of the Auto Technical Analysis suite.
It aggregates Detailed Technical Analysis Statistics in a tabular format, allowing users to compare the current/last completed candle (T-1) against the previous candle (T-2). This comparison provides a quantitative view of momentum and directional shifts without visual chart noise.
In this article, we break down the components of this data table, from export functionality to specific indicator calculations.
1. The Export Tools (Copy Functionality)
At the top of the 🌡️ STATS tab, buttons are available for logging and data transfer. This feature is designed for analysts who maintain trading journals or share data sets.
- Copy selected timeframe ✔️: Copies the full statistics report for the currently viewed timeframe (e.g., specific 4H data).
- Copy 4h and 1d ✅: Automatically fetches and copies the summary data for both the 4-Hour and Daily timeframes.
- Copy 4h, 1d and 1w ✅: Copies a summary of the 4-Hour, Daily, and Weekly statistics simultaneously for a macro overview.
2. Understanding T-1 vs. T-2
The core feature of the Detailed Technical Analysis Statistics tab is the comparative analysis column.
- T-1 (Time minus 1): Represents the last completed candle or the current active analysis period.
- T-2 (Time minus 2): Represents the candle immediately preceding T-1.
- The Delta (Arrow): The system calculates the numerical difference between these two periods.
- ⬆️ +4.18: The value has increased by 4.18 points compared to the previous period.
- ⬇️ -2.49: The value has decreased.
Utility: This delta allows analysts to quantify “Rate of Change.” For example, if the RSI value is high but the Delta is negative (⬇️), it indicates that while momentum is still positive, it is decelerating compared to the previous candle.
3. 📊 OHLCV Data (The Basics)
The first section displays raw price action data:
- Open, High, Low, Close: The exact price coordinates for the selected candle.
- Volume: The total raw volume traded. Comparing Volume T-1 vs T-2 helps identify if activity is increasing or decreasing relative to price movement.
4. Indicator Deep Dive
The 🌡️ STATS tab aggregates data from multiple algorithms. Here is a breakdown of the key metrics:
Volatility & Squeeze
- Squeeze: Displays ⚠️⏳ (yes) if the Bollinger Bands are strictly within the Keltner Channels. Technically, this indicates Volatility Compression, a state often followed by expansion.
- Squeeze Momentum: The numerical value representing the momentum within the compression.
- BB Width: Quantifies the tightness of the Bollinger Bands. Lower values indicate lower volatility.
- ATR (Average True Range): Measures the average price movement per candle, often used for sizing invalidation levels (stops).
- Hist. Volatility (HV) & Rank: A statistical rank (0-100) comparing current volatility to historical norms.
Momentum & Oscillators
- RSI (Relative Strength Index): Standard momentum oscillator.
- MACD (Signal & Hist): Tracks the convergence/divergence of moving averages. A rising Histogram (MACD Hist) indicates bullish momentum expansion.
- Stoch K & D: Fast-moving oscillators used to identify short-term overbought/oversold conditions.
- CCI (Commodity Channel Index): Flags cyclical extremes with 🔴 (Overbought) or ⚪ (Neutral) statuses.
- Z-Score: Measures how many standard deviations the price is from the mean. High Z-Scores (e.g., > 2.0) indicate statistical extension.
Trend & Volume
- Supertrend: Indicates the current trend direction (🔴 Down or 🟢 Up) and the invalidation price level.
- ADX (Average Directional Index): Measures Trend Strength. A rising ADX (e.g., ⬆️ +4.33) suggests the prevailing trend is intensifying.
- OBV (On Balance Volume): Tracks cumulative volume flow.
- CMF (Chaikin Money Flow): Indicates buying/selling pressure. Signals read 🔴 (Bear) or 🟢 (Bull).
- VWAP: The delta shows the price deviation from the institutional volume-weighted average.
Fibonacci & SMC (Smart Money Concepts)
- Fib Levels: Displays exact price levels for standard retracements (e.g., 61.8%, 50%).
- SMC Market Structure: Indicates if the structural trend is 🔴 Bearish or 🟢 Bullish based on “Break of Structure” (BOS) logic.
- FVG (Fair Value Gaps): Lists active price gaps identified by the algorithm.
5. 🤡 Candlestick Patterns
At the bottom of the report, the “Clown” section (a proprietary label for the pattern recognition module) scans the latest 7 candles for standard Japanese Candlestick formations.
- Function: Detects patterns such as Piercing Line, Shooting Star, or Engulfing.
- Usage: This data serves as a confirmation layer. Analysts often look for confluence, such as a “Bullish Engulfing” pattern appearing simultaneously with positive RSI momentum.
Conclusion
The 🌡️ STATS tab is designed for analytical precision. It provides a comprehensive X-Ray of market data.
By monitoring the T-1 vs T-2 deltas, users can quantify market behavior—observing volatility contraction (Squeeze), momentum shifts (RSI delta), or volume changes—presented in a structured format for objective analysis.
⚠️ RISK WARNING & AI DISCLOSURE
- This information is generated by Artificial Intelligence (AI) and complex algorithms. While advanced, these systems can contain errors or inaccuracies and are for educational purposes only.
- Technical analysis provides no guarantees; this information is purely informative.
- All discussed scenarios are hypothetical and do not constitute predictions or expectations.
- Past performance is not an indicator of future results.
- This is not financial advice and is not intended as a call-to-action for the reader.
- No implicit direction is claimed, and no specific behavior of market participants is suggested.