VP – Volume Profile
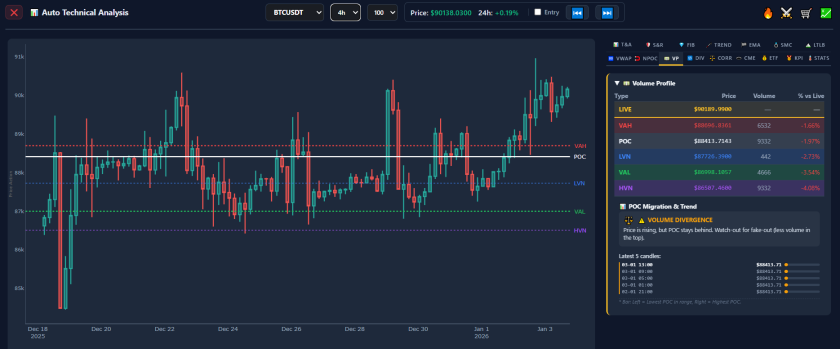
Auction Market Analysis: The 💵 VP Tab
In technical analysis, price is often viewed as the advertising mechanism, while volume is viewed as the acceptance mechanism. Standard charts display price history, but they do not always reveal where the most significant trading activity occurred.
The 💵 VP tab in AiTraderView provides data based on Volume Profile Strategy. Instead of a simple time-based chart, it calculates the specific price levels where buyers and sellers have historically transacted the most volume. In this article, we break down the data in this tab, from the Point of Control to Volume Divergence analysis.
What is the Volume Profile Strategy?
The Volume Profile Strategy is rooted in Auction Market Theory. It posits that the market acts as a mechanism for discovering “Fair Value.”
When users open the 💵 VP tab, they receive a snapshot of this auction process. It indicates whether the market is accepting current prices (building value) or rejecting them (moving rapidly).
Understanding the Key Metrics
The interface lists critical levels utilized in Volume Profile analysis:
1. POC (Point of Control)
- Definition: The single price level where the highest volume was traded during the session.
- Significance: In Auction Market Theory, this represents the “Fair Value” or consensus price. Technical analysts often view the POC as a “magnet.” If price drifts away from the POC without significant volume support, statistical theory suggests a tendency for mean reversion (snapping back) to this high-volume node.
2. VAH (Value Area High) & VAL (Value Area Low) These two levels define the Value Area, which typically contains approximately 70% of the total trading volume for the period.
- VAH: The highest price within the value cluster. Prices above this are technically considered “Overvalued” relative to recent consensus.
- VAL: The lowest price within the value cluster. Prices below this are technically considered “Undervalued.”
- Strategy Context: Traders often monitor these boundaries for reversions (buying at VAL, selling at VAH) or for breakout confirmation (price accepting levels outside the Value Area).
3. HVN (High Volume Node) & LVN (Low Volume Node)
- HVN: A price zone with high traffic, often acting as support or resistance due to the density of historical orders.
- LVN: A price zone with very little volume (a “vacuum”). Technical analysis suggests price tends to move through LVNs rapidly because there is little “friction” or historical liquidity to slow it down.
📊 POC Migration & Trend
This section analyzes the trend of “Fair Value” over time, specifically monitoring the movement of the POC over the last 5 periods (e.g., 5 days or 5 hours).
The status displays one of three technical states:
- ⚖️ Value Consensus: The POC is stationary. The market is consolidating, indicating agreement on the current price.
- ↗️ POC Shift Up: The POC is migrating higher. This is interpreted as a healthy uptrend, where “Value” is rising alongside Price.
- ↘️ POC Shift Down: The POC is migrating lower. This is interpreted as a healthy downtrend.
The “Latest 5 Candles” Visual The tab displays a timeline of the last 5 periods.
- Bar Position: A bar on the left indicates the POC was in the lower range of the candle; a bar on the right indicates it was in the upper range.
- Utility: Analysts look for the bars to “migrate” in the direction of the trend to confirm sustainability.
⚠️ Volume Divergence: The Warning Signal
This feature detects discrepancies between Price action and Volume distribution.
- The Scenario: Price is rising (e.g., +2%), but the Point of Control (POC) remains flat or drops.
- The Interpretation: Price is rising, but “Value” is not following. This indicates that the rally is occurring on lower volume relative to previous levels.
- Technical Implication: This is known as a Volume Divergence. It suggests the move may be “hollow” or unsupported by broad market participation. Technical analysts often monitor this pattern as a potential sign of a False Breakout or “Bull Trap,” anticipating that price may revert to the established POC.
Conclusion
Trading with Volume Profile provides a dimensional view of market structure. The 💵 VP tab offers a dashboard for this analysis, allowing users to differentiate between price movement and value acceptance.
By mastering the Volume Profile Strategy, traders can identify whether a trend is supported by real volume or if it is a low-volume anomaly. Checking POC Migration allows for data-driven confirmation before executing trade decisions.
⚠️ RISK WARNING & AI DISCLOSURE
- This information is generated by Artificial Intelligence (AI) and complex algorithms. While advanced, these systems can contain errors or inaccuracies and are for educational purposes only.
- Technical analysis provides no guarantees; this information is purely informative.
- All discussed scenarios are hypothetical and do not constitute predictions or expectations.
- Past performance is not an indicator of future results.
- This is not financial advice and is not intended as a call-to-action for the reader.
- No implicit direction is claimed, and no specific behavior of market participants is suggested.