SMC – Smart Money Concepts
Analyzing Liquidity & Structure: The 💍 SMC Tab
In active trading, understanding price action often goes beyond standard patterns. Many traders experience scenarios where a Stop Loss is triggered just before the price reverses in the intended direction. In technical theory, this is often attributed to Liquidity Dynamics.
Most standard analysis relies on basic support and resistance, zones where orders (liquidity) often cluster. Smart Money Concepts (SMC) is a methodology designed to analyze these mechanics, focusing on how large volume participants interact with market structure.
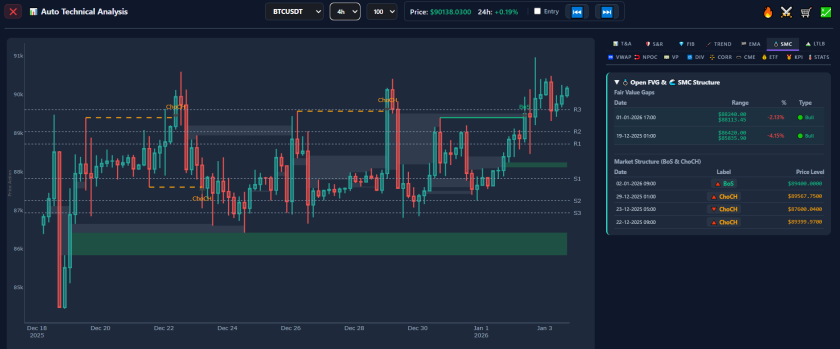
The 💍 SMC tab in AiTraderView’s “Auto Technical Analysis” suite is designed to visualize these concepts. By automating the mapping of Order Blocks and Imbalances, this tool assists traders in identifying structural areas of interest. In this article, we explain how this feature works and how it can be utilized for precise market analysis.
What are Smart Money Concepts?
Smart Money Concepts is a trading methodology that prioritizes liquidity, market structure, and order flow. Unlike traditional technical analysis (which often relies on geometric patterns like wedges), SMC seeks to theorize where significant capital allocation (institutional volume) has occurred.
The 💍 SMC tab automates the identification of these structural elements. Instead of manually annotating charts to find potential liquidity pools or price inefficiencies, the software scans price action to highlight them based on algorithmic definitions.
How to Access the 💍 SMC Tab
To utilize this structural analysis tool, follow these steps:
- Open the Menu: Click the “Auto Technical Analysis” button (📊 icon) for the specific asset.
- Select the Tab: Click on the fifth tab labeled 💍 SMC.
- Analyze the Structure: The interface will visualize key SMC elements relative to the current live price.
Key SMC Components Explained
The 💍 SMC tab identifies specific market phenomena central to this methodology. Understanding these terms is crucial for interpretation.
1. Order Blocks (OB) An Order Block is technically defined as the specific candle representing the last period of consolidation or contrary movement before a significant price displacement (impulse).
- Bullish OB: The last down candle before a significant upward move.
- Bearish OB: The last up candle before a significant downward move.
- Theory: SMC theory suggests these areas act as “magnets” where institutional orders may still be pending. Consequently, they are often monitored as potential reversal zones upon a retest.
2. Fair Value Gaps (FVG) / Imbalance Markets generally seek equilibrium. When a rapid price displacement occurs, it can leave behind a price range where trading occurred only in one direction. This inefficiency is known as a Fair Value Gap.
- Theory: Price often returns to these gaps to “rebalance” the inefficiency. The algorithm identifies these zones as potential targets or support levels.
3. Change of Character (CHoCH) & Break of Structure (BOS) These terms describe the state of the trend.
- BOS (Break of Structure): Occurs when price breaks a swing high (in an uptrend) or swing low (in a downtrend), confirming trend continuation.
- CHoCH (Change of Character): Occurs when price breaks a structural level that opposes the current trend (e.g., breaking a recent low during an uptrend). This is technically interpreted as the first potential sign of a reversal.
4. Liquidity Pools “Liquidity” in this context refers to clusters of pending orders, typically Stop Losses.
- Theory: SMC theory posits that price often moves towards obvious swing highs or lows (“Liquidity Sweeps”) to interact with this volume before reversing direction.
Analytical Concepts Using the 💍 SMC Tab
Integrating Smart Money Concepts into analysis allows for a focus on structural precision.
The “Precision Entry” Concept (Retracement)
- Scenario: The 💍 SMC tab identifies a “Bullish Order Block” below the current price.
- Application: Rather than entering immediately, traders often wait for a retracement into the Order Block. If price stabilizes in this zone, it is viewed as a high-confluence area for entry, allowing for defined risk management (stop loss below the block).
Targeting Inefficiencies (FVG)
- Scenario: A large Fair Value Gap is highlighted above the current price.
- Application: In a bullish trend, this gap often serves as a technical target. Traders anticipate that the market mechanics will drive price to close this inefficiency.
Liquidity Sweep Analysis
- Scenario: An obvious “Double Top” resistance exists.
- Application: Standard analysis might suggest selling immediately. However, SMC warns that buy-stops likely exist above these highs. Traders utilizing this tab often wait to see if a “Sweep” of the high occurs (price briefly breaks above) followed by a rejection, interpreting this as a “Liquidity Grab” rather than a true breakout.
Conclusion
Trading involves navigating complex market structures. The 💍 SMC tab is designed to clarify this landscape. By automating the analysis of Smart Money Concepts, AiTraderView provides users with professional-grade insights into Order Blocks, Imbalances, and Structural shifts, allowing for analysis aligned with institutional theory.
⚠️ RISK WARNING & AI DISCLOSURE
- This information is generated by Artificial Intelligence (AI) and complex algorithms. While advanced, these systems can contain errors or inaccuracies and are for educational purposes only.
- Technical analysis provides no guarantees; this information is purely informative.
- All discussed scenarios are hypothetical and do not constitute predictions or expectations.
- Past performance is not an indicator of future results.
- This is not financial advice and is not intended as a call-to-action for the reader.
- No implicit direction is claimed, and no specific behavior of market participants is suggested.