EMA – Exponential Moving Average
Trend Momentum Analysis: The 🏁 EMA Tab
In cryptocurrency markets, analyzing price momentum is a critical component of technical strategy. While the Simple Moving Average (SMA) is a standard tool, it weighs all data points equally, which can result in significant lag.
The Exponential Moving Average (EMA) addresses this by placing greater weight on the most recent price action. This makes the EMA more responsive to new information, allowing analysts to identify trend shifts earlier. The 🏁 EMA tab in AiTraderView’s “Auto Technical Analysis” suite automates the calculation and visualization of these critical trend lines.
What is the Exponential Moving Average?
The Exponential Moving Average is a weighted moving average that assigns more significance to recent data points. Unlike a simple average, which treats a price from 200 days ago with the same importance as yesterday’s price, the EMA calculation prioritizes recent market behavior.
- Responsiveness: This weighting makes the EMA react faster to price volatility. In technical analysis, this responsiveness is utilized to identify breakouts or breakdowns sooner than with standard averages.
- Automation: The 🏁 EMA tab calculates these values instantly, providing a clear view of the market’s dynamic trend structure.
How to Access the 🏁 EMA Tab
To utilize automated EMA analysis, follow these steps in your dashboard:
- Open the Menu: Click the “Auto Technical Analysis” button (📊 icon) for the specific asset.
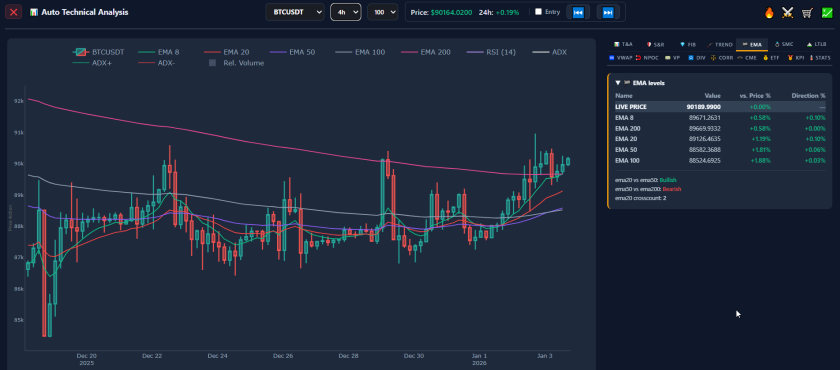
- Select the Tab: Click on the fourth tab labeled 🏁 EMA.
- Analyze: The tool presents the status of key EMAs (such as the 8, 20, 50, 100, and 200) and the current price’s position relative to them.
Key EMA Lines Explained
The 🏁 EMA tab focuses on specific timeframes that are commonly respected in algorithmic and institutional trading. Understanding these lines is crucial for interpreting Exponential Moving Average data effectively.
1. The Short-Term Trend (EMA 8 & 20) These are typically viewed as “momentum” lines.
- Technical Interpretation: In strong parabolic trends, price often stays above the 8 EMA or 20 EMA. Analysts often use these lines to gauge immediate momentum strength; a close below them can signal a loss of short-term velocity.
2. The Medium-Term Trend (EMA 50) The 50 EMA is often considered the baseline for the intermediate trend.
- Technical Interpretation: Institutional analysts often monitor the 50 EMA as a zone of interest. In a sustained uptrend, pullbacks to the 50 EMA are historically viewed as potential areas of “dynamic support.”
3. The Long-Term Trend (EMA 200) This is widely regarded as the “Bull/Bear Line.”
- Technical Interpretation: If the price is trading above the 200 EMA, the asset is technically considered to be in a macro uptrend. If below, it is considered to be in a macro downtrend. The 🏁 EMA tab highlights this relationship, aiding in long-term trend assessment.
Technical Concepts Using the 🏁 EMA Tab
The Exponential Moving Average provides data for several core technical analysis concepts.
Dynamic Support and Resistance Static horizontal lines are fixed, but EMAs provide dynamic levels that adjust with price.
- Concept: As the price trends, the EMA follows. The 🏁 EMA tab helps identify when the price is “testing” these dynamic levels. A reaction off the 20 EMA or 50 EMA is a common technical signal monitored by trend followers.
The Golden Cross and Death Cross The Exponential Moving Average is frequently used to identify crossover events.
- Golden Cross: Occurs when a short-term EMA (e.g., 50) crosses above a long-term EMA (e.g., 200). In technical theory, this is interpreted as a bullish trend confirmation.
- Death Cross: Occurs when the 50 EMA crosses below the 200 EMA. This is interpreted as a bearish trend shift.
The Trend Filter The EMA suite can function as a logic gate for risk management.
- Concept: Analysts often use the EMAs to filter trade direction. If looking for long positions, a standard rule is to require the price to be above key EMAs. Conversely, short positions are often favored when the price is below key EMAs.
Conclusion
The Exponential Moving Average is a foundational tool in technical analysis for smoothing price data and revealing trend direction. The 🏁 EMA tab in AiTraderView automates these calculations, providing objective data on trend momentum.
By integrating this analysis, users gain precise insight into market structure. Whether analyzing short-term momentum on the 8 EMA or macro trends on the 200 EMA, the 🏁 EMA tab provides the necessary data for informed decision-making.
⚠️ RISK WARNING & AI DISCLOSURE
- This information is generated by Artificial Intelligence (AI) and complex algorithms. While advanced, these systems can contain errors or inaccuracies and are for educational purposes only.
- Technical analysis provides no guarantees; this information is purely informative.
- All discussed scenarios are hypothetical and do not constitute predictions or expectations.
- Past performance is not an indicator of future results.
- This is not financial advice and is not intended as a call-to-action for the reader.
- No implicit direction is claimed, and no specific behavior of market participants is suggested.