TREND – Automated Trend Analysis
Automated Trend Analysis: The 🦯 TREND Tab
A common adage in technical analysis states: “The trend is your friend until the bend at the end.” This highlights the principle that assets tend to move in sustained directions. Trading against the prevailing trend (counter-trend trading) carries specific risks, as price momentum can persist longer than anticipated.
The 🦯 TREND tab in AiTraderView is designed to assist in trend identification. By utilizing Automated Trend Analysis, this tool objectively categorizes the dominant direction of market structure. In this article, we explain how this feature works and how it can be used to align strategies with market momentum.
What is Automated Trend Analysis?
Automated Trend Analysis is the process of using algorithms to determine the directional bias of an asset’s price. Instead of manual visual inspection for “Higher Highs” or “Lower Lows,” the software calculates these structural points algorithmically.
The 🦯 TREND tab analyzes market structure to categorize the asset into three primary states:
- Bullish (Uptrend): The price is making a sequence of higher highs and higher lows. Technically, this indicates demand is exceeding supply.
- Bearish (Downtrend): The price is making a sequence of lower highs and lower lows. Technically, this indicates supply is exceeding demand.
- Sideways (Ranging): The price is oscillating between support and resistance with no clear directional bias.
By utilizing Automated Trend Analysis, traders can base decisions on calculated pivot points rather than subjective interpretation of single candles.
How to Access the 🦯 TREND Tab
To access this analysis module, follow these steps within the dashboard:
- Open the Menu: Click on the “Auto Technical Analysis” button (📊) for the specific asset.
- Select the Tab: Click on the third tab labeled 🦯 TREND.
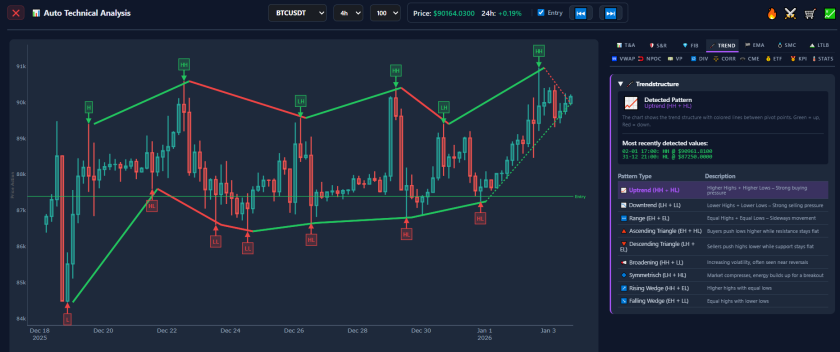
- Review the Direction: The interface displays the current trend status, accompanied by the structural data points utilized for the calculation.
Understanding Market Structure
To utilize Automated Trend Analysis effectively, it is helpful to understand the underlying mechanics. The tool identifies specific patterns in price action.
The Anatomy of an Uptrend In a Bullish scenario, the 🦯 TREND tab identifies a series of Higher Highs (HH) and Higher Lows (HL).
- Strategy Context: In trend-following strategies, traders often look for entries near the Higher Low (pullbacks). Technical theory suggests that shorting in a confirmed uptrend has a lower probability of success compared to trading with the momentum.
The Anatomy of a Downtrend In a Bearish scenario, the tool detects Lower Lows (LL) and Lower Highs (LH).
- Strategy Context: Here, strategies often focus on selling or shorting near the Lower High (rallies). Technical theory warns that purchasing during a confirmed downtrend carries the risk of the asset continuing to new lows.
Strategies Using the 🦯 TREND Tab
Integrating Automated Trend Analysis into a workflow allows for consistent decision-making. Here are three common applications:
1. The Trend Filter This functions as a risk management rule. Before executing a trade, analysts verify the 🦯 TREND status.
- Application: If a user intends to Buy (Long), they may require the trend status to be Bullish (or Neutral). If the trend is Bearish, the trade might be filtered out to avoid fighting negative momentum.
2. Multi-Timeframe Alignment Professional analysis often seeks “alignment” across time horizons.
- Application: If trading on a shorter timeframe (e.g., 15-minute), analysts may check the Automated Trend Analysis for a higher timeframe (e.g., 4-hour). If both the “Big Picture” (4h) and “Local Picture” (15m) are Bullish, the setup is considered to have Timeframe Confluence.
3. Identifying Trend Reversals The 🦯 TREND tab assists in managing open positions.
- Application: If a long position is active, and the Automated Trend Analysis shifts from “Bullish” to “Neutral” or “Bearish,” it serves as a technical signal that momentum has stalled or reversed. This data is often used to inform decisions regarding profit-taking or stop-loss adjustments.
The Value of Objective Data
Market volatility can influence decision-making. Automated Trend Analysis provides a calculated baseline. It disregards external noise (news, sentiment) and focuses solely on price action structure. By anchoring decisions to objective structural data, traders can maintain a consistent approach to market analysis.
Conclusion
Identifying the trend is a foundational step in technical analysis. With the 🦯 TREND tab, users have access to a professional-grade Automated Trend Analysis tool, enabling efficient identification of the dominant market structure.
⚠️ RISK WARNING & AI DISCLOSURE
- This information is generated by Artificial Intelligence (AI) and complex algorithms. While advanced, these systems can contain errors or inaccuracies and are for educational purposes only.
- Technical analysis provides no guarantees; this information is purely informative.
- All discussed scenarios are hypothetical and do not constitute predictions or expectations.
- Past performance is not an indicator of future results.
- This is not financial advice and is not intended as a call-to-action for the reader.
- No implicit direction is claimed, and no specific behavior of market participants is suggested.