FIB – Automated Fibonacci Retracement
Algorithmic Retracement Analysis: The 💎 FIB Tab
In technical analysis, identifying potential support levels during a correction is a core discipline. A widely utilized method for this is the Fibonacci Sequence. However, manual identification of “Swing Highs” and “Swing Lows” can be inconsistent and prone to subjectivity.
Enter the 💎 FIB tab. This component of the “Auto Technical Analysis” suite utilizes an Auto Fibonacci Retracement algorithm to standardize this process. In this article, we explore how this feature works and how it identifies potential areas of technical interest.
What is Auto Fibonacci Retracement?
Fibonacci Retracements are horizontal lines that indicate potential areas of support and resistance based on the mathematical Fibonacci sequence. Traders use them to identify strategic price levels for validation, invalidation, or targets.
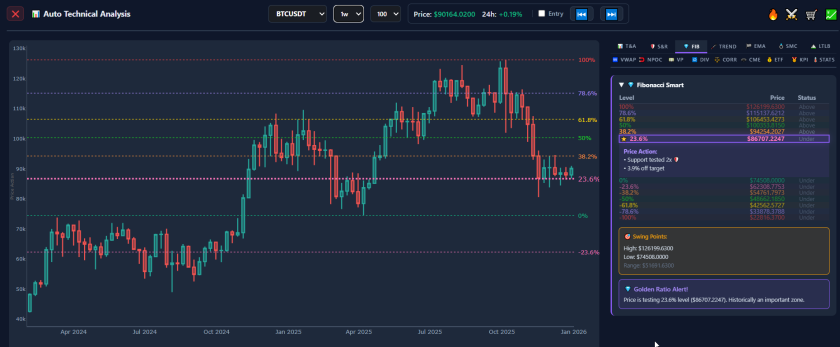
The Auto Fibonacci Retracement feature automatically scans the chart for significant pivot points over a selected timeframe. It then calculates and overlays the standard Fibonacci ratios (0.236, 0.382, 0.5, 0.618, 0.786) onto the current price structure. This ensures that the analysis is based on consistent, objective data rather than manual guesswork.
Accessing the 💎 FIB Tab
To utilize this tool, follow these steps within the dashboard:
- Open the Analysis Menu: Click on the “Auto Technical Analysis” button (📊) for the chosen asset.
- Select the Tab: Click on the second tab labeled 💎 FIB.
- Review the Levels: The system instantly calculates and displays the retracement levels relative to the current market structure.
The Concept of the “Golden Pocket”
Within Fibonacci analysis, a specific zone is frequently monitored by technical analysts: the Golden Pocket.
- Definition: The area between the 0.618 and the 0.65 Fibonacci levels.
- Market Theory: In algorithmic trading theory, this zone is often cited as a high-volume area for institutional orders.
- Application: When price retraces into the Golden Pocket highlighted by the 💎 FIB tab, analysts often monitor for reversal signals (such as candlestick patterns) to confirm potential support.
Understanding the Key Levels
The 💎 FIB tab displays several lines. Understanding the technical theory behind each is key to utilizing the tool effectively:
1. The Shallow Pullback (0.382)
- Context: If a trend exhibits strong momentum (parabolic), retracements are often shallow.
- Interpretation: Technical theory suggests that holding the 0.382 level indicates significant buyer strength. Strategies focusing on this level are typically considered “aggressive.”
2. The Equilibrium (0.5)
- Context: While not technically a Fibonacci number, the 0.5 level represents the midpoint of a price swing.
- Interpretation: Psychologically, this is often viewed as a “fair value” reset point within a broader trend.
3. The Deep Retracement (0.618 – 0.786)
- Context: This zone represents a significant correction of the previous move.
- Interpretation: If the Auto Fibonacci Retracement tool shows price entering this zone, it is often analyzed for its Risk-to-Reward profile. In long setups, invalidation levels (Stop Losses) can be placed relatively tight below the swing low, while targeting the previous highs.
Benefits of Automating Retracements
Why utilize the 💎 FIB tab instead of manual drawing tools?
- Consistency: The algorithm applies identical logic to every chart, eliminating the inconsistency of choosing different pivot points (e.g., wicks vs. bodies).
- Efficiency: Instantly visualize levels for multiple assets without manual charting time.
- Relevance: The tool is programmed to identify the most relevant swing points for the current price action, filtering out outdated historical data.
Conclusion
The Fibonacci sequence provides a mathematical framework for analyzing price corrections. By using the 💎 FIB tab, users can access Auto Fibonacci Retracement data instantly. Whether analyzing a dip in an uptrend or a rally in a downtrend, the tool provides a precise, data-driven map of market structure.
⚠️ RISK WARNING & AI DISCLOSURE
- This information is generated by Artificial Intelligence (AI) and complex algorithms. While advanced, these systems can contain errors or inaccuracies and are for educational purposes only.
- Technical analysis provides no guarantees; this information is purely informative.
- All discussed scenarios are hypothetical and do not constitute predictions or expectations.
- Past performance is not an indicator of future results.
- This is not financial advice and is not intended as a call-to-action for the reader.
- No implicit direction is claimed, and no specific behavior of market participants is suggested.