S&R – Automated Support and Resistance
Automated Structural Analysis: The 🛡️ S&R Tab
In the volatility of cryptocurrency markets, analyzing price structure is a fundamental task. At the core of this analysis lies the concept of Support and Resistance (S&R). However, identifying these levels manually can be subjective and time-consuming.
The 🛡️ S&R tab in the AiTraderView “Auto Technical Analysis” suite is designed to streamline this process. By leveraging Automated Support and Resistance algorithms, this feature provides a standardized method for charting market structure. In this guide, we explore how this tool functions and how it can be used to identify potential zones of interest.
What is Automated Support and Resistance?
Support and Resistance represent key structural levels in price action theory.
- Support: A price level where a downtrend historically tends to pause due to a concentration of demand (buying interest).
- Resistance: A price level where an uptrend historically tends to pause due to a concentration of supply (selling interest).
The Automated Support and Resistance feature scans historical price data, volume profiles, and market structure to generate these levels algorithmically. Instead of manual charting, users can click the 🛡️ S&R tab to receive an immediate, data-driven overview of the current market structure.
How to Access the 🛡️ S&R Tab
Accessing the data is seamless within the dashboard:
- Open the Menu: Click on the “Auto Technical Analysis” button (📊) for the specific asset.
- Select the Tab: Navigate to the first tab labeled 🛡️ S&R.
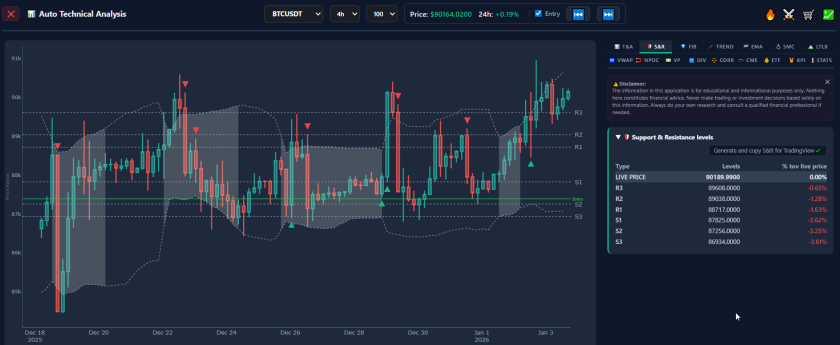
- Analyze: The interface displays a summary of the calculated key levels above (Resistance) and below (Support) the current price.
Why Use Automated Support and Resistance?
Novice analysts often treat support and resistance as exact numbers, whereas professional theory defines them as “zones.” The Automated Support and Resistance engine is designed to highlight these zones based on mathematical significance.
1. Efficiency & Speed Crypto markets operate with high velocity. Automated calculation allows for instant visualization of Weekly, Daily, and 4-Hour levels, enabling users to react to market data in real-time without the latency of manual drawing.
2. Reducing Subjective Bias During active trades, manual analysis can be influenced by confirmation bias (e.g., placing a support level where one hopes the price will stop). An algorithm eliminates this emotional component, displaying levels based solely on historical data points, which helps maintain analytical objectivity.
3. Planning & Risk Management Identifying resistance levels assists in defining potential Take Profit (TP) targets. Conversely, identifying automated support levels assists in defining technical Stop Loss (SL) or invalidation points.
Educational Concepts: Trading with S&R Levels
Once levels are identified, traders often apply standard technical strategies:
The Mean Reversion (Bounce) Concept
- Theory: If price approaches a major Automated Support level, analysts monitor for signs of demand.
- Application: Traders often look for confirmation (such as candlestick patterns or RSI divergence) to validate the support level before considering a long position, using the level as an invalidation reference.
The Breakout and Retest
- Theory: Resistance levels are technically defined as supply zones. When price breaks through a resistance level with volume, market structure theory suggests that the old resistance may flip to become new support.
- Application: Conservative strategies often wait for the price to return and “retest” the breached level to confirm the new structure before entry.
The S/R Flip
- Theory: An “S/R Flip” occurs when a significant level changes its function (e.g., broken support becomes resistance).
- Utility: The 🛡️ S&R tab is designed to identify these historical pivot points, helping traders recognize when the market bias has shifted.
Conclusion
Technical analysis benefits from consistency. The 🛡️ S&R tab provides a standardized, always-on analyst tool. By integrating Automated Support and Resistance into the workflow, users ensure that their assessment of market structure is based on consistent algorithmic data rather than subjective guesswork.
Next Step: I have now processed all the provided articles. If you are ready, I can compile the final Disclaimer text for your footer, or you can send more content if you have it.
⚠️ RISK WARNING & AI DISCLOSURE
- This information is generated by Artificial Intelligence (AI) and complex algorithms. While advanced, these systems can contain errors or inaccuracies and are for educational purposes only.
- Technical analysis provides no guarantees; this information is purely informative.
- All discussed scenarios are hypothetical and do not constitute predictions or expectations.
- Past performance is not an indicator of future results.
- This is not financial advice and is not intended as a call-to-action for the reader.
- No implicit direction is claimed, and no specific behavior of market participants is suggested.