Crypto Heatmap Statistics
Analyzing Market Outliers: Crypto Heatmap Statistics
The Crypto Heatmap Statistics section within AiTraderView is designed to provide an efficient overview of daily market data. Instead of manually scanning individual charts, the algorithm aggregates and filters market movements in real-time.
This article explains how to navigate the “Extra information” section on the Heatmap tab and details the technical significance of these metrics.
What Are Crypto Heatmap Statistics?
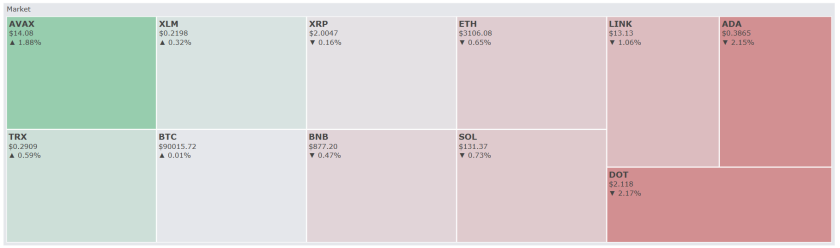
The Crypto Heatmap Statistics can be found directly below the visual block-based heatmap on the “🌍 Crypto Heatmap” tab. While the colored blocks provide a visual representation of broad market sentiment, the “Extra information” section provides granular numerical data.
This section is divided into three data columns updated in real-time:
- Top Gainers (Day %)
- Top Losers (Day %)
- Top Volatile (ADX)
Monitoring these statistics allows users to identify assets exhibiting significant price changes or trend strength relative to the broader market.
1. Top Gainers (Day %) – Daily Performance Leaders
The first column displays the Top Gainers. These are the crypto assets that have recorded the highest percentage return over the last 24 hours.
Market Context:
- Momentum Analysis: Assets in this list often exhibit high trading volume. In technical analysis, strong upward price movement accompanied by high volume is often interpreted as bullish momentum.
- Volatility Risk: It is important to note that assets with significant short-term gains (e.g., >50%) historically carry a higher risk of volatility or corrective price action.
2. Top Losers (Day %) – Relative Weakness
The second column shows the Top Losers. These are the assets that have seen the largest percentage decline over the last 24 hours.
Market Context:
- Oversold Conditions: In technical analysis, a significant price drop is sometimes correlated with “oversold” conditions on oscillators like the RSI. Some traders monitor this data to identify assets that may be deviating significantly from their mean price.
- Fundamental vs. Technical: A presence in this list can reflect negative news or broad market sentiment. Distinguishing between a technical correction and a fundamental shift is a key part of analysis.
3. Top Volatile (ADX) – Trend Strength Analysis
The third column within the statistics section is the Top Volatile (ADX).
ADX (Average Directional Index) is a technical indicator that measures the strength of a trend, regardless of its direction (up or down).
Interpreting ADX Scores:
- High ADX (>25-30): In standard technical analysis, a value above 25 indicates a strong trend is present. This suggests the price is moving with significant momentum in one direction.
- Low ADX: A low score typically indicates a non-trending or sideways market (consolidation).
Utility: Traders seeking volatility often filter for high ADX values to identify assets that are actively trending, as opposed to those in consolidation phases.
How to Navigate to These Statistics
Accessing this data in AiTraderView is straightforward:
- Click on the “🌍 Crypto Heatmap” button in the main navigation menu.
- Scroll down past the colored price tiles.
- Locate the section titled “Extra information”.
- Here you will view the live columns for Gainers, Losers, and Volatile assets.
Conclusion
Efficient market analysis often relies on filtering data effectively. The Crypto Heatmap Statistics in AiTraderView isolate specific market outliers, allowing users to quickly identify which assets are exhibiting the highest momentum or volatility.
By combining data on Top Gainers, Top Losers, and ADX trends with personal chart analysis, users can gain a clearer perspective on current market dynamics.
⚠️ RISK WARNING & AI DISCLOSURE
- This information is generated by Artificial Intelligence (AI) and complex algorithms. While advanced, these systems can contain errors or inaccuracies and are for educational purposes only.
- Technical analysis provides no guarantees; this information is purely informative.
- All discussed scenarios are hypothetical and do not constitute predictions or expectations.
- Past performance is not an indicator of future results.
- This is not financial advice and is not intended as a call-to-action for the reader.
- No implicit direction is claimed, and no specific behavior of market participants is suggested.