KPI: CEW (Crypto–Equity Correlation)
Macro-Economic Analysis: The Crypto-Equity Correlation (CEW)
The Crypto-Equity Correlation (often referred to as the CEW) is a macro-economic KPI that measures the statistical relationship between the cryptocurrency market and traditional equity markets.
In the modern financial era, digital asset movements are frequently analyzed in the context of broader global finance. Major institutional participants often categorize Bitcoin and Ethereum alongside “Risk-On” assets, such as high-growth technology stocks. Understanding the Crypto-Equity Correlation allows analysts to determine whether the crypto market is moving independently or if its volatility is statistically linked to Wall Street.
1. Understanding the Correlation Coefficient
To utilize this metric, it is necessary to understand the mathematical scoring. The Crypto-Equity Correlation is expressed as a numerical value ranging from -1.00 to +1.00.
- +1.00 (High Positive Correlation): Crypto and Equities move in the same direction. Example: A statistical lockstep where a 2% rise in the Nasdaq is mirrored by a rise in Bitcoin.
- 0.00 (Uncorrelated/Decoupled): There is no statistical relationship. Crypto movements are likely driven by internal sector-specific factors (e.g., regulatory news or protocol updates).
- -1.00 (Inverse Correlation): Crypto and Equities move in opposite directions. Historically, this negative correlation has been observed during specific “Flight to Safety” events, though it is less common.
2. Key Status Indicators
The dashboard provides a qualitative assessment based on the current Crypto-Equity Correlation score.
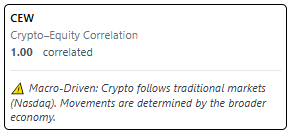
🔗 Correlated (Score > 0.70)
- Status: Macro-Driven
- Interpretation: When the correlation is high, volatility in the crypto market is often influenced by broader economic factors. Variables such as Federal Reserve interest rate decisions, CPI (inflation) data, or tech sector earnings typically become primary drivers.
- Market Context: During these phases, analysts often monitor US Stock Market hours, as crypto volatility may mirror traditional market sessions. Technical chart patterns on crypto assets may be less reliable if macro pressure is the dominant force.
⛓️ Decoupled (Score < 0.30)
- Status: Crypto-Native
- Interpretation: A low correlation suggests the crypto market is exhibiting independent volatility, driven by sector-specific catalysts rather than external macro sentiment.
- Market Context: Traders often focus on crypto-specific KPIs—such as ETF Flows, Open Interest (OID), and Smart Money Concepts (SMC)—during these periods, as the asset class is showing a lower sensitivity to traditional equity movements.
3. Why Monitoring Correlation is Essential
Tracking this metric helps identify the source of market volatility.
- Risk Assessment: If the Nasdaq is experiencing a downturn and the Crypto-Equity Correlation is high (near 1.00), historical data suggests Bitcoin is likely to face similar downward pressure.
- identifying Relative Strength: If the stock market is negative but crypto remains positive while “Decoupled,” it signals internal strength within the crypto ecosystem independent of macro-economic drag.
- Institutional Behavior: A high correlation often reflects heavy institutional participation, where “Risk-On” assets are bought or sold across the board based on global liquidity conditions.
4. Integration with MMS V2
The CEW provides the necessary “Environmental Context” for the [Internal Link: Market Macro Score (MMS) V2].
- Macro Warning Logic: If the correlation is high and the VIX (Volatility Index) spikes, the MMS algorithm is designed to lower its confidence score. This reflects the increased risk of external contagion, even if the individual crypto chart structure appears bullish.
- Trend Validation: When the MMS identifies a trend while the Crypto-Equity Correlation is Decoupled, the signal is categorized as a “Crypto-Specific Trend.” These trends are statistically less likely to be invalidated by minor stock market fluctuations.
5. Summary of Correlation Scenarios
| CEW Value | Status | Market Driver | Analytical Focus |
| 0.80 to 1.00 | 🔗 Correlated | Wall Street / Macro | Monitor Nasdaq/S&P 500 levels. |
| 0.40 to 0.70 | ⚪ Moderate | Mixed | Use both Macro and Crypto KPIs. |
| -0.30 to 0.30 | ⛓️ Decoupled | Crypto Fundamentals | Focus on crypto-specific technicals. |
Educational Note
Traders often pay close attention to the Crypto-Equity Correlation during FOMC Meetings. If the correlation is high, the “Macro-Driven” status suggests that interest rate announcements will likely have a significant impact on crypto volatility.
For broader context, users can track the S&P 500 Performance to observe how traditional finance is reacting in real-time.
⚠️ RISK WARNING & AI DISCLOSURE
- This information is generated by Artificial Intelligence (AI) and complex algorithms. While advanced, these systems can contain errors or inaccuracies and are for educational purposes only.
- Technical analysis provides no guarantees; this information is purely informative.
- All discussed scenarios are hypothetical and do not constitute predictions or expectations.
- Past performance is not an indicator of future results.
- This is not financial advice and is not intended as a call-to-action for the reader.
- No implicit direction is claimed, and no specific behavior of market participants is suggested.