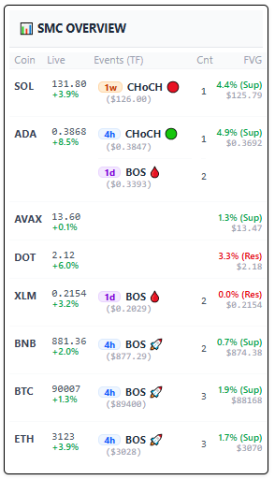
KPI: SMC OVERVIEW (Smart Money Concepts)
Analyzing Market Structure: The SMC Overview
The SMC Overview is an advanced analytical tool designed for traders utilizing Smart Money Concepts (SMC). This methodology focuses on interpreting Market Structure and Price Imbalances to understand potential liquidity flows.
Instead of relying solely on traditional oscillators, this dashboard scans multiple assets to identify structural levels and potential liquidity gaps that technical theory suggests price may revisit.
1. Market Structure Events & Timeframes (TF)
The Events column tracks structural shifts across different timeframes (e.g., 4h, 1d, 1w). These signals classify the current technical “state” of the trend:
CHoCH (Change of Character)
In SMC theory, a CHoCH signals a potential shift in market bias. It occurs when the price breaks a structural high or low that was responsible for the preceding move.
- 🟢 CHoCH (Bullish): Indicates a potential shift from a bearish to a bullish bias. This structure suggests buying pressure is overcoming previous selling pressure.
- 🔴 CHoCH (Bearish): Indicates a potential shift from a bullish to a bearish bias. This structure suggests selling pressure is overcoming previous buying pressure.
BOS (Break of Structure)
A BOS signals trend continuation in technical analysis. It occurs when the price breaks a previous high or low in the direction of the prevailing trend.
- 🚀 BOS (Bullish): The price has exceeded a recent structural high, which is technically interpreted as confirmation of uptrend strength.
- 🩸 BOS (Bearish): The price has broken below a recent structural low, which is technically interpreted as confirmation of downtrend strength.
2. FVG (Fair Value Gaps) & Detection Recency
Market movements driven by high volume can create inefficiencies known as Fair Value Gaps (FVG). In SMC theory, these are price ranges where liquidity was thin, creating a “vacuum” that the market often revisits to achieve equilibrium.
- FVG Price: The specific price level where the imbalance exists.
- Distance %: The percentage distance of the current price from the FVG.
- Type (Sup/Res):
- (Sup): The FVG is below the price and may function as Support.
- (Res): The FVG is above the price and may function as Resistance.
- Cnt (Count): Represents the age of detection. It indicates how many candles have passed since the structure was first identified.
3. How to Interpret the Data
The SMC Overview allows users to combine structural signals with liquidity zones:
- Identify the Bias: A 🚀 BOS on a high timeframe is used to confirm the prevailing trend direction.
- Locate Areas of Interest: Once a bias is identified, analysts often look for the nearest FVG (Sup). If it has a Low Cnt, it indicates a recent zone where price might retrace for a “re-fill” or test.
- Spot Potential Reversals: A 🔴 CHoCH on a high timeframe (e.g., Daily) is a significant technical signal indicating that the structural bias may be flipping.
4. Integration with MMS V2
The SMC data provides the “Structural Backbone” for the Market Macro Score (MMS):
- Phase Validation: The MMS algorithm requires structural validation (e.g., a Bullish BOS) before categorizing a market phase as “Growth.”
- Target Logic: The MMS utilizes FVG levels to calculate potential reversal points, identifying where institutional liquidity may be resting according to the algorithm’s logic.
5. Summary of SMC Symbols
| Symbol | Event Type | Meaning | Technical Context |
| 🟢 CHoCH | Change of Character | Potential Trend Reversal UP | Monitor for bullish structure formation. |
| 🔴 CHoCH | Change of Character | Potential Trend Reversal DOWN | Monitor for bearish structure formation. |
| 🚀 BOS | Break of Structure | Trend Continuation UP | Indicates uptrend strength. |
| 🩸 BOS | Break of Structure | Trend Continuation DOWN | Indicates downtrend strength. |
| Cnt | Detection Age | Candles since detection | Measures the recency of the signal. |
Educational Note:
Traders often pay attention to signals with a high Distance % combined with a low Cnt. This combination suggests a significant, rapid move occurred recently. In technical analysis, such zones are frequently monitored as potential targets for a “liquidity re-test.”
⚠️ RISK WARNING & AI DISCLOSURE
- This information is generated by Artificial Intelligence (AI) and complex algorithms. While advanced, these systems can contain errors or inaccuracies and are for educational purposes only.
- Technical analysis provides no guarantees; this information is purely informative.
- All discussed scenarios are hypothetical and do not constitute predictions or expectations.
- Past performance is not an indicator of future results.
- This is not financial advice and is not intended as a call-to-action for the reader.
- No implicit direction is claimed, and no specific behavior of market participants is suggested.