KPI: Squeeze Radar
Volatility Expansion Analysis: The Squeeze Radar
The Squeeze Radar is a specialized KPI designed to analyze volatility cycles. It identifies periods of market consolidation where price action is compressing. In technical analysis theory, periods of low volatility (consolidation) are statistically often followed by periods of high volatility (expansion).
The Squeeze Radar monitors this compression across four critical timeframes (1h, 4h, 1d, 1w) to provide data on how “tight” the current range is and which direction the momentum metrics are leaning.
1. Reading the Radar Grid
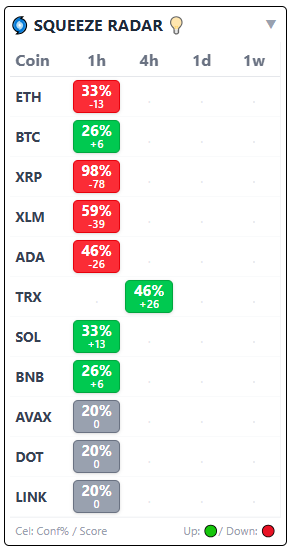
The dashboard displays a real-time matrix of top-tier assets and their volatility status. Each cell contains two vital data points:
The Squeeze Intensity (e.g., 80%)
This percentage represents the degree of Volatility Compression.
- Low % (e.g., 25%): The market is in a standard volatility state or has recently expanded.
- High % (e.g., 80%+): A “High Compression” state is detected. Technically, this occurs when the Bollinger Bands contract within the Keltner Channels. Historically, higher compression values precede larger volatility expansions.
The Directional Score (e.g., +58 or -60)
This score indicates the current Momentum Bias within the consolidation.
- Positive (+) Score: Technical indicators suggest momentum is building to the Upside.
- Negative (-) Score: Technical indicators suggest momentum is building to the Downside.
2. Status Triggers: 🚀 vs 🩸
When the algorithm detects that the compression phase is ending and volatility is expanding, it replaces the percentage with a directional icon:
- 🚀 (Rocket): Upside Expansion detected. The price has broken out of the consolidation range to the upside with momentum.
- 🩸 (Blood): Downside Expansion detected. The price has broken out of the consolidation range to the downside.
3. Multi-Timeframe Analysis
The utility of the Squeeze Radar is enhanced by Timeframe Confluence:
- Intraday Squeeze (1h/4h): Analyzes volatility relevant for short-term sessions.
- Macro Squeeze (1d/1w): Analyzes broader trend shifts. In technical analysis, an 80%+ Squeeze on the Daily (1d) timeframe is a significant signal, often suggesting a potential trend-defining move is developing.
- Alignment: If the 1h, 4h, and 1d timeframes all display high percentages with the same directional bias, the statistical weight of the signal increases due to the confluence of data.
4. Integration with MMS V2
The Squeeze Radar serves as an input for the Market Macro Score (MMS):
- Risk Identification: If the MMS is Bullish but the Squeeze Radar shows a high percentage with a negative score, it indicates a divergence. This suggests potential downside volatility risk despite the broader bullish trend.
- Momentum Confirmation: When a 🚀 trigger appears on the 4h or 1d timeframe, the MMS may upgrade the market phase to “Aggressive Growth,” interpreting the move as a breakout supported by momentum.
5. Summary Table: Signal Interpretation
| Signal | Technical Meaning | Interpretation |
| High % (>70) & (+) Score | Bullish Coil building | Monitoring for potential upside breakout. |
| High % (>70) & (-) Score | Bearish Coil building | Monitoring for potential downside breakdown. |
| 🚀 Rocket Icon | Squeeze Fired UP | Upside volatility expansion confirmed. |
| 🩸 Blood Icon | Squeeze Fired DOWN | Downside volatility expansion confirmed. |
Educational Note:
Traders often pay close attention when assets like BTC and SOL show 🚀 triggers simultaneously. In market correlation theory, this can indicate a sector-wide “Short Squeeze” event, potentially leading to significant price displacement across the market.
⚠️ RISK WARNING & AI DISCLOSURE
- This information is generated by Artificial Intelligence (AI) and complex algorithms. While advanced, these systems can contain errors or inaccuracies and are for educational purposes only.
- Technical analysis provides no guarantees; this information is purely informative.
- All discussed scenarios are hypothetical and do not constitute predictions or expectations.
- Past performance is not an indicator of future results.
- This is not financial advice and is not intended as a call-to-action for the reader.
- No implicit direction is claimed, and no specific behavior of market participants is suggested.